

1 Introduction
The majority of urban and rural hydrographic basins are exposed to domestic, farming, and industrial wastes, indicating that the consequences of such effects depend on a complex combination of factors, such as the volume of effluents and the discharge of the receiving water body [1]. Thus, efficient assessment tools capable of detecting the degree of pollution and the tolerance to its effects on the biota are required [2].
Traditional techniques based on physical, chemical and bacteriological characteristics are not sufficient to effectively assess freshwater bodies considering their multiple uses, as they are deficient in evaluating aesthetic, recreational, and ecological conditions [3]. For this reason, integrated quality analyses considering the biological aspects of the system, in addition to the traditional valuation methodologies, are necessary [4].
Among the bioindicator organisms used to evaluate the environmental conditions of lotic systems, epilithic diatoms species are recognized as indicators of organic pollution and eutrophication and have been recommended by studies in many countries as particularly appropriate for evaluating water quality [5,6]. Furthermore, studies of these communities provide a continuous record of environmental quality, uncovering changes that originate from both natural processes and human actions [7].
Environmental monitoring studies [4,8–10], show that epilithic diatom communities in lotic ecosystems are directly affected by the interaction among variables that characterize organic pollution and eutrophication, two phenomena that cannot be well separated in nature [11,12]. Thus, diatoms are considered to be key organisms for assessing the ecological quality of watercourses and have been used for this purpose for more than a century in several European countries [13,14]. In Latin America, the use of this group of organisms in water quality assessment received little attention until the end of the 20th century. In Argentina, the Pampean Diatom Index [11] is based on studies by Frenguelli that date from 1947. In Brazil, Lobo et al. [15] published the first description of a Brazilian saprobic system, characterizing three differential diatom groups: highly pollution-tolerant species, pollution-tolerant species and less pollution-tolerant species. In Lobo et al. [12], a new trophic water quality index (TWQI) for subtropical and temperate Brazilian lotic systems was developed that assigned trophic values of 1, 2.5, and 4 to species, corresponding to levels of low, medium, and high tolerance to eutrophication, respectively.
In Ecuador, a country of approximately 15 million inhabitants, there are few operative wastewater treatment plants; therefore, organic matter content and nutrient enrichment occur in most of the rivers, particularly in urban areas. This is the case of the Pita River, an Andean stream in the metropolitan area of the city of Quito. Thus, we carried out an ecological assessment in this stream based on epilithic diatom communities and water quality variables. Previous studies have described a marked downstream increase in organic matter content and nutrient enrichment in the Pita River [16,17]. Therefore, a marked downstream increase in eutrophication is expected from the river headwaters to lower populated zones. In this context, we aimed to test the hypothesis that diatom communities undergo changes in species composition along a downstream gradient of increasing eutrophication and organic pollution. Sensitive species at upstream reaches will be gradually replaced by more tolerant species. This will be the initial step to create for the first time in Ecuador a trophic index based on epilithic diatoms.
2 Materials and methods
2.1 Study area
The Pita River basin is located in the southern part of Pichincha province, approximately 20 km south of Quito, capital of Ecuador (Fig. 1). The highest part is located on the slopes of the Cotopaxi volcano (5897 m a.s.l.), and the lowest occurs at the confluence of the Pita and San Pedro Rivers (2440 m a.s.l.) [17]. It has an elongated shape in the south–north direction, with an extension of 100,823 hectares.
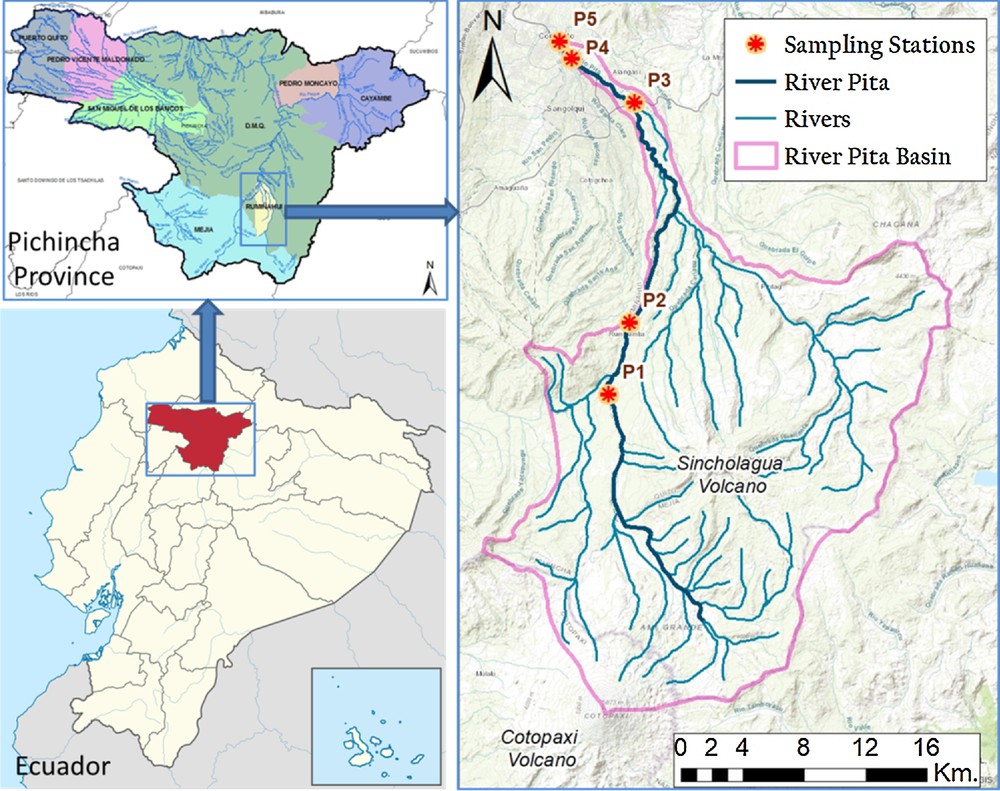
River Pita Basin (based on [16]). Image available on Google Maps: https://drive.google.com/file/d/1cAXdElH7KjdT8_tJ82_S_fk6fHLTPCa5/view?ts=5a8c82dc.
Altogether, five sampling stations were selected along the basin, and the following codes were given: stations P1 (GPS location: 785543; 9945002; 3,368 m a.s.l.) and P2 (GPS location: 786886; 9949659; 3,052 m a.s.l.) in the upper reaches, station P3 (GPS location; 787192; 9963951; 2558 m a.s.l.) in the intermediate lower reaches, and stations P4 (GPS location: 783151; 9966850; 2463 m a.s.l.) and P5 (GPS location: 782373; 9967924; 2,462 m a.s.l.) in the lower reaches (Fig. 1). Data were taken with a navigator GPS (WGS 84 UTM Zone 17 with 5 m of precision). The sampling design aimed to capture the variation among the different reaches of the hydrographical basin. All sampling stations were located in the municipality of Sangolquí. P1 and P2 are surrounded by paramo vegetation, meanwhile P3 is located in the pastures area P4 and P5 are located in farming and urban areas, respectively. Exhaustive information of the upper part of the Pita River basin could be found at Muñoz [18]. To visualize the stations on google maps a link is provided in Fig. 1.
2.2 Sampling and analysis of samples
Samples of epilithic diatoms and water from the Pita River were taken to evaluate the physical, chemical, and microbiological variables in August, October, and December 2016. The physical and chemical variables analyzed were water temperature, pH, turbidity, dissolved oxygen (DO) and conductivity, which were measured in the field with a HACH© Multiparameter analyzer, and biochemical oxygen demand (BOD), chemical oxygen demand (COD), ammonia nitrogen and phosphate, which were measured in the laboratory using the HACH method [19].
Epilithic diatoms were collected at the five sampling stations. The diatom samples were scrubbed off the upper surface of three stones that were 10 to 20 cm in diameter using a toothbrush and were fixed with formalin following the method described by Kobayasi and Mayama [20]. The samples were cleaned with sulfuric and hydrochloric acids and mounted on permanent slides with Pleurax® (Wako Pure Chemical Industries, Tokyo, Japan). To calculate the relative abundances of the species, all the organisms found along random transects across the prepared permanent slides were identified and counted, with a minimum of 600 valves, using a Leica DM750 light microscope. The species with a number of individuals above the mean (number of species divided by the total number of individuals) were considered abundant species, following the criterion proposed by Lobo and Leighton [21]. For species identification, the following taxonomic references were used: Lobo et al. [22,43], Metzelin and García-Rodríguez [23], Metzelin and Lange-Bertalot [24], Metzelin et al. [44] and Rumrich and Lange-Bertalot [25]. The permanent slides are stored in the Herbarium at the Department of Limnology, International University SEK, Quito, Ecuador.
2.3 Data analysis
For environmental analysis, the evaluation of water quality was conducted using the water quality index (WQI) adapted for south Brazilian lotic systems by Moretto et al. [26]. To calculate the WQI, the software IQAData was used [27]. The environmental variables considered were DO, BOD, COD, NH3, pH, PO4, temperature, and turbidity. This WQI considers 0–25 as very bad water quality, 26–50 as bad water quality, 51–70 as moderate water quality, 71–90 as good water quality, and 91–100 as excellent water quality. Significant differences among the environmental variables were identified using the Friedman nonparametric test with Dunn post-test for multiple comparisons utilizing the statistical program Graph Pad Prism 5.01. A principal component analysis (PCA) was applied to find hypothetical variables (components) accounting for as much as possible of the variance in the multivariate data. This technique is widely used to emphasize variation and captures strong patterns in a dataset, in our case, particularly those patterns related to the processes of organic pollution, and eutrophication. The analyses were performed using PAST software [28]. The data were transformed using ln(x + 1). For the biological data, a multivariate analysis was performed to cluster the relative abundances of epilithic diatoms at the sampling stations based on the Ward method [29]. The analyses were performed using PAST software [28].
3 Results and discussion
The summarized descriptive statistics of the physical and chemical dataset are presented in Table 1. The variables phosphate, nitrogen, biochemical oxygen demand and chemical oxygen demand showed evident increasing concentrations from the sampling sites located in the upper reaches to those located in the lower reaches (p < 0.05), indicating a gradient of eutrophication, particularly between sampling sites P1 and P5, for phosphate, and sampling sites P2 and P5 for the others.
Summary basic statistics (average ± standard deviation) of the physical and chemical dataset in five sampling stations (P1–P5), Pita River, Quito, Ecuador. Monthly collection in August, October, and December 2016.
| Variable | P1 | P2 | P3 | P4 | P5 |
| pH | 8.3 ± 1.1 | 8.4 ± 0.5 | 8.9 ± 0.7 | 9.1 ± 0.8 | 8.5 ± 0.3 |
| T (C) | 9.1 ± 2.0 | 12.5 ± 0.8 | 17.4 ± 0.5 | 20.2 ± 1.2 | 20.3 ± 1.1 |
| Con (μS·cm−1) | 198.3 ± 3.5 | 217.9 ± 4.9 | 276.3 ± 5.7 | 312.3 ± 7.6 | 562.7 ± 4.6 |
| DO (mg·L−1) | 8.1 ± 04 | 7.3 ± 0.1 | 6.6 ± 0.2 | 5.6 ± 0.5 | 4.9 ±0.3 |
| Pho (mg·L−1) | 0.18 ± 0.15 | 0.33 ± 0.31 | 0.39 ± 0.34 | 8.07 ± 12.11 | 8.64 ± 11.77 |
| Nit (mg·L−1) | 0.07 ± 0.03 | 0.03 ± 0.05 | 0.25 ± 0.22 | 0.59 ± 0.17 | 2.39 ± 0.28 |
| Tur (uT) | 5.0 ± 4.5 | 0.7 ± 1.2 | 25.8 ± 39.2 | 13.4 ± 3.6 | 14.4 ± 4.7 |
| BOD (mg·L−1) | 2.6 ± 1.2 | 2.2 ± 0.7 | 5.4 ± 4.4 | 7.6 ± 3.0 | 9.0 ± 4.8 |
| COD (mg·L−1) | 6.2 ± 2.6 | 5.0 ± 1.5 | 14.0 ± 8.0 | 16.4 ± 8.0 | 20.4 ± 12.2 |
The pH did not show significant differences (p > 0.05) among any of the sampling sites, differing from water temperature, which showed significant differences (p < 0.05) between sampling site P1, located on the slopes of the Cotopaxi volcano (5897 m a.s.l.), and sampling sites P4 and P5, located in the lower reaches (2440 m a.s.l.), with higher water temperatures.
In terms of electrical conductivity, the results showed significant differences (p < 0.05) between the sampling sites located in the upper reaches (P1) and those located in the lower reaches, particularly P5. In this case, values higher than 250.0 μS·cm−1 are connected with mesotrophic to eutrophic water conditions (moderate to excessive pollution), according to Lobo and Kobayasi [30]. In short, the physical and chemical datasets clearly demonstrate a significant gradient of eutrophication from the headwaters to downstream.
In general, the results obtained by applying the water quality index (WQI) developed by Moretto et al. [26] indicated that the water pollution levels ranged from 32.4 to 91.2. As shown in Fig. 2, a clear gradient in water quality was observed, from P1 and P2, classified as “good water” sampling sites [77.7 ± 9.8, coefficient of variation (CV) = 12.6%], P3 classified as having “moderate” water quality (63.0 ± 12.2, CV = 19.4%), and P4 and P5, classified as “bad water” sampling sites (40.9 ± 8.3, CV = 20.3%). This gradient coincides with the locations of the sampling sites in the basin: P1 and P2 in the upper reaches, P3 in the intermediate reaches and P4 and P5 in the lower reaches.
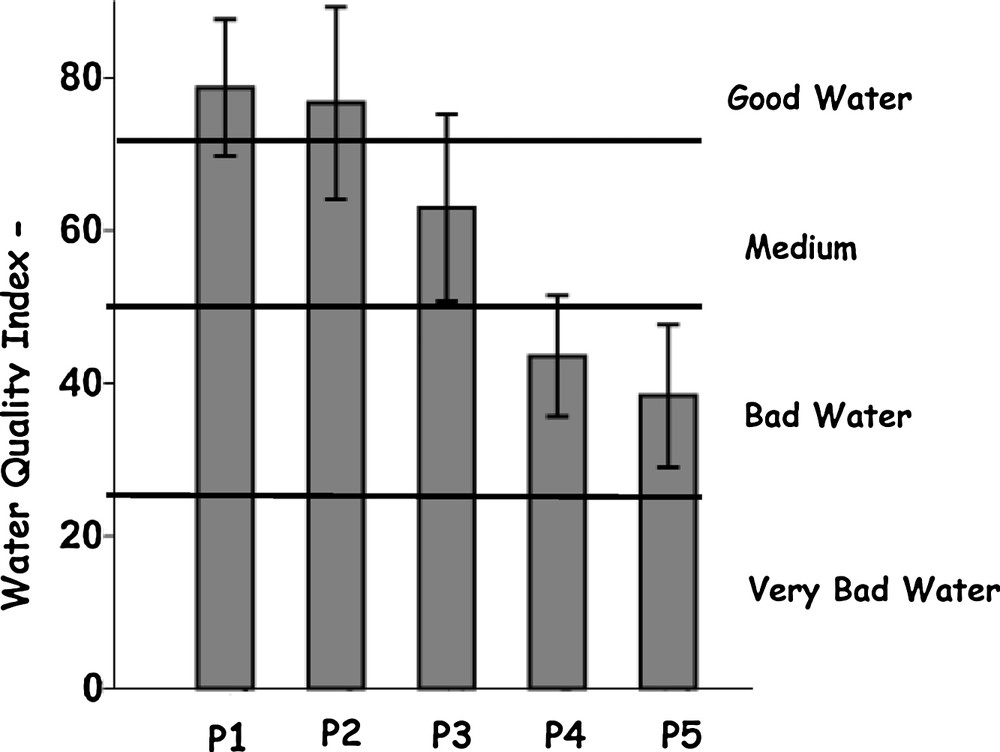
Water Quality Index–WQI (average ± standard deviation) in sampling sites P1, P2, P3, P4 and P5 in Pita River, Quito, Ecuador, collected in August, October, and December 2016. The limit WQI values allowing one to differentiate the Water Quality classes are shown [26].
A principal component analysis (PCA) was employed to compare the compositional patterns between the examined physical and chemical datasets for the five sampling sites (P1–P5) in the Pita River and to identify the factors that influence each one. The first three components show a percentage of accumulated variance equal to 97.9% (Table 2); however, component 1 was the only significant component considering that the eigenvalues (Table 2) show that this component is the only one located above the inflection point in the eigenvalue curve and is consequently significant. The broken-stick test also indicates that PC1 was the only significant component, accounting for 72.6% of the total variance in the dataset [31].
PCA summary. Eigenvalues and percentages of explained variability for abiotic data in five sampling stations (P1–P5), Pita River, Quito, Ecuador. Monthly collection in August, October, and December 2016.
| Eigenvalues | % total of variance | Cumulated eigenvalue | % cumulated | |
| Component 1 | 6.53542 | 72.6 | 6.53542 | 72.6 |
| Component 2 | 1.74325 | 19.4 | 8.27867 | 92.3 |
| Component 3 | 0.503425 | 5.6 | 8.782095 | 97.9 |
Table 3 summarizes the PCA results for the first three PCs, including the eigenvectors of the correlation matrix. Considering that the physical and chemical variables were measured using different units, the correlation (normalized variance–covariance matrix) was used. Fig. 3 shows the bivariate plot of the scores of PCs 1 and 2 according to eight abiotic variables at the five sampling stations (P1–P5) in the Pita River.
PCA summary. Eigenvectors for abiotic data in five sampling stations (P1–P5), Pita River, Quito, Ecuador. Monthly collection in August, October, and December 2016.
| Variable | PC 1 | PC 2 | PC 3 |
| pH | 0.451 | 0.860 | −0.226 |
| T (C) | 0.908 | 0.263 | −0.125 |
| Con (μS·cm−1) | 0.937 | −0.288 | 0.134 |
| DO (mg·L−1) | −0.771 | 0.628 | 0.060 |
| Pho (mg·L−1) | 0.932 | −0.094 | −0.272 |
| Nit (mg·L−1) | 0.903 | −0.402 | 0.154 |
| Tur (uT) | 0.667 | −0.494 | 0.554 |
| COD (mg·L−1) | 0.970 | 0.202 | −0.018 |
| BOD (mg·L−1) | 0.983 | 0.053 | −0.104 |
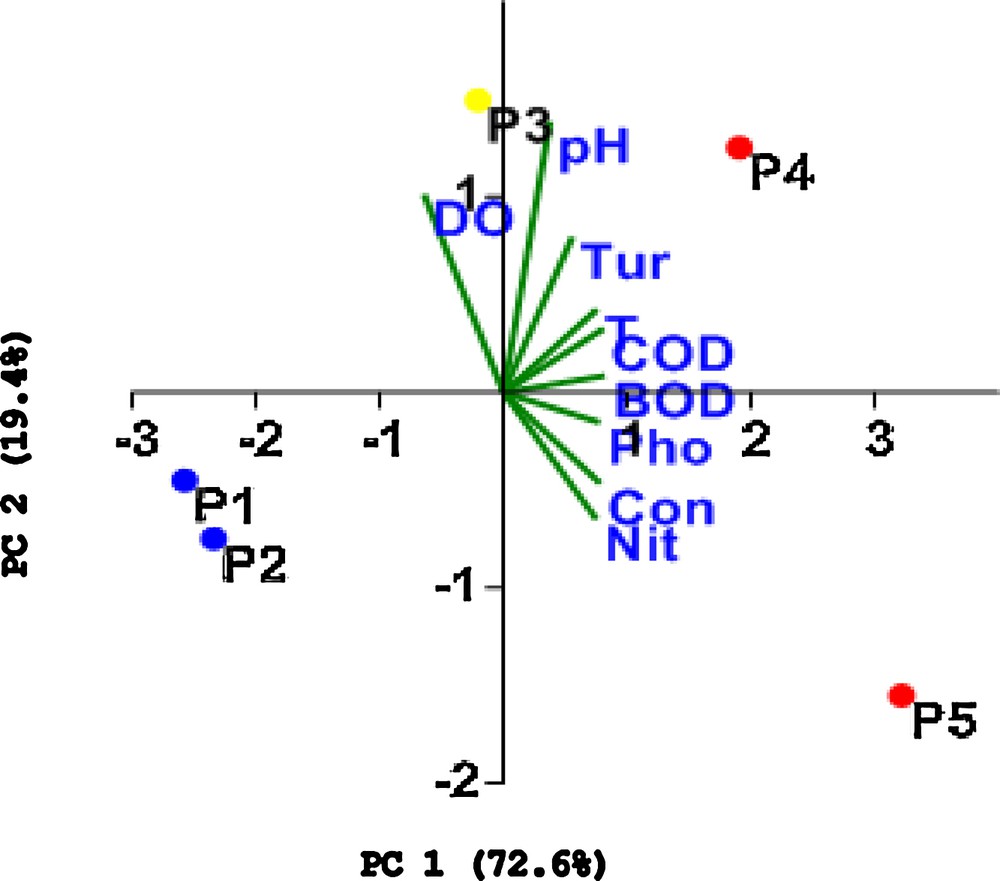
Bivariate plot of the scores of PCs 1 and 2 according to eight abiotic variables in five sampling stations (P1–P5), Pita River, Quito, Ecuador. Monthly collection in August, October, and December 2016. (T: Temperature; Con: Electrical conductivity; DO: Dissolved Oxygen; Pho: Phosphate; Nit: Nitrogen; Tur: Turbidity; COD: Chemical Oxygen Demand; BOD: Biochemical Oxygen Demand).
According to Table 3 and Fig. 3, the first PC was negatively correlated with DO (r = –0.77), characterizing the sampling sites P1 and P2; these values increase with a decrease in PC1. In contrast, we can observe strong and positive correlations, > 0.9, for BOD, COD, electrical conductivity, and phosphate, characterizing the sampling sites P4 and P5. Sampling site P3 is located in the middle position along the axis representing this factor.
As Janzekovic and Novak [32] noted, the stronger the correlation between a variable and a factor, the greater the correlation between the corresponding variable and the factor axes. The variables that are correlated with a particular factor can thus be identified, thereby providing information regarding which variables can explain the given factor. In this context, these results show that PC1 clearly corresponds to a gradient of eutrophication from clean sites located in the negative quadrant, characterized by waters with high concentrations of dissolved oxygen and represented by sampling sites P1 and P2, to bad sites located in the positive quadrant, characterized by waters with high BOD, COD, phosphate concentrations and electrical conductivity and represented by sampling sites P4 and P5. These results coincide with the eutrophication gradient obtained based on the basic statistical analysis of the physical and chemical datasets shown in Table 1, as well as with the WQI, with P1 and P2 being classified as “good water” sampling sites and located in the upper reaches of the basin, P3 being classified as having “moderate” water quality and located in the intermediate reaches, and P4 and P5 being classified as “bad water” sampling sites and located in the lower reaches.
The gradient of eutrophication detected in the Pita River basin can be explained by considering the anthropogenic pollution activities (agriculture and sewage water) that occur in the areas surrounding the sampling sites, from the upper reaches corresponding to sites P1 and P2, located on the slopes of the Cotopaxi volcano (5897 m a.s.l.), with minimal anthropogenic interferences, to the lower reaches corresponding to sites P4 and P5, located at the confluence of the Pita and San Pedro Rivers (2440 m a.s.l.) [17], with strong influences from point sources such as municipal and industrial effluents as well as nonpoint sources such as agricultural runoff. Another factor causing contamination is fishermen, who use dynamite or a poisonous plant called barbasco to catch trout [33].
In relation to the biological analysis, 67 diatom species were identified belonging to 29 genera. Twenty-seven taxa were considered abundant species (Table 4). Regarding the generic level, Gomphonema Ehrenberg and Navicula Bory were the most representative, with nine (13.4%) and seven (10.4%) species, respectively.
Species identified in sampling sites P1–P5 of Pita River, Quito, Ecuador, collected in August, October, and December 2016, highlighting in bold the 27 abundant species determined following the criterion of Lobo and Leighton [21]. tv: trophic value given after Lobo et al. [12]. tv+: trophic values for abundant species registered in the software OMNIDIA [37].
| Species | tv | P1 | P2 | P3 | P4 | P5 |
| Achnantes minuscula Hustedt | a | 7 | 3 | 0 | 0 | 0 |
| Amphora meridionalis Levkov | a | 0 | 0 | 17 | 1 | 6 |
| Cocconeis lineata Ehrenberg | 2.5 | 38 | 58 | 140 | 10 | 19 |
| Cocconeis pseudothumensis Reichardt | a | 1 | 0 | 1 | 0 | 0 |
| Cyclotella meneghiniana Kützing | 4 | 0 | 8 | 17 | 87 | 32 |
| Cyclotella atomus Hustedt | 4 | 0 | 9 | 0 | 0 | 0 |
| Cymbella tumida (Brébisson) Van Heurck | a | 0 | 1 | 3 | 1 | 0 |
| Diatoma moniliformis(Kützing) D.M. Willams | 2.5–4+ | 0 | 1 | 38 | 2 | 2 |
| Diatoma mesodon (Ehrenberg) Kützing | a | 1 | 1 | 0 | 0 | 0 |
| Encyonema silesiacum(Bleisch) D.G. Mann | 4+ | 37 | 10 | 0 | 3 | 0 |
| Encyonema chilense Krammer | a | 0 | 6 | 0 | 0 | 0 |
| Encyonema silesiacum var. altensis Krammer | a | 21 | 24 | 1 | 1 | 4 |
| Encyonema minutum(Hilse) D.G. Mann | 2.5+ | 108 | 31 | 37 | 7 | 12 |
| Encyonema leibleinii (Agardh) Silva et al. | a | 0 | 1 | 0 | 0 | 0 |
| Encyonema lange-bertalotii Krammer | a | 7 | 5 | 0 | 0 | 0 |
| Eolimna sp. | a | 0 | 0 | 2 | 0 | 32 |
| Eolimna cf. minima (Grunow) Lange-Bertalot | 2.5+ | 0 | 1 | 0 | 9 | 43 |
| Eolimna subminuscula (Manguin) Gerd Moser, Lange-Bertalot et Metzelin | 4+ | 0 | 0 | 0 | 1 | 32 |
| Eunotia monodon Ehrenberg | a | 0 | 0 | 0 | 0 | 4 |
| Epithemia turgida (Ehrenberg) Kützing | a | 0 | 2 | 0 | 0 | 0 |
| Epithemia sorex Kützing | a | 0 | 0 | 0 | 0 | 1 |
| Fragilaria arcus (Ehrenberg) Cleve | 1–2.5+ | 121 | 25 | 27 | 1 | 1 |
| Fragilaria socia (Wallace) Lange-Bertalot | a | 4 | 1 | 18 | 1 | 0 |
| Fragilaria vaucheriae (Kützing) Petersen | a | 8 | 9 | 2 | 0 | 0 |
| Fragilaria recapitellata Lange-Bertalot & Metzelin | a | 2 | 4 | 0 | 0 | 0 |
| Fragilaria tenera (W. Smith) Lange-Bertalot | a | 1 | 0 | 0 | 0 | 0 |
| Gomphonema aquaemineralis Lange-Bertalot & Reichardt | a | 12 | 6 | 7 | 0 | 0 |
| Gomphonema lagenula Kützing | 2.5–4+ | 0 | 60 | 0 | 31 | 40 |
| Gomphonema minutum (C. Agardh) C. Agardh | a | 0 | 0 | 7 | 0 | 0 |
| Gomphonema pumilumvar. rigidumE. Reichardt & Lange-Bertalot | NC | 0 | 0 | 107 | 2 | 5 |
| Gomphonema turgidum Ehrenberg | a | 1 | 1 | 11 | 5 | 0 |
| Gomphonema cf. parvulum Kützing | 2.5 | 13 | 0 | 44 | 65 | 71 |
| Gomphonema mehleri K.E. Camburn | a | 0 | 0 | 1 | 0 | 0 |
| Gomphonema insignaffine E. Reichardt | a | 0 | 0 | 0 | 0 | 5 |
| Gomphonema truncatum Ehrenberg | a | 0 | 1 | 0 | 0 | 0 |
| Karayevia oblongella (Oestrup) M. Aboal | a | 0 | 0 | 0 | 0 | 5 |
| Luticola goeppertiana(Bleisch) D.G. Mann | 4 | 0 | 76 | 1 | 219 | 42 |
| Melosira variansC. Agardh | 2.5 | 99 | 125 | 86 | 15 | 29 |
| Meridion constrictum Ralfs | a | 1 | 0 | 0 | 0 | 0 |
| Navicula lanceolata(C. Agardh) Kützing | 2.5–4+ | 129 | 169 | 24 | 7 | 35 |
| Navicula cf. gregaria Donkin | 4 | 4 | 20 | 16 | 3 | 17 |
| Navicula cryptotenella Lange-Bertalot | 2.5+ | 0 | 7 | 5 | 22 | 40 |
| Navicula tripunctata(O.F. Müller) Bory | 4+ | 6 | 55 | 47 | 4 | 8 |
| Navicula eidrigiana Carter | a | 0 | 0 | 0 | 7 | 13 |
| Navicula cascadensis Sovereign | a | 0 | 0 | 0 | 1 | 8 |
| Navicula riediana Lange-Bertalot & Rumrich | NC | 41 | 13 | 39 | 5 | 0 |
| Nitzschia umbonata (Ehrenberg) Lange-Bertalot | 4+ | 0 | 36 | 0 | 8 | 18 |
| Nitzschia inconspicua Grunow | 1 | 110 | 50 | 47 | 133 | 30 |
| Nitzschia amphibia Grunow | 2.5 | 0 | 8 | 3 | 70 | 53 |
| Nitzschia palea(Kützing) W. Smith | 4 | 12 | 6 | 10 | 118 | 176 |
| Nitzschia linearis (C. Agardh) W. Smith | 4 | 0 | 14 | 13 | 5 | 15 |
| Pinnularia microstauron (Ehrenberg) Cleve | a | 0 | 0 | 0 | 3 | 2 |
| Pinnularia parvulissima Krammer | a | 1 | 4 | 0 | 0 | 5 |
| Pinnularia marchica Schönfelder | a | 0 | 0 | 0 | 1 | 6 |
| Planothidium cf. frequentissimun Lange-Bertalot | a | 24 | 19 | 13 | 2 | 15 |
| Planothidium cf. lanceolatum (Brébisson ex Kützing) Lange-Bertalot | a | 0 | 0 | 0 | 1 | 8 |
| Planothidium cf. biporomun (Hohn and Hellerman) Lange-Bertalot | a | 1 | 4 | 11 | 1 | 0 |
| Reimeria sinuata var. sinuata (Gregory) Kociolek & Stoermer | a | 13 | 9 | 1 | 1 | 0 |
| Rhoicosphenia abbreviata (C. Agardh) Lange-Bertalot | 4+ | 20 | 13 | 35 | 1 | 0 |
| Rhopalodia gibberula (Ehrenberg) Otto Müller | a | 0 | 0 | 1 | 0 | 1 |
| Sellaphora pupula (Kützing) Mereschkowsky | 2.5–4+ | 0 | 0 | 4 | 1 | 23 |
| Surirella angusta Kützing | a | 0 | 0 | 0 | 1 | 0 |
| Surirella ovalis Brébisson | a | 1 | 0 | 4 | 0 | 1 |
| Staurosira brevistriata (Grunow) Grunow | 2.5–4+ | 43 | 7 | 12 | 45 | 22 |
| Staurosirella pinnata (Ehrenberg) Williams and Round | a | 3 | 0 | 0 | 0 | 2 |
| Tabellaria flocculosa (Roth) Kützing | a | 2 | 1 | 0 | 0 | 0 |
| Ulnaria ulna (Nitzsch) Compére | 1 | 20 | 9 | 4 | 11 | 10 |
a No trophic value found.
Our results indicated a high diversity for tropical areas in terms of species richness, with a gradual increase from the headwaters to downstream, being on average S = 38.3 ± 4.5 (n = 3, CV = 11.8%) at P1, P2 and P3, to S = 41.5 (n = 2) at P4 and P5. Lobo et al. [34] found that species richness tends to be highest at intermediate pollution levels in subtropical areas, with an average value S = 28 ± 10.6 (CV = 37.9%). According to the same authors, this species richness distribution pattern is consistent with the intermediate disturbance hypothesis [35], and indicates that highest diversity is maintained under intermediate pollution-induced disturbance.
The grouping of the sampling sites was conducted using cluster analysis based on the relative abundance data of diatoms species, as shown in Fig. 4. The formation of two major groups was observed: a group containing the sampling sites P1, P2, and P3 (good and moderate water quality) and a second group composed of sampling sites with bad water quality (P4 and P5). These results clearly demonstrate the separation of the sampling stations that were more impacted corresponding to the lower reaches of the Pita River basin, from the sampling stations that were less impacted, corresponding to the intermediate reaches and upper reaches.
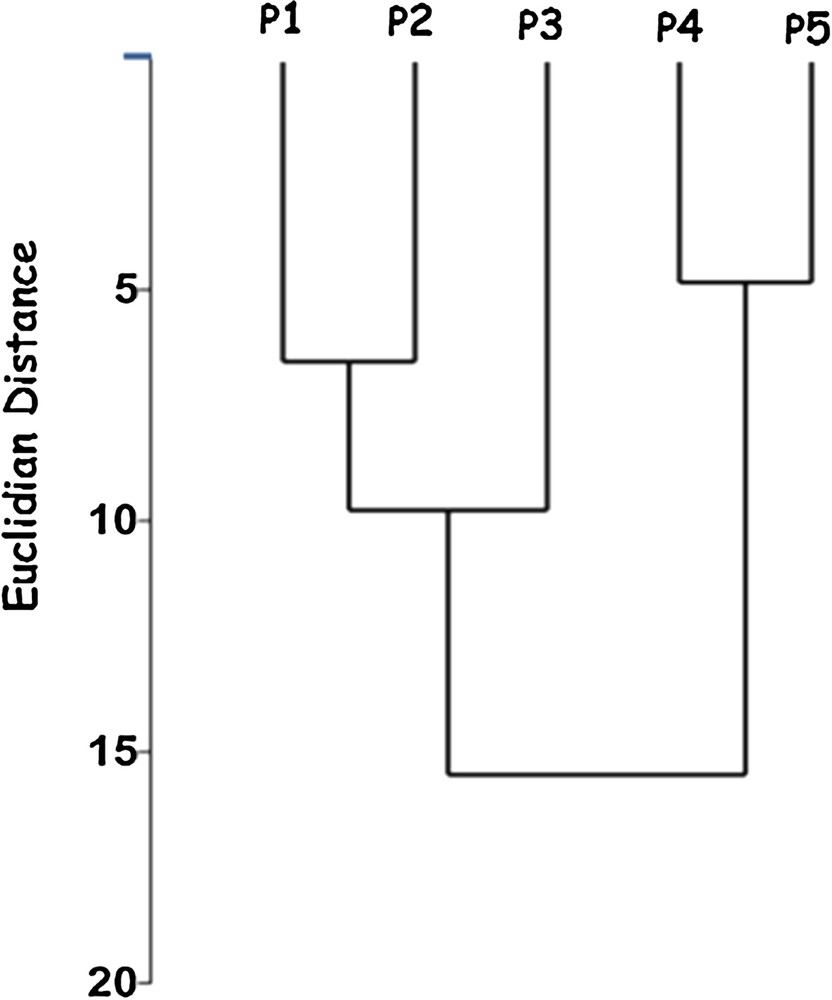
Cluster analysis (Ward's method) based on biological diatom data (abundant species) from the five sampling stations (P1–P5), in Pita River, Quito, Ecuador, in August, October, and December 2016.
The species Encyonema silesiacum var. altense and Nitzschia umbonata were abundant exclusively at good water quality sites (P1 and/or P2). Diatoma moniliformis, Gomphonema pumilum var. rigidum and Rhoicosphenia abbreviata were abundant exclusively in water of intermediate quality (P3), and Cocconeis lineata, Encyonema minutum and Fragilaria arcus were abundant exclusively at P1, P2 and P3. Of these species, only C. lineata, E. minutum, and E. silesiacum have been classified according to the level of pollution, having a trophic value (vt) = 2.5, corresponding to species with intermediate tolerance to eutrophication based on the classification proposed by [5,12,22] for subtropical and temperate Brazilian lotic systems. The degree of tolerance ascribed to these species in subtropical and temperate ecosystems did not fit well with their exclusive occurrence in tropical ecosystems of good/intermediate water quality. Furthermore, E. minutum has been described as a polluted water bioindicator, while R. abbreviata and D. moniliformis have been described as clean water bioindicators according to the nutrient sensitivity score defined by the UK trophic diatom index [36].
F. arcus has been classified as having a trophic value (vt) from 1 to 2.5, corresponding to species with low to intermediate tolerance to eutrophication according to OMNIDIA [37]. Instead, according to the same author, N. umbonata is classified as having a trophic value (vt) = 4, corresponding to species with high tolerance to eutrophication. No information about the degree of tolerance to pollution was found for Gomphonema pumilum var. rigidum.
On the other hand, the species Cyclotella meneghiniana, Eolimna cf. minima, Navicula cryptotenella, Nitzschia amphibia, N. palea and Sellaphora pupula were abundant exclusively at sampling sites with bad water quality (P4 and/or P5). Of these species, C. meneghiniana and N. palea have been classified as having a trophic value (vt) = 4, corresponding to species with a high tolerance to eutrophication based on the classification proposed by [5,12,22]. These species, including S. pupula, are globally recognized as tolerant to eutrophication (e.g., [38–42]). According to OMNIDIA [37], S. pupula has been also classified as having a trophic value (vt) from 2.5 to 4, corresponding to species with intermediate to high tolerance to eutrophication. Species of intermediate tolerance to eutrophication [trophic value (vt) = 2.5] were also found in the lower reaches of the Pita River, such as E. cf. minima, N. amphibia and N. cryptotenella [5,12,22]. Again, the degree of tolerance ascribed to these species in subtropical and temperate ecosystems did not fit well with their exclusive occurrence in tropical ecosystems with bad water quality.
As expected, in the Pita River there is a marked downstream increase in eutrophication from the river headwaters (sampling sites P1 and P2) to the higher populated zones (sampling sites P4 and P5), as clearly demonstrated based on the basic statistical analysis of the physical and chemical datasets, the water quality index (WQI) and the principal component analysis (PCA). We tested the hypothesis that diatom communities undergo changes in species composition along a downstream gradient of increasing eutrophication, with sensitive species prevailing in upstream reaches and their gradual downstream replacement by species that are more tolerant. Nevertheless, it was not possible to prove this hypothesis, as the tolerance to different degrees of pollution/eutrophication of Ecuadorian tropical diatoms species is not well documented. Additionally, the tolerance of pollution/eutrophication determined for some species in subtropical and temperate ecosystems based on the classification proposed by Lobo et al. [5,12,22] did not fit well with the occurrence of some diatom species in Ecuadorian tropical lotic ecosystems. We concluded that the trophic values of diatom species available in the scientific literature are not always suitable to diagnose the Pita River's water quality. Hence, it is necessary to determine the tolerance to eutrophication of diatom species of tropical ecosystems to develop a trophic diatom index for the Andean region of Ecuador.
Acknowledgements
The authors are thankful to the “Ministerio del Ambiente”, Ecuador, for collection permission (JCN) No. MAE-DNB-CM 2015-0028-M001.