

1 Introduction
The HIV-1 nucleocapsid protein (NC) is a small basic protein characterized by two zinc fingers that preferentially binds single-stranded nucleic acids. Due to its chaperone activities, NC facilitates the rearrangement of nucleic acids into their most stable conformation, thus promoting nucleic acids hybridization and strand exchange [1,2]. As a consequence, NC is thought to chaperone several key steps such as the two obligatory strand transfers during reverse transcription. During the first strand transfer, NC has been shown to destabilize the secondary and tertiary structures of the transactivation response element TAR RNA and the complementary cTAR DNA sequence of the genomic RNA template and
NC also stimulates the second strand transfer reaction [10,19–21] by removing the tRNALys,3 primer from the
To gain further information on nucleic acid/protein interactions, fluorescence correlation spectroscopy (FCS) has been shown to be useful [22–26]. This method analyses the fluctuations of fluorescence intensity in the very small volume obtained either with a confocal microscope or two-photon excitation. Analysis of these fluctuations through an autocorrelation function provides information on the phenomena that generate these fluctuations and the average number of fluorescent molecules in the excited volume. In the simplest and most common case, fluorescence fluctuations mainly occur from diffusion inside and outside the excited volume and from triplet blinking (conversion between the fluorescent singlet state and the non-fluorescent triplet state). If additional chemical or physical mechanisms induce transitions between states of different brightness during the diffusion time, information on the dynamics of these mechanisms could be additionally derived from the autocorrelation curves. This has notably been used for characterizing the dynamics of DNA hairpin-loop fluctuations [6,27–30] as well as RNA structural transitions [31].
In this context, to further illustrate the potency of FCS for getting information on protein/nucleic acid interactions, we will review and extend herein our recent work on the chaperone properties of NC on
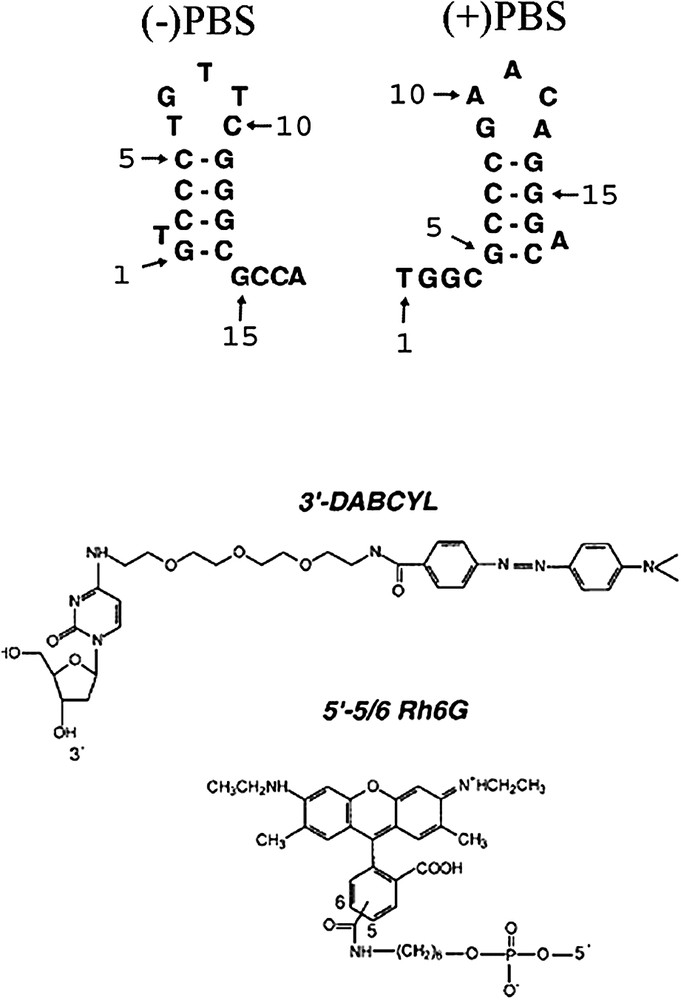
Structures of PBS derivatives and dyes used in this study. The selected (+)PBS sequence is the cDNA copy of the PBS RNA sequence from the MAL strain.
2 Materials and methods
2.1 Materials
NC(12–55) peptide was synthesized as previously described [33] and stored lyophilized in its zinc-bound form. Its purity was greater than 98%. An extinction coefficient of 5700 M−1 cm−1 at 280 nm was used to determine its concentration.
Doubly and singly labelled DNA oligonucleotides were synthesized at a 0.2-μmol scale by IBA GmbH Nucleic Acids Product Supply (Göttingen, Germany). The
2.2 UV-visible absorption and fluorescence spectroscopy
Absorption spectra were recorded on a Cary 400 spectrophotometer. Fluorescence emission spectra were recorded on a FluoroMax spectrofluorometer (Jobin-Yvon) equipped with a thermostated cell compartment. Time-resolved fluorescence measurements were performed with a time-correlated single photon counting technique, as previously described [17]. The excitation and emission wavelengths were set at 480 and 550 nm, respectively. Time-resolved data analysis was performed by the maximum-entropy method using the Pulse5 software [34]. The mean lifetime
| (1) |
2.3 FCS setup and data analysis
FCS measurements were performed on a two-photon platform including an Olympus IX70 inverted microscope, as described [6,35]. Two-photon excitation at 850 nm is provided by a mode-locked Tsunami Ti:sapphire laser pumped by a Millenia V solid-state laser (Spectra Physics). The measurements were carried out in an eight-well Lab-Tek II coverglass system, using a 400-μl volume per well. The focal spot is set about 20 μm above the coverslip. The normalized autocorrelation function,
The analysis of
| (2) |
3 Results and discussion
3.1 Evidence and kinetics of PBS fraying
Since NC has been shown to activate the kinetics of cTAR DNA fraying, our first objective was to investigate whether, by analogy to cTAR DNA, both
Time-resolved fluorescence studies indicated that both doubly labelled
| (3) |
Time-resolved fluorescence parameters of singly and doubly labelled (−)PBS and (+)PBS sequencesa
| r a |
|
|
|
|
|
|
|
|
|
|
|
|
| Rh6G- |
− | − | − | − | 0.39 | 53 | 2.15 | 10 | 4.27 | 37 | 2.00 | − |
| Rh6G- |
− | 76 | 0.12 | 15 | 0.44 | 6 | 1.57 | 2 | 3.79 | 1 | 0.41 | 20.0 |
| Rh6G- |
5 | 82 | 0.13 | 7 | 0.50 | 6 | 1.73 | 3 | 3.62 | 2 | 0.89 | 12.4 |
| Rh6G- |
− | − | − | − | 0.21 | 59 | 0.79 | 29 | 3.96 | 12 | 0.83 | − |
| Rh6G- |
− | 69 | 0.10 | 25 | 0.70 | 5 | − | − | 2.83 | 1 | 0.31 | 8.7 |
| Rh6G- |
5 | 78 | 0.15 | 10 | 0.97 | 8 | − | − | 2.82 | 4 | 0.96 | 4.0 |
a
The oligonucleotide concentration was 0.5 μM. r designates the ratio of nucleotides to NC(12–55) peptide. The relative amplitude,
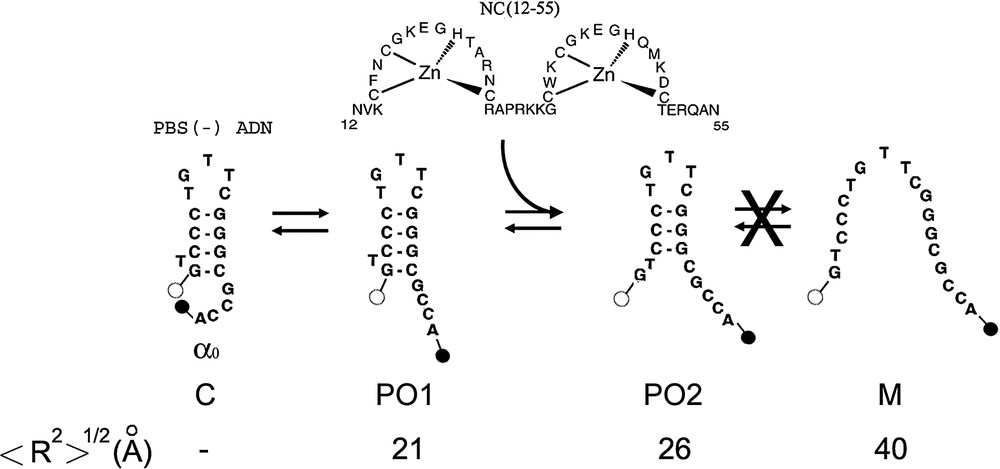
Proposed scheme of (−)PBS fraying. This scheme is established on the basis of the time-resolved data in Table 1. The dark closed form C is associated with the
Proposed scheme of (−)PBS fraying. This scheme is established on the basis of the time-resolved data in Table 1. The dark closed form C is associated with the
To get further information on the dynamics of PBS fraying, FCS with two photon excitation was performed. For singly labelled PBS derivatives, fluorescence fluctuations are thought to mainly occur from diffusion in and out the excited volume and from triplet blinking (conversion between the fluorescent singlet state and the non-fluorescent triplet state). In line with this assumption, the autocorrelation curves of both Rh6G-
| (4) |
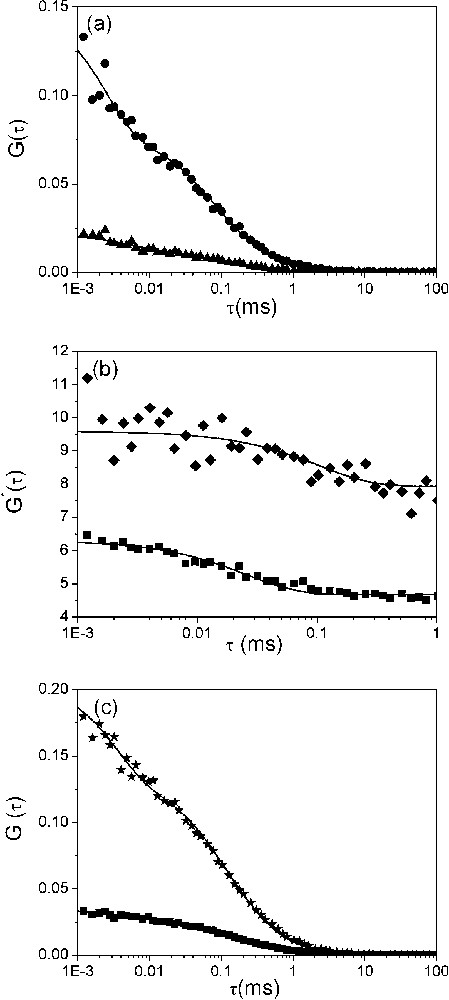
Dynamics of the fraying of (−)PBS sequences. (a) Autocorrelation curves of singly (▴) and doubly labelled (●) (−)PBS sequences at a 0.5 μM concentration. Solid lines correspond to fits of the experimental points with Eq. (2). The triplet lifetime,
Dynamics of the fraying of (−)PBS sequences. (a) Autocorrelation curves of singly (▴) and doubly labelled (●) (−)PBS sequences at a 0.5 μM concentration. Solid lines correspond to fits of the experimental points with Eq. (2). The triplet lifetime, ... Lire la suite
FCS parameters of the interaction of NC(12–55) with PBS derivativesa
| r |
|
|
|
|
| (−)PBS | − | 9.9±0.3 | 1.5–8.1b | 0.5±0.1 |
| 5 | 7.4±0.4 | 1.4–7.2b | ||
| (+)PBS | − | 8.3±0.5 | 1.5–8.1b | 0.6±0.1 |
| 5 | 7.7±0.3 | 1.4–7.2b | ||
| T7(−)PBS | − | 10.0±0.7 | 1.5–8.1b | 0.9±0.1 |
| 5 | 7.7±0.2 | 6.1–10.6c | ||
| ΔL(−)PBS | − | 9.4±0.2 | 1.5–8.1b | 0.8±0.1 |
| 5 | 8.5±0.6 | 6.1–10.6c |
a
The experimental diffusion coefficient,
b
c
Fitting the autocorrelation function of the doubly labelled
| (5) |
Effect of NC(12–55) on the kinetics of (−)PBS fraying, as determined by FCS
| r |
|
|
|
|
| − | 110 ± 5 | 2300 ± 100 | 7000 ± 200 | 0.32 |
| 5 | 25 ± 1 | 7300 ± 400 | 33 000 ± 2000 | 0.22 |
3.2 NC destabilizes PBS secondary structure and promotes its dimerisation
To investigate NC destabilizing effect on PBS derivatives, we used the NC(12–55) derivative, which contains the zinc-finger motifs but, in contrast to the native NC(1–55) protein, does not aggregate the oligonucleotides [43]. Since
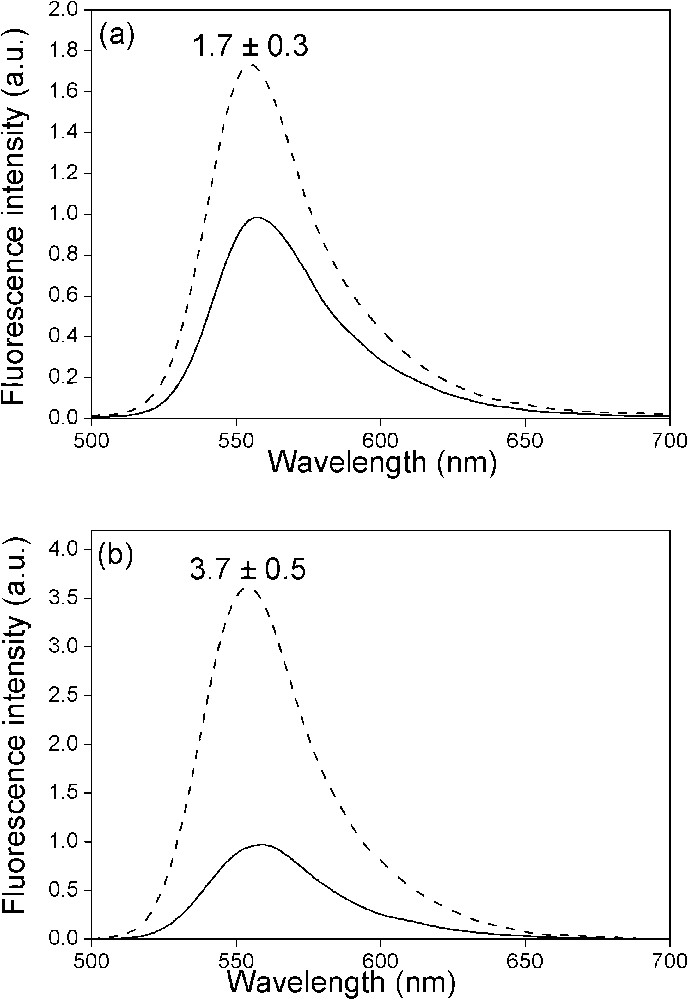
Effect of NC(12–55) on the fluorescence spectra of the doubly labelled PBS derivatives. The spectra of (−)PBS (a) or (+)PBS (b) were recorded at a 0.5 μM concentration either in the absence (solid) or in the presence (dotted) of NC(12–55) added at a ratio of five nucleotides per peptide. Excitation wavelength was 480 nm. The NC-induced fluorescence increase is indicated as mean ± standard error of the mean for three independent experiments.
These differences between cTAR and PBS cannot be related to the oligonucleotide stabilities since the
NC(12–55) was found to strongly modify the autocorrelation curves of both singly- and doubly labelled
The second striking feature observed by FCS is the decrease by a factor of two of the average number of singly labelled
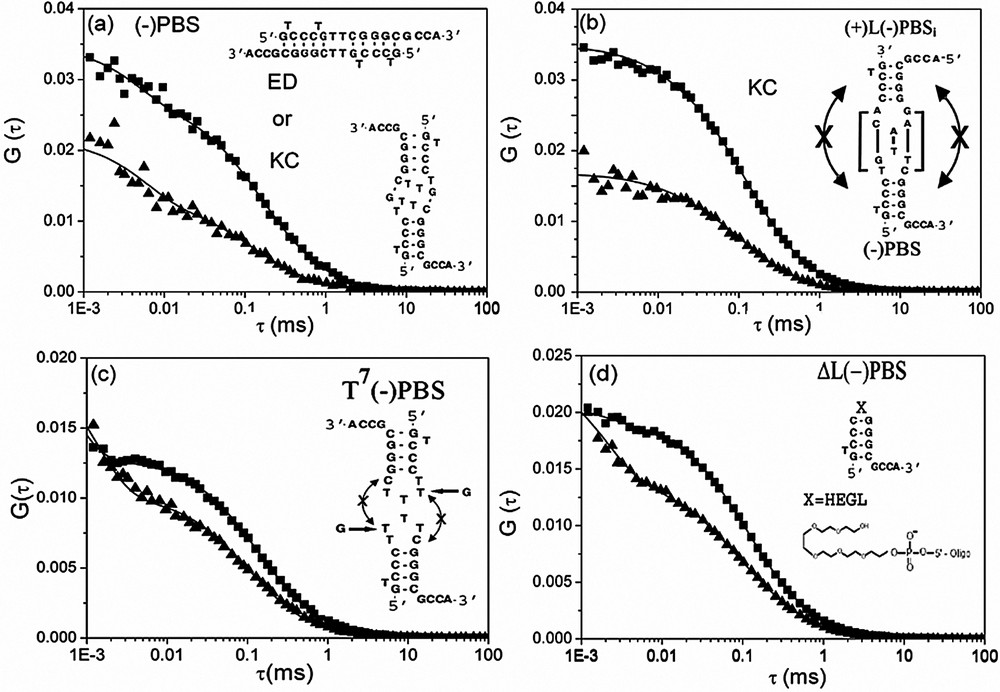
Interaction of NC(12–55) with (−)PBS derivatives, as monitored by FCS. The autocorrelation curves of (−)PBS (a), a mixture of (+)L(−)PBSi and (−)PBS (b), T7(−)PBS (c) and ΔL(−)PBS (d) were recorded at 0.5 μM of oligonucleotides (expressed in strands) in the absence (▴) and in the presence (■) of 1.8 μM of NC(12–55). The continuous lines are fits to the experimental points with Eq. (2). The putative kissing complexes (KC) or extended duplexes (ED) corresponding to the (−)PBS homodimers (a) as well as the (−)PBS/(+)L(−)PBSi kissing complexes (b) are represented. Masquer
Interaction of NC(12–55) with (−)PBS derivatives, as monitored by FCS. The autocorrelation curves of (−)PBS (a), a mixture of (+)L(−)PBSi and (−)PBS (b), T7(−)PBS (c) and ΔL(−)PBS (d) were recorded at 0.5 μM of oligonucleotides (expressed in strands) in the ... Lire la suite
To further demonstrate the formation of NC-induced kissing complexes, we tested the interaction of NC with several
Interestingly, in the absence of NC(12–55), the
4 Conclusion
By combining FCS and fluorescence spectroscopy, we have shown that NC (i) activates the destabilization of both
Moreover, the HIV genome corresponds to a compact dimeric RNA where two identical RNA molecules are hold together by stable interactions at the
Acknowledgements
We are grateful to J.-L. Darlix and B.-P. Roques for discussion, and D. Ficheux for the synthesis of the peptide. This work was supported by grants from ANRS, Sidaction and the European Community (TRIoH). C.E. is a fellow from the French ‘Ministère de la Recherche’.
Vous devez vous connecter pour continuer.
S'authentifier