

1 Introduction
A great variety of experimental techniques were developed and frequently used to study adsorption and adsorption kinetics of small molecules in microporous materials such as zeolites. Thus, inter alia classical (i) gravimetric (see, e.g., [1,2]), (ii) barometric (piezometric) (see, e.g., [3,4]) and (iii) volumetric (see [5]) methods were employed as well as the later introduced (iv) NMR spectroscopic, especially Pulse-Field-Gradient NMR (PFG NMR) spectroscopic (see, e.g., [6–8]), (v) frequency response (FR) (see, e.g., [9,10]), (vi) zero length column (ZLC) (see, e.g., [11,12]) and (vii) quasielastic neutron scattering (QENS) (see, e.g., [13,14]) techniques to determine diffusivities (diffusion coefficients). This enumeration of methods is by no means exhaustive: very recent developments, which should be at least mentioned here, are the surface temperature IR (STIR) technique introduced by Grenier et al. [15], the membrane method designed by Kapteijn et al. [16], the interference microscope measurements developed by Schemmert and Kärger [17] and the Positron Emission Profile (PEP) technique by van Santen et al. [18]. In any event, some of the new promising techniques seem to render possible the investigation of multicomponent systems and/or the determination of the anisotropy of diffusion. State of the art and progress in this research area were several times reviewed (see, e.g., [19–21]).
As one may learn from the reports in the literature, there still exist in some cases discrepancies, even severe ones between the results obtained via sorption kinetics measurements (cf., e.g., methods (i)–(iii), (vi)) on the one hand and experiments which determine the so-called self-diffusion coefficient under equilibrium conditions on the other (PFG NMR, QENS; i.e. methods (iv) and (vii)). This holds true in particular for systems such as aromatics or paraffins in zeolite X [22,23]. But, as is shown below (vide infra, Table 3), in other cases quite satisfactory agreement of results obtained by different and independent experimental techniques occurred (see, e.g., [24–26]).
Diffusivities of benzene in H-ZSM-5 or silicalite and comparison with literature data
| Authors, method | Karge and Niessen [41,53], FTIR | Bülow et al. [56], V = const., p = variable | Zikánová et al. [52], Grav., Piezo. | Förste et al. [42], NMR tracer | Ruthven et al. [57], ZLCa | Shen et al. [24], Van-Den-Begin et al. [58], FR |
| D0 (cm2.s–1) | 6.8 × 10⁻¹⁰ | 6 × 10⁻¹⁰ | 6 × 10⁻¹⁰ | (5–9) × 10–10 | 2 × 10⁻⁹ | 1.4 × 10⁻⁹ |
| TDiff. (K) | 375 | 363 | 363 | 386 | 373 | 375 |
| n (mol uc–1) | 1.4 | 2.0 | 1.4 | 4 | – | 1.4 |
a Silicalite.
Pyridine is a widely used probe for acidity of solid oxides [27–29] as well as zeolites and zeolite-like materials [30,31]. IR spectroscopy of pyridine attached to Brønsted acid sites (acidic hydroxyls), Lewis centers (cf. [31]), and cations (such as alkaline metal, alkaline earth, rare earth or transition metal ions, cf. [30,32,33]) is very popular because of the rather sharp bands which can be observed in the ring deformation region. The positions of the bands are typical of the respective adsorption sites. For instance, Brønsted acid sites give rise to bands around 1540 cm–1 (PyB). Bands around 1450 cm–1 (PyL) are indicative of “true” Lewis sites (i.e. in the case of zeolites, extra-framework Al-containing species) [34,35]. Finally, pyridine coordinatively bound to cations produces IR bands in the range from 1430 to 1450 cm–1, depending on their Coulomb potential [32,33]. Furthermore, pyridine is used as a probe molecule in temperature-programmed desorption from acidic materials [36] as well as in microcalorimetry [37]. The latter two techniques allow to determine not only the density but also the strength of acidic centers. Application of pyridine molecules as indicators of acidity is also reported in XPS [38] and NMR studies [39].
Despite the importance of pyridine as a probe for such materials almost nothing, however, is known about the transport behavior of pyridine in porous materials. One main reason for the scarcity of diffusion measurements with pyridine in, e.g., zeolites is due to the fact that the diffusivities of pyridine in such systems are usually very low and out of the range of most of the usually used experimental techniques. In particular, NMR methods to measure the so-called self-diffusion coefficients are not applicable. The low values of diffusivities expected for pyridine in many microporous materials originate not only from the bulkiness of the probe molecules, but in the first line from the frequently strong interaction of pyridine with the respective sorption sites. Based on an earlier application of in situ IR spectroscopy on problems of pyridine diffusion in zeolites [40], and encouraged by more recent experimental progress [41], a new attempt was made to investigate the transport behavior of pyridine in microporous structures. The systems reported on in the current contribution were pyridine/mordenite and pyridine/MFI materials (ZSM-5, silicalite).
Unfortunately, application of all of the above-mentioned methods (i.e. (i)–(vi)) was restricted to single-component systems, i.e. so far they did not allow to study sorption and sorption kinetics of sorbate mixtures. The only relevant exception was the ingenious experiment by Kärger et al., who studied via tracer exchange 1H NMR experiments the counter-diffusion of C6H6 and C6D6 under equilibrium conditions [42].
The knowledge of sorption behavior of multicomponent sorbate systems is, however, of paramount interest with respect to separation processes and catalysis in zeolites. Several times it was claimed in the literature that in zeolites the diffusivities of two kinds of hydrocarbons in a mixture should be lower by two or even more orders of magnitude than the diffusion coefficients of the respective single components (see, e.g., [43]). This situation was the motivation to develop a novel in situ IR spectroscopic method to determine the sorption and sorption kinetics of molecules in microporous systems. The underlying idea was that, provided the IR spectra of the sorbate molecules are sufficiently different and those of their mixtures can be reliably decomposed, IR spectroscopy should enable us to monitor co- and counter-diffusion in sorbate/zeolite systems. A first attempt was made already in 1986 in that the counter-diffusion of benzene versus pyridine in dealuminated mordenite was monitored by IR spectroscopy [44]. Even though the slow scanning of the spectrometer used (Perkin Elmer 325, equipped with gratings) made quantitative measurements difficult, the experiment showed qualitatively that measurements of counter-diffusion in zeolites through IR spectroscopy is basically feasible.
Experimental realization of the above indicated idea using fast Fourier Transform IR (FTIR) spectroscopy, data evaluation and a number of illustrative examples are described in the current review.
2 Experiment and data evaluation
2.1 Materials
The following sorbent materials were used in the current study: (1) an H-ZSM-5 zeolite sample provided by DEGUSSA, Wolfgang, Germany. The well-shaped, coffin-like crystallites had an average size of 8.8 μm × 5.2 μm × 3.2 μm; (2) hydrogen mordenite (from Norton Comp., MA); (3) H,Na-ZSM-5 (from Dr. H.K. Beyer, Central Research Institute of Chemistry, Hungarian Academy of Sciences, Budapest); (4) silicalite (from the same source as (3)); (5) Li-ZSM-5, prepared from sample (3) by ion exchange in aqueous solution (0.1 N) of LiOH; (6) Na-ZSM-5, prepared from sample (3) by ion exchange in aqueous (0.1 N) solution of NaOH. Exchange with 0.1 N LiOH or 0.1 N NaOH was carried out at 350 K by stirring 1.15 g zeolite (3) in 43 ml solution for 70–80 min, subsequent washing and drying overnight at 375 K. Properties of the zeolites used are presented in Table 1. Chemical analyses were achieved by AAS.
Properties of the zeolite sorbents used
| Number | Zeolite | Formula | nSi/nAl | Particle size (μm)a |
| 1 | H-ZSM-5 | H2.5Na0.1Fe0.1Al2.8Si93.2O192 | 33.2 | 8.8 × 5.2 × 3.2 |
| 2 | H-mordenite | H5.5Na0.5Fe0.1Al6.2Si41.8O96 | 6.7a | 0.8 |
| 3 | H-Na-ZSM-5 | H1.7Na0.9Al2.6Si91.5O192 | 35.2 | 2.0 |
| 4 | Silicalite | Na0.1Al0.1Si95.9O192 | > 800 | 4.0 |
| 5 | Li-ZSM-5 | Li2.6Al2.6Si91.5O192 | 35.2 | 2.0 |
| 6 | Na-ZSM-5 | Na2.6Al2.6Si91.5O192 | 35.2 | 2.0 |
a Samples No. 1, 3–6 were almost spherically shaped. The formulae of samples Nos. 1 and 2 are idealized, i.e. both samples possess significant amounts of Al-containing extra-framework species (“true” Lewis sites).
The adsorbates (benzene (B), ethylbenzene (EB), p-xylene (p-X) and pyridine (Py) were purchased from Merck, Darmstadt, Germany. They were of spectroscopic grade, purified by distillation and chromatography through an Al2O3 column (to remove, in particular from ethylbenzene, oxygenates) and finally subjected to repeated freeze-pump-thaw cycles. They were stored over highly activated 3A molecular sieve pellets. With these materials, single-component diffusion in H-ZSM-5 as well as co-diffusion of B and EB, B and p-X and counter-diffusion B vs. EB, EB vs. B, B vs. p-X, p-X vs. B were studied.
2.2 Apparatus and procedure
Conventional transmission FTIR spectroscopy of macro-samples in an IR flow-cell was employed (cf. Fig. 1). The experiments were carried out with self-supporting wafers produced from zeolite powders (cf. Fig. 1, sample holder).
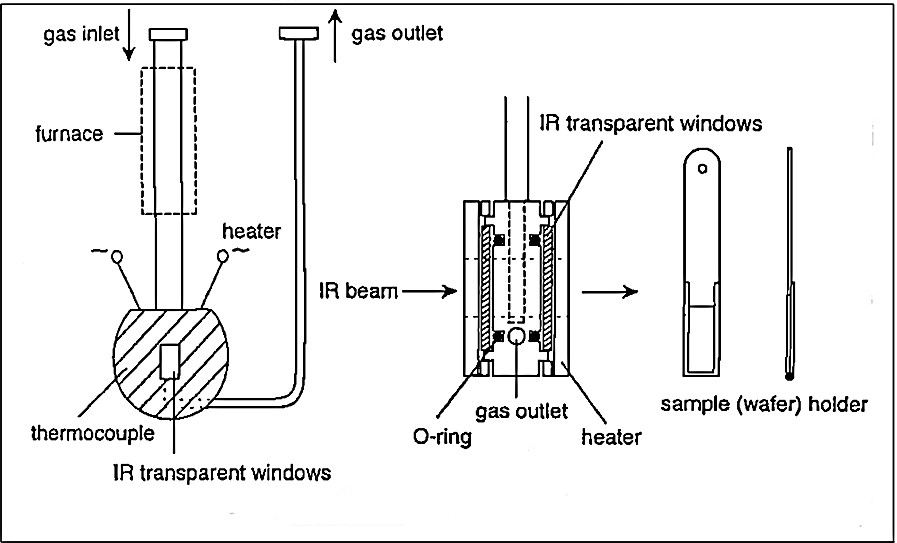
IR flow reactor cell.
The IR cell employed for investigations of pyridine sorption and diffusion was similar to that described in Fig. 1 [41,45,46]. The main difference concerned the design of the IR compartment: it was built from two stainless steel CF 35 flanges with sealed CaF2 windows. These flanges with CaF2 windows were supplied by Oriel, Darmstadt, Germany. They were connected in a sandwich-like manner to a middle stainless steel compartment via copper gaskets. In comparison with the original design [41], this new arrangement enabled us to frequently and continuously apply higher adsorption temperatures (viz. up to 575 K).
The gas dosing system (vide infra) and the FTIR equipment used was the same for all experiments [41,45,46,]. For all types of investigations we used a FTIR spectrometer (PERKIN ELMER Model 1800), which provided the final spectra within 0.4 s, and a laboratory-made gas dosing system (Fig. 2), which enabled us to purge the samples (pre-activated in ultra-high vacuum or in a flow of inert gas, usually at 675 K) at the chosen sorption temperature by a rapid flow (e.g., 800 ml min–1 He) of inert gas (He).
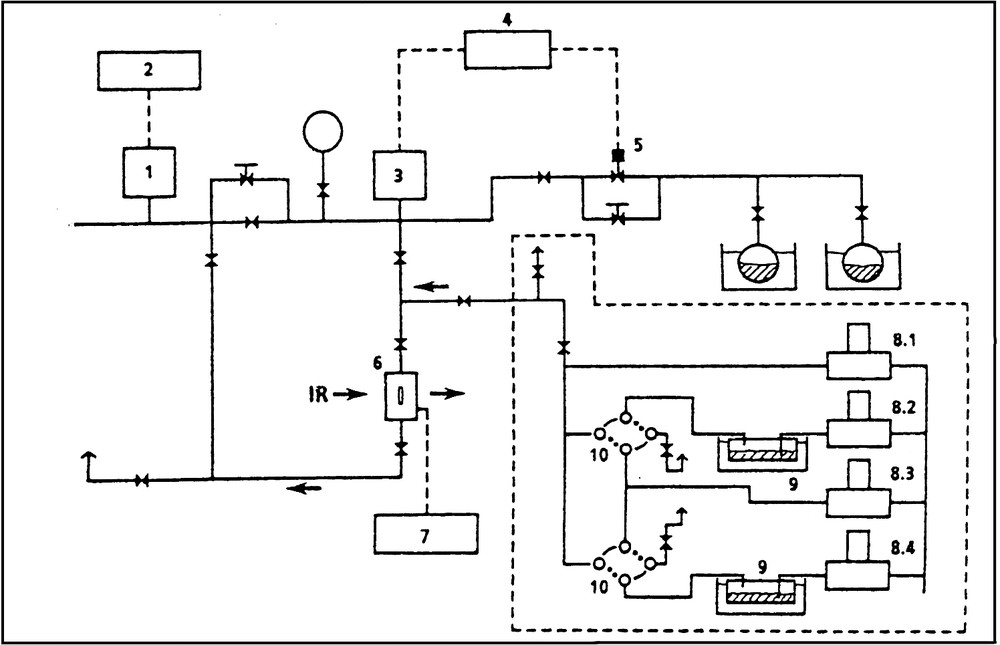
Experimental set-up for diffusion measurements. Gas mixing and dosing device: ·········; (1) high vacuum gauge; (2) pressure display; (3) Baratron; (4) pressure controller; (5) magnetic valve; (6) IR flow reactor cell; (7) temperature controller; (8.1–8.4) mass flow controller; (9) saturator; (10) two-way valves.
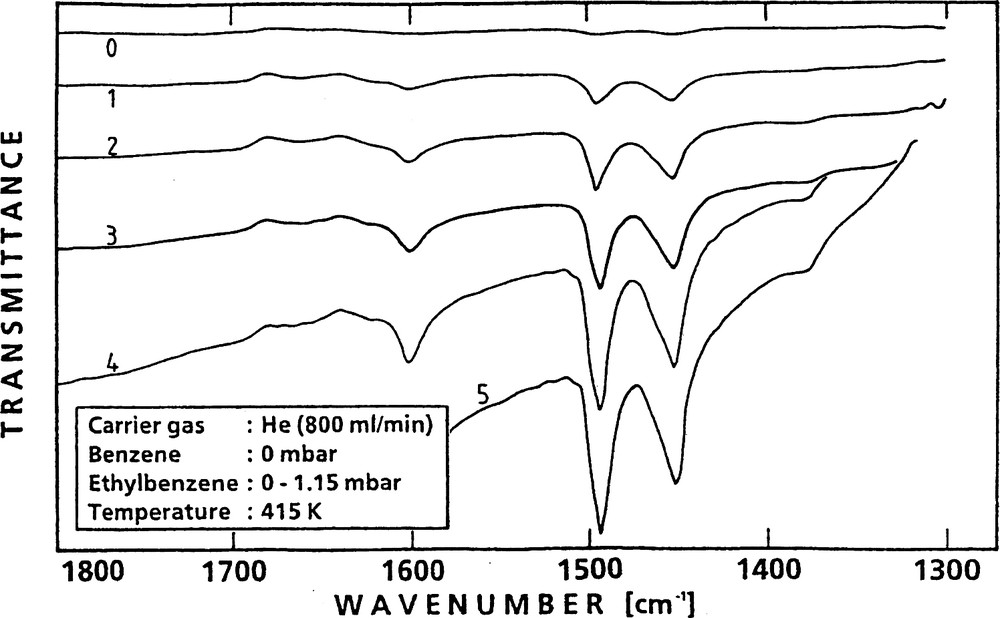
This fast flowing He-stream, when loaded with the adsorbate vapor (see below), ensured that, first, no depletion of the sorbate in the intercrystalline voids occurred and, secondly, the heat of adsorption was rapidly dissipated, as was confirmed by appropriate measurements [45]. Depletion of the sorbate in the intercrystalline space and a non-isothermal situation as a consequence of evolution of the adsorption heat are, according to findings of Doelle and Riekert [2], main pitfalls in sorption kinetics measurements. At zero time, one or two (or more) sorbates could be injected via separate gas streams carrying the sorbates with the desired partial pressure, whereby the total pressure was kept constant. The changes in the partial pressures were very rapid and well reproduced. Starting at zero time, IR spectra were continuously (i.e. every 0.4 s, if necessary) scanned. The FTIR spectrometer measured the development of characteristic adsorbate bands as a function of time (cf., e.g., Fig. 3 where, for monitoring the uptake of benzene into H-ZSM-5, the typical band at 1478 cm–1 was used). Usually, the background remained unchanged throughout the whole experiment.
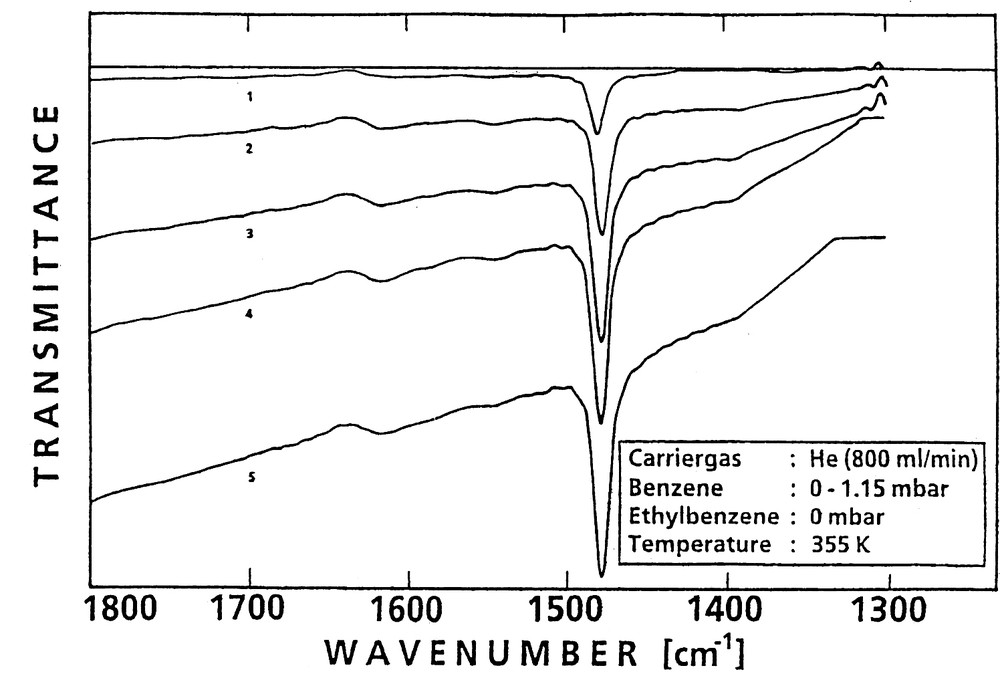
Set of FTIR spectra indicating successive states of sorption of benzene into H-ZSM-5 (0, 1, 2, 3, 4: after 0, 2.4, 14.8, 38.8 and 484 s, respectively).
When no further change in the absorbance of the bands of the introduced sorbate(s) was observed (steady state), the partial pressure(s) of component(s) A (or A and B) could be increased by the next increment (further sorption) or decreased (desorption).
The typical bands were integrated and, with the help of the respective calibration curves, the integrated absorbances determined. For calibration, the absorbance of a zeolite sample loaded with a known amount of adsorbate was determined, whereby the loading was obtained via an independent measurement, e.g. through the pressure drop when the sorbate was dosed from a calibrated reservoir into the calibrated cell volume. An example is shown in Fig. 4 (cf. also [45,46]). In another procedure, one simultaneously measures the absorbance of the adsorbate/adsorbent system and the gain of weight upon loading the adsorbent [47].

Calibration curve: absorbance at 1478 cm–1 as a function of the amount of adsorbed benzene.
The amount of sorbate taken up at time t, Mt, and referenced to the final uptake, M∞, was plotted versus the square root of time (cf., e.g., the crosses in Fig. 5).
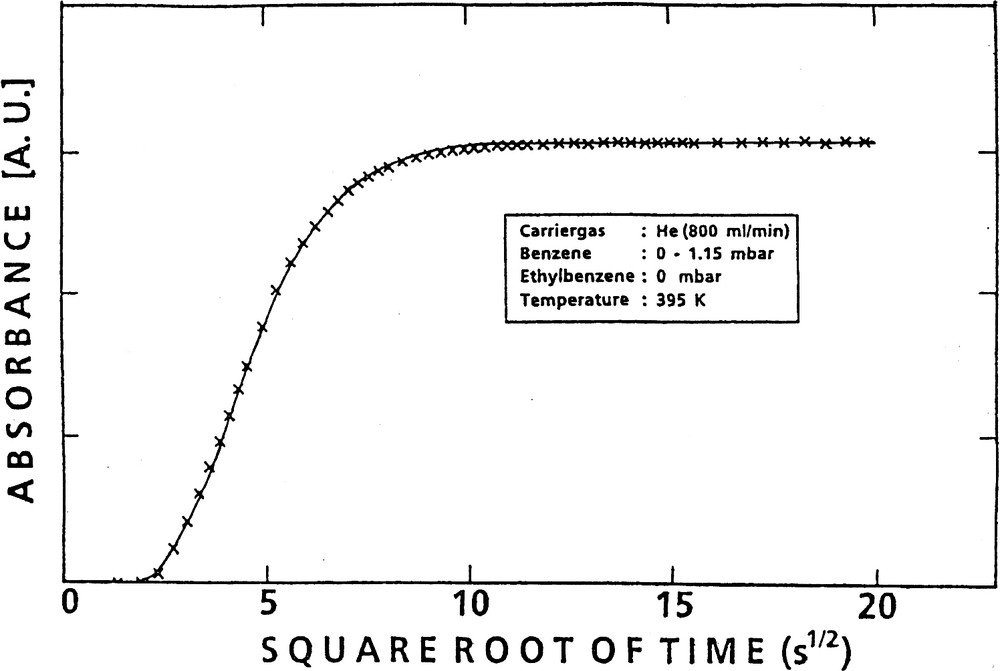
Uptake of benzene into H-ZSM-5 as a function of the square root of time (experimental data: ××××; fit according to Eq. (4): solid line).
2.3 Data evaluation
The thus-obtained experimental data were further evaluated via fitting with an appropriate solution of Fick's second law as provided by Crank [48]:(1)
The time lag occurs because the partial pressures of the sorbates as adjusted through the mass flow controllers 8.2 and 8.4 (Fig. 2) are not instantaneously established at the location of the sample due to the finite flow rate. For the experiments, the time lag was determined from blank experiments and could be best described by Eq. (3).(3)
The effect of the shape of the crystallites was neglected, i.e. the above solution of Fick's second law for a sphere-shaped adsorbent was adopted, even though the used H-ZSM-5 zeolite crystallites exhibited a coffin-like shape (vide infra). This was justified by the excellent agreement with data obtained by different techniques, where shape effects were considered but were obviously negligible. Also, no surface barrier effects were taken into account. In fact, it was confirmed later on [50] that the samples used did not exhibit diffusion barriers at their external surface and the transport was of pure Fickian type.
Starting under the initial condition C(r,t) = 0 for t = 0, one obtains (compare [41,45]) from Eqs. (1) and (3) with Mt ~ At (absorbance at time t), M∞ ~ A∞ (absorbance at steady state):(4)
More details of the experimental set-up and procedures were described in [41,45,46].
3 Sytems investigated
With the above indicated sorbate materials, i.e. B, EB, and p-X, single-component diffusion in H-ZSM-5 was investigated. But with Py single-component diffusion experiments were carried out with H-mordenite, H-ZSM-5, Li-ZSM-5 and Na-ZSM-5. Co-diffusion of B and EB, B and p-X as well as counter-diffusion of B vs. EB, EB vs. B, B vs. p-X, p-X vs. B were investigated in H-ZSM-5.
4 Results and discussion
4.1 Single-component diffusion of B, ethylbenzene, p-xylene, and pyridine
4.1.1 Sorption and sorption kinetics of benzene
The diffusion of benzene in H-ZSM-5 has been frequently studied by a great variety of techniques. Therefore, a large body of fortunately consistent data (diffusion coefficients, activation energy of diffusion, heat of adsorption) of this system is available from the literature and can be used for comparison. This prompted us to start with an extended FTIR investigation of sorption and sorption kinetics of benzene in H-ZSM-5 in order to check the reliability of the method of FTIR spectroscopic determinations of diffusivities in zeolites. Fig. 3 was already used to illustrate the principle of the method (vide supra). The figure displays a selection of IR spectra scanned after admission of a stream of benzene in helium to the main helium flow to produce the desired jump of the benzene partial pressure in the gas phase contacting the activated zeolite sample. The evolution of the typical band (ring deformation band of benzene at 1478 cm–1) indicated the progress of the uptake with time, due to the diffusion of the sorbate benzene into the pores of H-ZSM-5. Steady state was reached when the band ceased to grow.
Fig. 5 provides a plot of the uptake vs. the square root of time and demonstrates the perfect fit of Eq. (4) (solid line) to the experimental data (crosses). In Fig. 6 sets of such curves of uptake (converted to absolute amounts of adsorbate) vs. the square root of time are depicted for various temperatures and pressure jumps. The diffusivities were corrected (D → D0) according to the Darken equation, Eq. (2), (cf. [49]), using the corresponding sorption isotherms (cf., e.g., Fig. 7).). From Fig. 6 one recognizes that, as one would expect, the steady-state uptake decreases with increasing temperature, whereas the diffusivities increase.
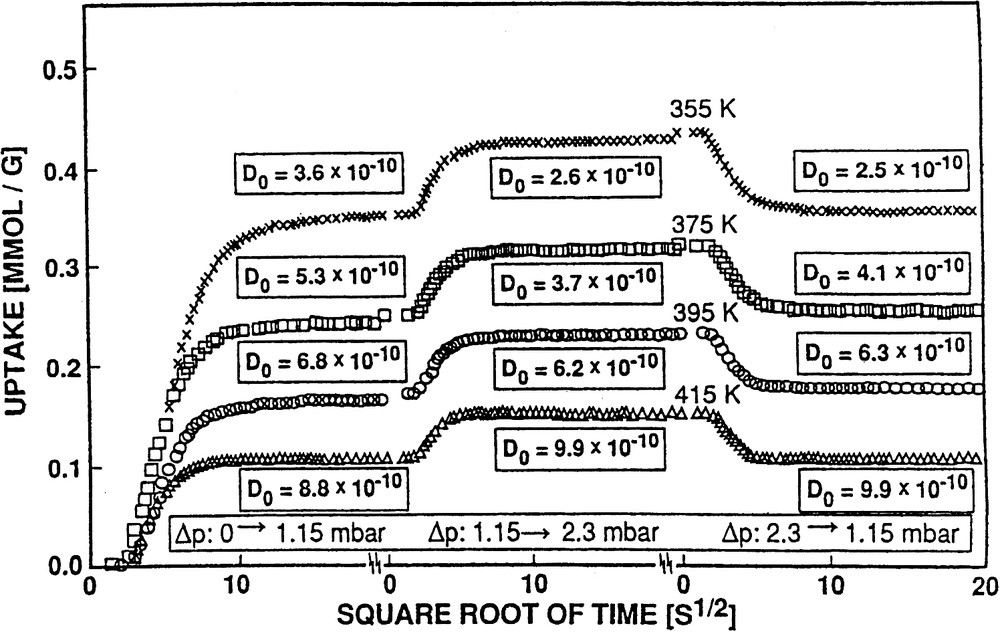
Effect of temperature on the (corrected) diffusivities and amounts adsorbed of benzene in ZSM-5 for different pressure jumps and two final partial pressures (1.15 and 2.30 mbar).
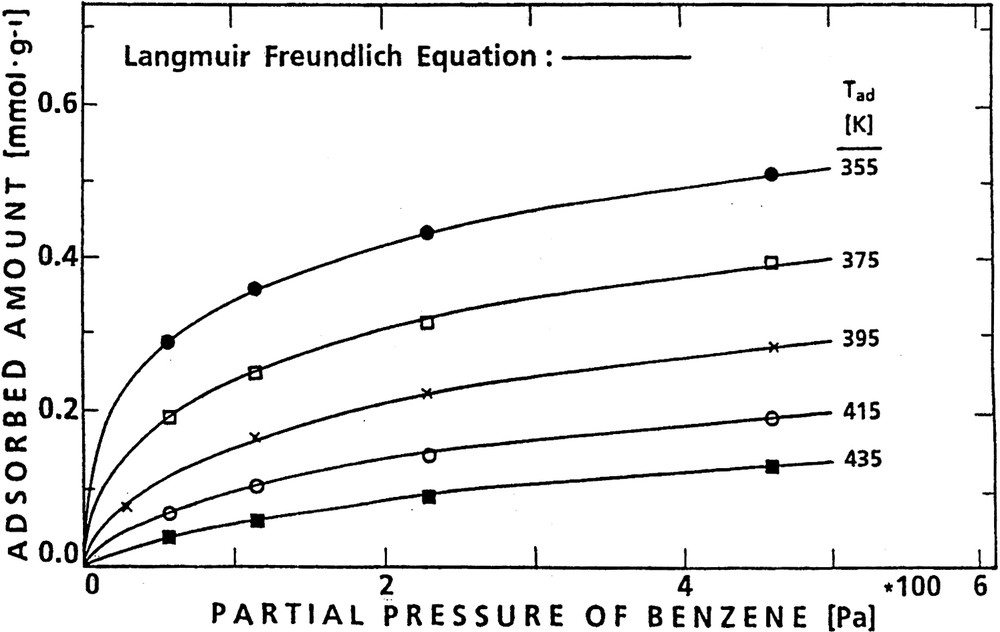
Isotherms of benzene adsorption on H-ZSM-5 for various adsorption temperatures.
The isotherms were constructed from the plateaux of uptake curves as shown, e.g. in Fig. 6 for two steady state loadings, viz. at 1.15 mbar (115 Pa) and 2.30 mbar (230 Pa) benzene pressure at increasing temperatures, viz. 355, 375, 395 and 415 K. A set of isotherms obtained for the system benzene/H-ZSM-5 (using additionally steady-state coverages at 57 and 460 Pa) is presented by Fig. 7. Such isotherms were describable by Freundlich–Langmuir equations, Eq. (5) as discussed in [45,51].(5)
Furthermore, the isotherms could be evaluated at constant coverage to derive the corresponding set of isosteres (Fig. 8), the slopes of which yielded the isosteric heats of adsorption (Table 2).
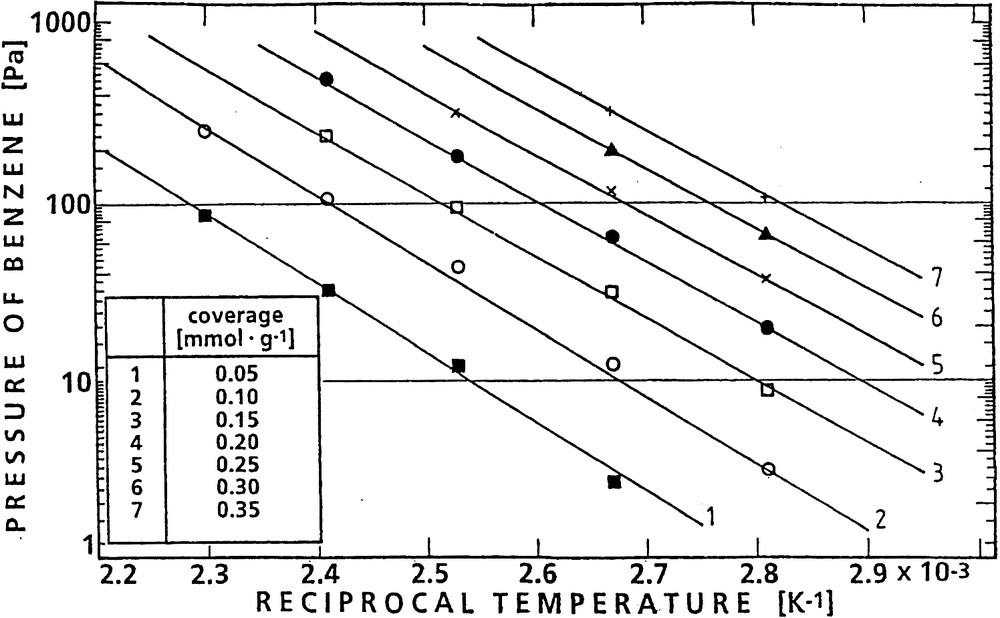
Isosteres of benzene adsorption on H-ZSM-5 for various coverages.
Isosteric heat, Qisost, and microcalometrically measured heat of adsorption, Qad, of benzene, ethylbenzene and p-xylene in H-ZSM-5
| Sorbate | Coverage (mmol g–1) | Qisost (kJ mol–1) | Reference | Qad (kJ mol–1) | Reference |
| Benzene | 0.35 | 64 ± 5 | [51] | 64.5 ± 5 | [51] |
| 0.35 | 60 | [52] | |||
| Ethylbenzene | 0.35 | 82 ± 5 | [51] | 86.5 ± 5 | [51] |
| p-Xylene | 0.35 | 79 ± 5 | [53] | 78 ± 2 | [54] |
| 80 | [55] |
The result obtained for the diffusivity of benzene through the method described above is incorporated into Table 3 together with values of D0(B) determined by a variety of different techniques. From a plot of the diffusivities obtained through the FTIR method for different temperatures (see, e.g. Fig. 5) as a function of the reciprocal temperature (Arrhenius plot) one obtains the activation energies of diffusion (vide infra, Table 4).
Activation energy for diffusion of benzene, ethylbenzene and p-xylene in H-ZSM-5
| Sorbate | EA (kJ mol–1) | Reference | EA (kJ mol–1) | Reference |
| Benzene | 23 | [55] | 26 | [52] |
| 27 | [56] | |||
| 27 | [57] | |||
| Ethylbenzene | 31 | [55] | 30 | [57] |
| p-Xylene | 30 | [53] | 30 | [57] |
As one realizes from Tables 2,3 and 4, the results derived for the heat of adsorption, Qisost, the diffusion coefficient, D0, and the activation energy of diffusion, EA, for the system benzene/MFI zeolites are in very good agreement with data reported by other authors, who used a variety of different techniques. Thus, the reliability of the novel FTIR method of investigating sorption and sorption kinetics was, in fact, successfully confirmed.
4.1.2 Sorption and sorption kinetics of ethylbenzene and p-xylene
The IR spectrum of ethylbenzene adsorbed onto H-ZSM-5 is different from that of benzene (compare Figs. 3 and 9).
Set of FTIR spectra indicating successive states of sorption of ethylbenzene in H-ZSM-5.
Here, evaluation of the bands at 1496 and 1453 cm–1 is suitable for quantitative determination of the data of sorption and sorption kinetics. Sorption experiments analogous to those described for benzene led to the corresponding values of D0, Qisost and EA (cf. [41,45], Tables 2, 4, and 6; for Table 6 vide infra, Section 4.2).
Diffusivities of benzene (B), ethylbenzene (EB) and p-Xylene (p-X) in H-ZSM-5 at 395 K upon pressure jumps of Δp[B] = Δp[EB] = Δp[p-X]: 0 → 115 Pa (cf. [41,45,51,53])
| Type | n(B) (mmol g–1) | D0(B) (cm2 s–1) | n(EB) (mmol g–1) | D0(EB) (cm2 s–1) | n(p-X) (mmol g–1) | D0(p-X) (cm2 s–1) |
| (a) | 0.16 | 6.8 × 10⁻¹⁰ | 0.32 | 5.8 × 10⁻¹⁰ | 0.33 | 1.5 × 10⁻⁹ |
| (b) | 0.02 | – | 0.30 | 3.5 × 10⁻¹⁰ | 0.29 | 1.3 × 10⁻⁹ |
| (c) | 0.02 | 2.0 × 10⁻¹⁰ | 0.30 | 2.0 × 10⁻¹⁰ | ||
| 0.05 | 8.0 × 10⁻¹⁰ | 0.29 | 8.0 × 10⁻¹⁰ |
a Single-component diffusion.
b Co-diffusion [B + EB or B + p-X].
c Counter-diffusion [B vs. EB or B vs. p-X].
A similar study of sorption and sorption kinetics was carried out with p-xylene [53]. The system p-xylene/H-ZSM-5 gives rise to a very typical band at 1516 cm–1, the absorbance of which was monitored as a function of time, temperature and loading. The results of these measurements are also summarized in Tables 2,4, and 6.
The diffusivities of EB or p-X as single components obtained by the novel FTIR technique are in good agreement with those reported by other authors almost simultaneously with or subsequently to the report of our data. This also holds for the isosteric heats of adsorption and the activation energies of diffusion of those sorbates as can be seen from Tables 2, 4, and 6.
From Table 6 (vide infra, Section 4.2) one recognizes that D0(p-X) > D0(B) > D0(EB). Furthermore it was found that these differences between the diffusivities are the more pronounced the lower the temperature is [45].
The result that the corrected transport diffusivity of p-xylene in H-ZSM-5 is higher than that of benzene, i.e. D0(p-X) > D0(B), is somewhat surprising. Similar to D0(EB) < D0(B), one would have expected the reverse relation, i.e. D0(B) > D0(p-X). However, basically the same observation was made by Rees et al. [59], who reported that D0(p-X) is higher by about two orders of magnitude than D0(B). This was explained by a more rapid diffusion of p-X through the straight channels of the ZSM-5 structure than through the sinusoidal ones. The IR measurements, however, average these two modes of transport, thus yielding a lower increase of D0(p-X) compared to D0(B).
4.1.3 Sorption and sorption kinetics of pyridine
4.1.3.1 Sorption of pyridine into H-mordenite
In previous studies [40,60] attempts were made to monitor the uptake of pyridine into H-mordenite (sample No. 2) at 395 and 475 K and evaluate from such uptake experiments the respective transport diffusion coefficients. The results were unsatisfactory in that the sorption kinetics could not be described by a uniform coefficient. Rather, two diffusion coefficients, Db and De, must be employed related to the beginning and the end of the uptake process, respectively [60]. This observation was ascribed to an immobilization of the sorbate molecules which occurred at the relatively low adsorption temperatures of 395 or even 475 K.
The temperature had to be increased to at least 525 K to significantly improve the mobility of pyridine in mordenite [61]. In fact, the uptake curves shown in Fig. 10 could be fitted by the solution given in [41,45] using a uniform diffusivity of 1 × 10–12 cm2 s–1.

Uptake of pyridine into hydrogen mordenite (H-MOR) as a function of the square root of time monitored through the increase of the absorbance of the PyB (d □□□□□) and PyL () bands and fitted (solid lines) by a solution of Fick's second law according to Eq. (4).
This value was found for the kinetics of populating both the Brønsted centers (indicated through the change in the adsorbance of the typical PyB band at 1540 cm–1) and the Lewis sites (monitored by the increase of the adsorbance of the typical PyL band at 1450 cm–1). It might be noteworthy that in an early attempt to measure diffusivities of pyridine in H-mordenite at 573 K, Karge and Klose [40] arrived at a similar value of D, viz. D = 5 × 10–12 cm2 s–1. Admittedly, those earlier results were certainly less reliable because of experimental limitations (slow scanning of the IR spectra with a grating IR spectrometer, poor dosing facilities, etc.).
The increase in the temperature of the sorption experiment brought about an obvious improvement. An effect of immobilization of the sorbate molecules, however, was still operative. This was revealed by the reverse experiment, i.e. by the attempt to obtain the diffusivities from desorption kinetics as well (e.g., by a pressure jump, Δp: 11.5 → 0 Pa). In that case it was observed that only a small fraction of the adsorbed pyridine could be removed. Thus, obviously even higher temperatures are required to make the sorbate molecules sufficiently mobile and establish their ‘random walk’. The fact, however, that the uptake of pyridine is describable by a solution of Fick's second law using a uniform coefficient of transport diffusion is possibly indicative of a mechanism, where a rather slow migration of the sorbate is followed by a very rapid reaction with strongly acidic Brönsted and/or Lewis centers. In this sense, the diffusion of pyridine may be the rate-determining step in the overall uptake process of pyridine into H-mordenite (and H-ZSM-5, vide infra).
4.1.3.2 Sorption of pyridine into and desorption from H-ZSM-5
A spectrum of H-ZSM-5 (sample No. 1) after pyridine adsorption (Δp: 0 → 11.5 Pa) is shown in Fig. 11.
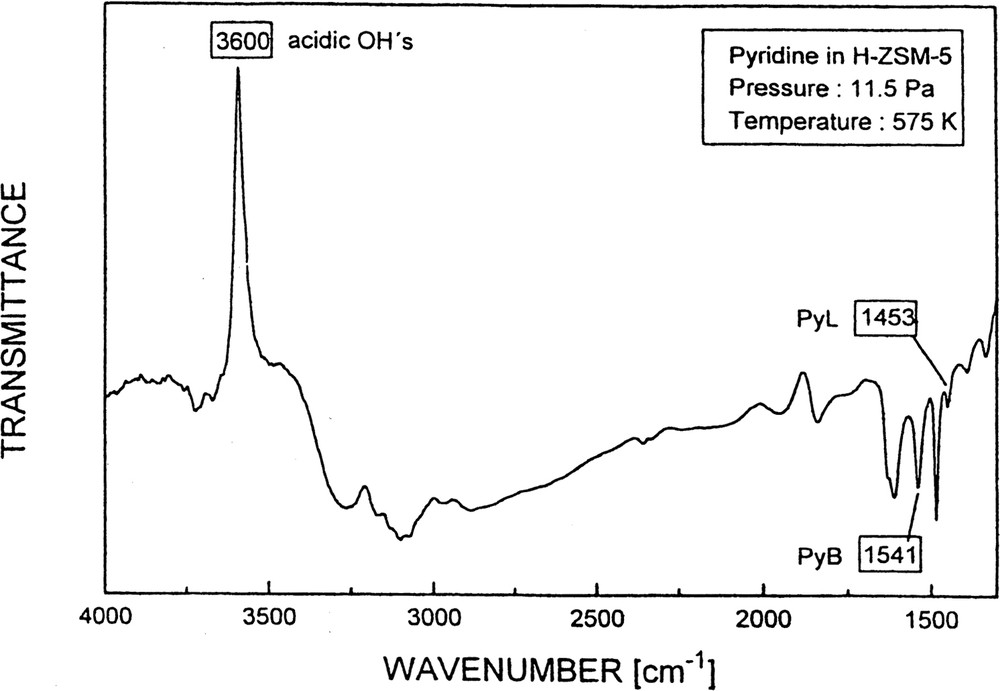
FTIR spectrum of the OH stretching and pyridine deformation region after pyridine sorption into H-ZSM-5.
Note the upward signal of transmittance at about 3600 cm–1, which is due to the complete consumption of the acidic hydroxyls upon reaction with pyridine. The scatter in the data related to the increase in transmittance at 3600 cm–1 was, however, much more pronounced than in the case of the change of transmittance at the PyB and PyL bands [61]. The main reason for this higher scatter is the low transmittance in the OH stretching region of the adsorbent. Thus, it is evident that in the present case monitoring the intensity changes of the OH bands with time is less suitable for kinetics measurements than that of the bands of the sorbate pyridine.
With H-ZSM-5 (sample No. 1) as an adsorbent, similar observations were made as in the case of pyridine sorption into H-mordenite [61]. The immobilization effect seemed to be even more severe. The new cell with sealed CaF2 windows in stainless steel flanges (vide supra), however, facilitated the application of higher adsorption temperatures. The increase of the adsorption temperature enabled us to describe the pyridine uptake by a uniform transport coefficient. This is demonstrated in Fig. 12 and is in contrast to earlier results (cf. [60]) obtained at lower adsorption temperatures (395 or 475 K).
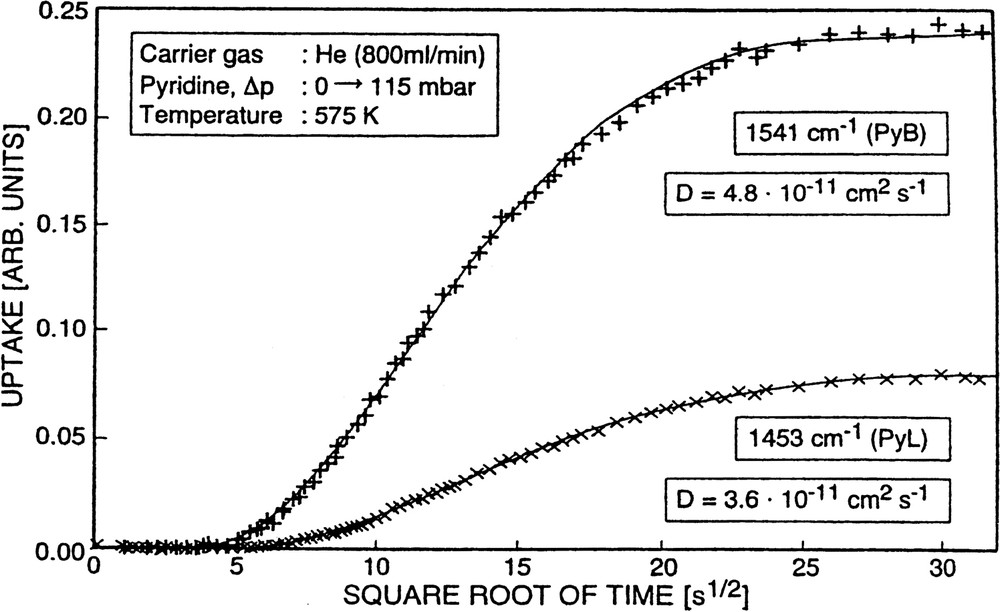
Uptake of pyridine into H-ZSM-5 as a function of the square root of time monitored through the increase of the absorbance of the PyB and PyL bands (×××××) and fitted (solid lines) by a solution of Fick's second law according to Eq. (4).
The diffusivities evaluated for Tad = 575 K (cf. Fig. 12) amount to (4–5) × 10–11 cm2 s–1. They were essentially the same, irrelevant as to whether the changes in absorbance of the band typical of pyridine held by Brønsted sites (PyB, 1541 cm–1) or Lewis sites (PyL, 1453 cm–1) were considered. Moreover, it is worthwhile to note that the changes in the absorbance of the PyB-band (1541 cm–1) were paralleled by the corresponding changes of the band at 3600 cm–1 (decrease in transmittance) which corresponds to the reacting acidic hydroxyls, although the scatter in the experimental data was much higher in the latter case (vide supra). Sorption of pyridine into H-ZSM-5 was, however, even at 575 K not reversible. Thus, the situation was similar to that of the system pyridine/H-mordenite. The interaction of the basic molecules (pyridine) with the acidic Brønsted as well as with the acidic Lewis centers is obviously too strong as to permit a sufficiently high mobility of the adsorbate molecules after chemisorption. It is evident that it requires temperatures significantly higher than 575 K to establish reversibility of pyridine sorption into and desorption out of strongly acidic zeolites such as H-mordenite and H-ZSM-5. Unfortunately, due to experimental reasons (sealing of the CaF2 windows of the cell), sorption temperatures fairly above 575 K could not be arrived at in the present study. The obtained results are, together with those of the other pyridine/zeolite systems, summarized in Table 5.
Diffusivities of pyridine in various zeolites
| Number | Zeolite | Temperature (K) | Diffusivity (cm2 s–1) | Uptake |
| 1 | H-ZSM-5 | 575 | 4 × 10–11 | Irreversible |
| 2 | H-mordenite | 525 | 1 × 10–12 | Irreversible |
| 3 | H,Na-ZSM-5 | – | – | Not investigated |
| 4 | Silicalite | 525 | 2 × 10⁻⁹ | Reversible |
| 5 | Li-ZSM-5 | 575 | 8 × 10–12 | Reversible |
| 6 | Na-ZSM-5 | 575 | 2 × 10–11 | Reversible |
4.1.3.3 Sorption of pyridine into and desorption out of silicalite
Strong interaction of pyridine with the adsorbent as was encountered in the preceding cases (due to the presence of strongly acidic Brönsted and Lewis sites) should be minimized if highly siliceous zeolite-like sorbents such as silicalite were employed (cf. [61]). Fig. 13 displays a set of spectra obtained upon sorption of pyridine into silicalite.
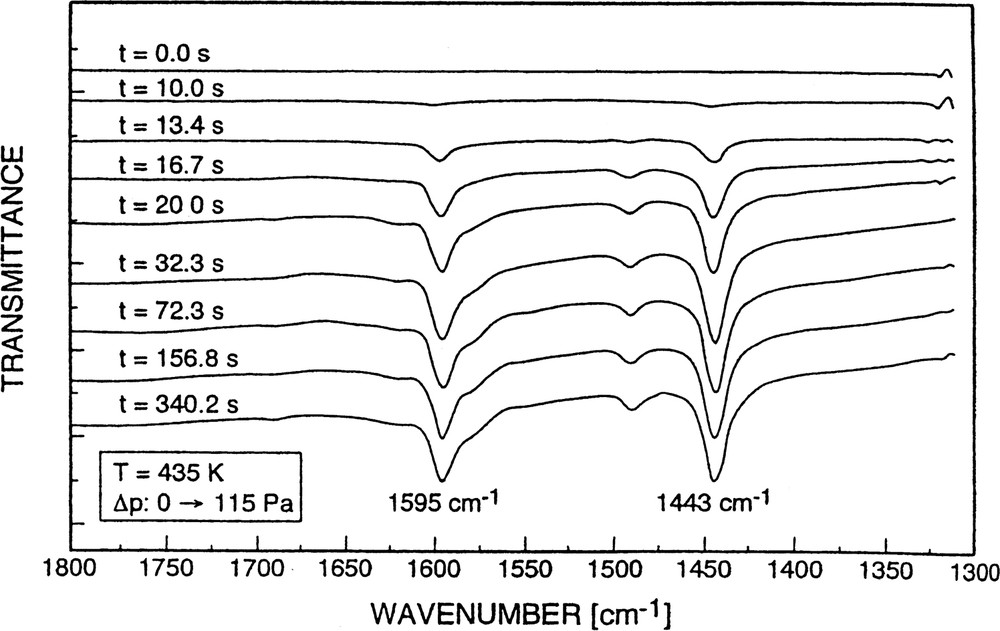
Set of FTIR spectra indicating successive states of sorption of pyridine into silicalite.
No bands characteristic of pyridine bound to Brønsted and/or Lewis centers were observed. The bands at 1595 and 1443 cm–1 are due to non-specific physisorption of the probe. With respect to the 1443 cm–1 band, this was concluded from its easy removal by a decrease of the pyridine partial pressure (vide infra). The band position is, however, close to that of bands around 1450 cm–1 originating from pyridine held by ‘true’ Lewis sites, i.e. Al-containing extra-framework species (cf. [34,35,62]). This, by the way, seems to be the reason why in the case of H-ZSM-5 (sample No. 1), upon increasing the partial pressure of pyridine, a constant absorbance at 1540 cm–1 (PyB), but a steady increase of the band around 1450 cm–1 (PyL) could be observed (cf. also [60]): this phenomenon was simply due to a superposition of (constant) chemisorption onto ‘true’ Lewis sites of the H-ZSM-5 sample (No. 1) and non-specific physisorption.
In contrast to the systems pyridine/H-mordenite and pyridine/H-ZSM-5, with pyridine/silicalite it was, however, possible to obtain (reversible) adsorption isotherms. They were well described by a Langmuir–Freundlich equation (see Fig. 14, and vide supra).
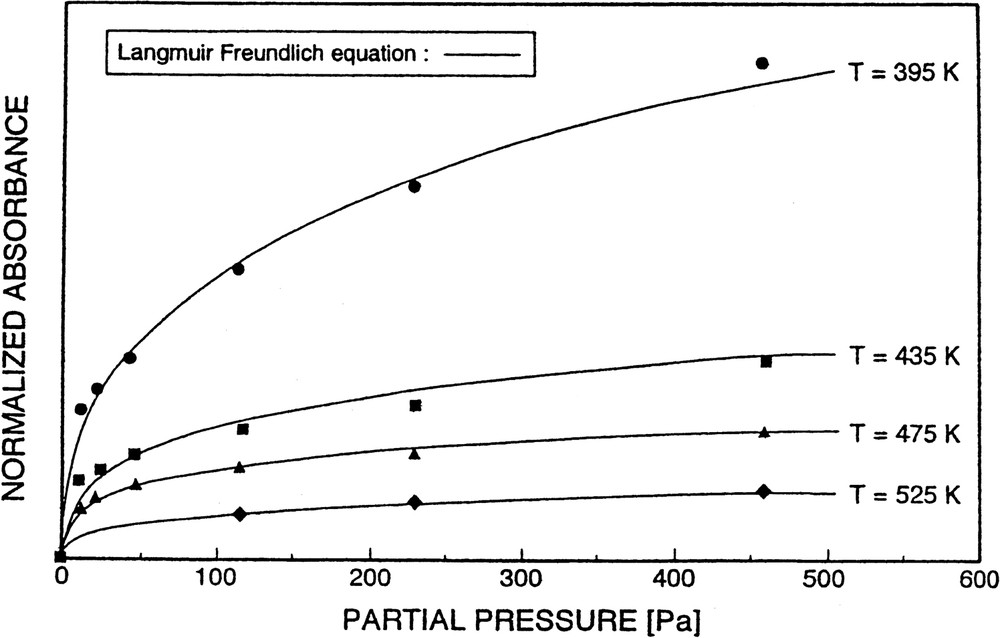
Isotherms of pyridine adsorption on silicalite at various temperatures, T, and described by a Langmuir–Freundlich equation (solid lines).
In Fig. 15a and b, sorption and desorption curves are depicted for the system pyridine/silicalite.
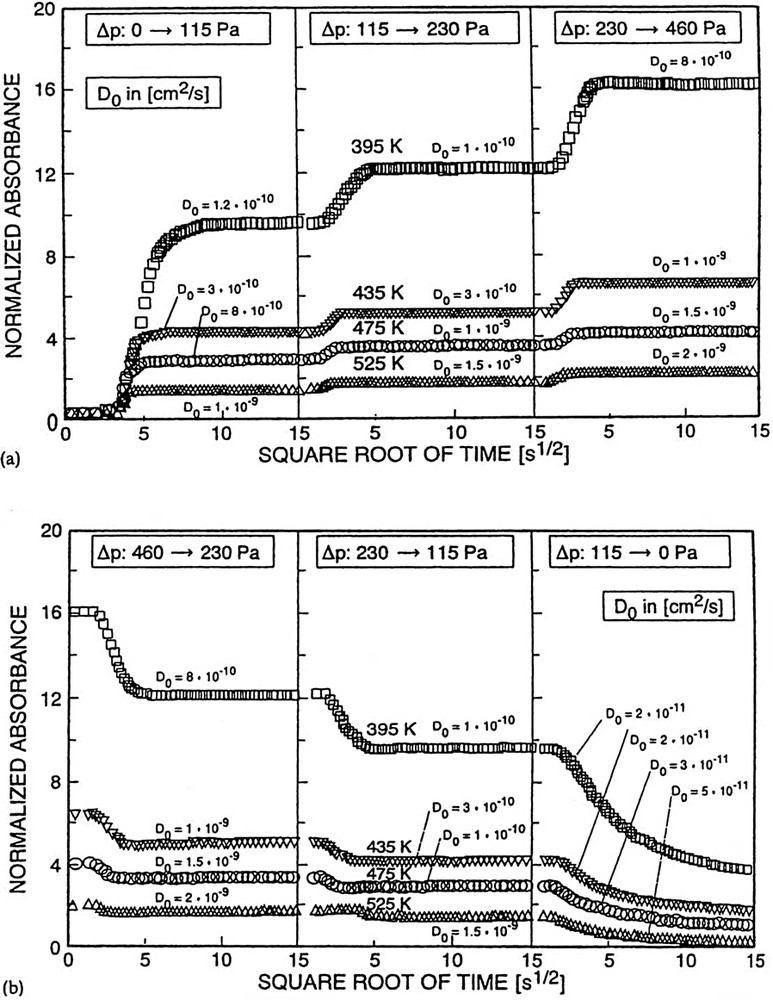
Curves showing reversible uptake (a, sorption and b, desorption) of pyridine into and out of silicalite yielding (corrected) diffusivities.
Except for the lowest pressure jump in desorption (Δp: 11.5 → 0 Pa), the diffusivities obtained are equal for both process directions, i.e. for adsorption and desorption. Deviations observed upon the last pressure jump in desorption are frequently encountered (vide supra and cf. [41,45,56]) and usually ascribed to the involvement of a few but rather strong sorption centers. The transport diffusivities, D, of pyridine in silicalite could be corrected via the Darken equation [49] to account for the coverage dependence and give the intrinsic diffusivities, D0. Remaining variations of D0s with the change in pressure (sorbate concentration) are either within the limits of error (cf., e.g., in Fig. 15a, ± 0.3 × 10⁻¹⁰ cm2 s–1 for 395 K and Δp: 0 → 115 Pa, Δp: 115 → 230 Pa) or partially due to inhomogeneities of the surface sites between which the sorbate molecules have to hop, the latter effect being observed especially for larger pressures (pressure jumps in adsorption Δp: 230 → 460 Pa) or low pressures in desorption (Δp: 115 → 0 Pa). In the latter case the deviations may be also ascribable to transport limitations in the vapor flow which are frequently more effective in desorption than in adsorption [63]. The diffusivities, D0, are very close to those measured for diffusion of benzene in the H-ZSM-5 sample (vide supra and cf. [45,51,53]). Thus, the strong base pyridine exhibits in silicalite a similar diffusion behavior as the weak base benzene (same size) in the stronger acidic H-ZSM-5 (same structure).
4.1.3.4 Sorption of pyridine into and desorption out of Li-ZSM-5 and Na-ZSM-5
Since the results of Sections 4.1.3.1 and 4.1.3.2 revealed the strong effect of the acidity of Brønsted or ‘true’ Lewis sites of H-zeolites on pyridine sorption and sorption kinetics, it appeared interesting to find out if and how weaker acidity, such as that of weak Lewis sites (cations), would affect uptake and diffusion of pyridine. Therefore, Li-ZSM-5 (sample No. 5) and Na-ZSM-5 (sample No. 6) were employed as sorbents for pyridine.
In fact, the mobility of pyridine in Li-ZSM-5 and Na-ZSM-5 was sufficiently high even at 525 K, so that reversible isotherms and isosteres were obtained [61]. Evaluation of the respective isosteres yielded the isosteric heats of adsorption, Qisost. In the case of Li-ZSM-5, Qisost was significantly dependent on the loading. Qisost was found to decrease from 195 to 153 kJ mol–1 upon an increase of the pyridine coverage from 0.12 to 0.16 mmol g–1. With Na-ZSM-5, the isosteric heat of adsorption of pyridine amounted to Qisost = 120 kJ mol–1. In both cases the isosteric heats of adsorption were higher than that of benzene in H-ZSM-5 (65 kJ mol–1, vide supra and cf. [51]) which points to a stronger interaction of the pyridine molecules with the sites where they reside between two jumps, (i.e. most probably the cations of Na-ZSM-5) compared to the interaction of benzene with the Brønsted centers (acid OH groups) of H-ZSM-5.
Fig. 16 displays the results of an uptake experiment of pyridine into Li-ZSM-5 at 575 K. It is evident that the experimental data (crosses) are well described by the solution of Fick's second law (cf. Eq. (4), fitted solid curve).
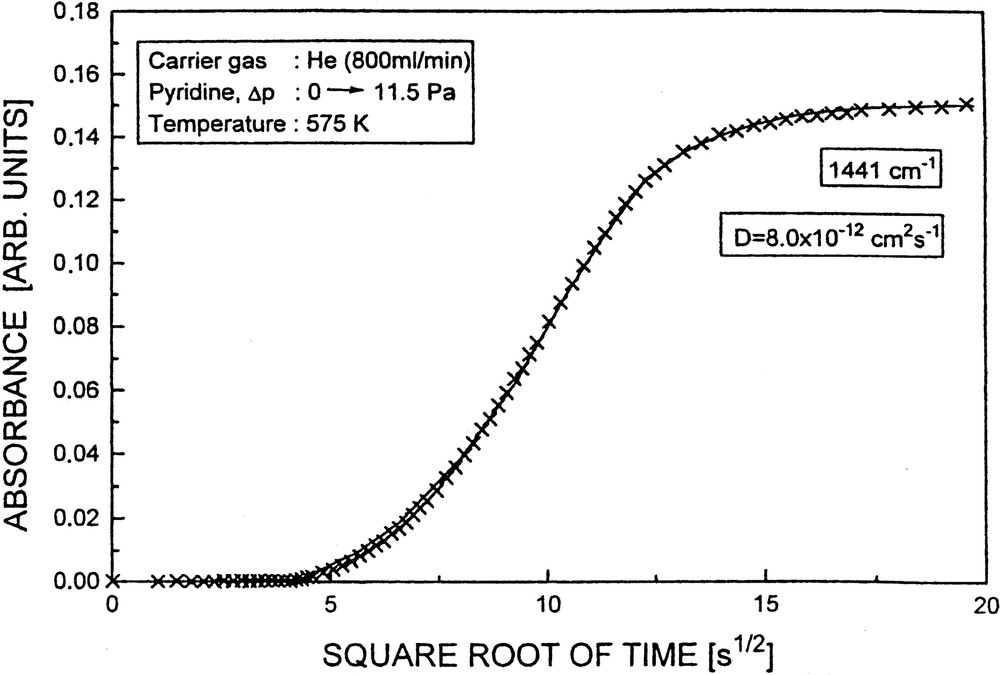
Uptake of pyridine into Li-ZSM-5 as a function of the square root of time monitored by the increase of the absorbance of the Py → Li band at 1443 cm–1 and described by a solution of Fick's second law (solid line).
The (non-corrected) coefficients of transport diffusion were determined as 8 × 10–12 and 6 × 10–12 cm2 s–1 for adsorption and desorption (Δp: 0 → 11.5 Pa and Δp: 11.5 → 0 Pa), respectively. The (non-corrected) diffusivities increased to 3 × 10–11 and 6 × 10–11 cm2 s–1 for pressure jumps Δp: 11.5 → 23.0 and 23.0 → 46.0 Pa, respectively. Fig. 17 demonstrates the complete reversibility of adsorption seen by reversing the uptakes (Δp: 11.5 → 23.0 Pa; 23.0 → 46.0 Pa), i.e. by decreasing the pyridine partial pressures accordingly (Δp: 46.0 → 23.0 Pa, 23.0 → 11.5 Pa).
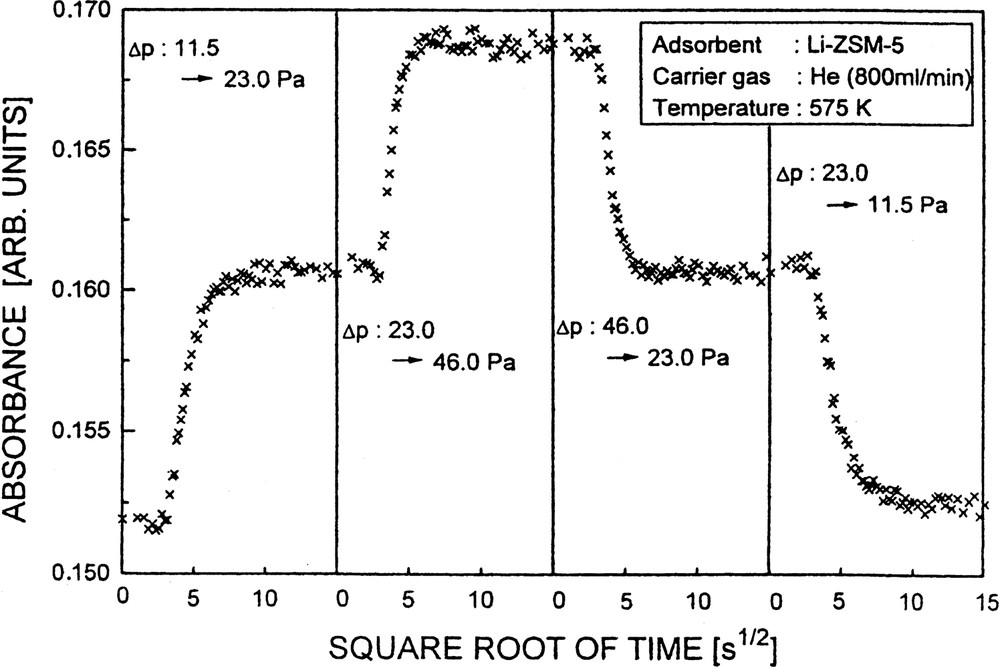
Curves showing reversible uptake (left, sorption, and right, desorption) of pyridine into and out of Li-ZSM-5.
In comparison with the case of Li-ZSM-5, the diffusivities obtained for Na-ZSM-5 at 575 K were slightly higher, e.g., D = 2 × 10–11 cm2 s–1 upon a pressure jump, Δp, from 0 to 11.5 Pa. Furthermore, the non-corrected D values for pyridine in Na-ZSM-5 were somewhat increased at higher pressures, e.g., from 3.8 × 10⁻¹¹ to 5.4 × 10⁻¹¹ cm2 s–1 upon Δp: 5.75 → 11.5 Pa and Δp: 11.5 → 23.0 Pa, respectively. The same phenomenon was encountered with almost all the systems investigated so far. (cf. [41,45,53]) and may be explained by the presence of a few relatively stronger sites which are operative in the transport at low pressures, i.e. upon the first pressure jump. Consequently, it is observed in desorption that the diffusivities derived from effect of the last pressure jump (to p = 0 Pa) are always somewhat lower.
4.2 Co- and counter-diffusion in binary mixtures of B, EB and p-X in H-ZSM-5
4.2.1 Co-diffusion
Since the IR spectra of B/H-ZSM-5, EB/H-ZSM-5 and p-X/H-ZSM-5 are sufficiently different (compare Figs. 3 and 9), it is possible to monitor the uptake of mixtures of these components. As an example, the simultaneous uptake of B and EB into H-ZSM-5 is shown as a function of the square root of time (Fig. 18). In that type of experiments, at zero time both components, B and EB, were simultaneously injected via partial gas streams into the main carrier gas flow: both components were, in the experiments of Fig. 18, subjected to a pressure jump from 0 to 1.15 mbar.
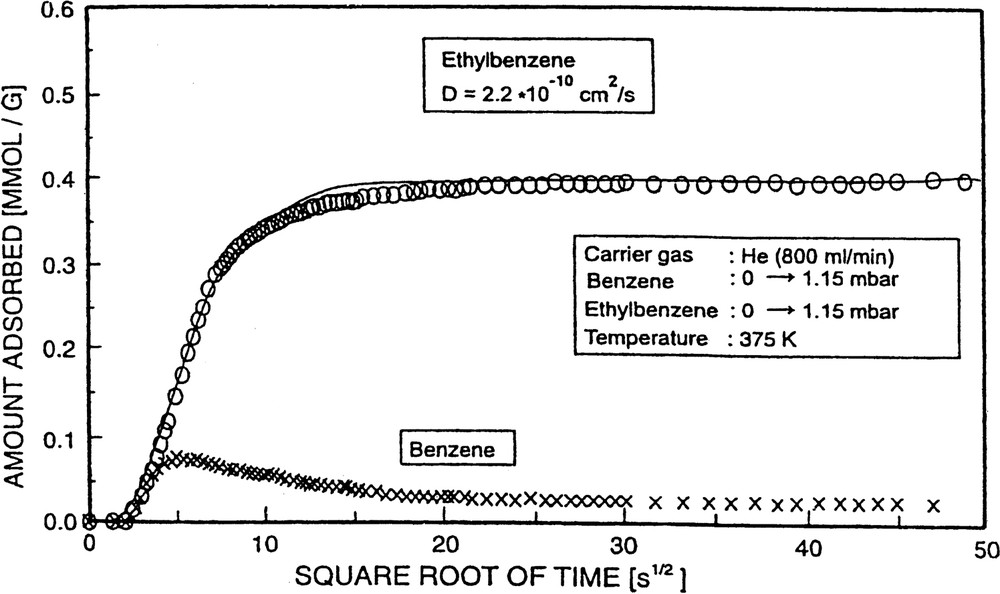
Co-diffusion of benzene and ethylbenzene.
Interestingly, the uptake of benzene went through a maximum (overshoot). This was expected from theoretical considerations [64,65], since D0(B) is somewhat higher than D0(EB), but Qisost(EB) is dominant, i.e. EB interacts more strongly with the sorbent than B (see Tables 2 and 6). Thus, B initially migrates more rapidly into the H-ZSM-5 pore system, but is subsequently replaced to some extent by more strongly adsorbed EB molecules. The diffusivities for the investigated cases of co-diffusion are incorporated in Table 6.
4.2.2 Counter-diffusion
As mentioned above, the IR features of B and EB, as well as B and p-X are sufficiently different to allow for a decomposition of superimposed bands of the mixtures B/EB and B/p-X in the ring deformation region (compare, e.g., Figs. 3 and 9). This enables us to monitor also counter-diffusion of these sorbates in zeolites (cf. [41,45,51,53]).
A counter-diffusion experiment using the novel IR technique is in principle conducted as follows. First, the component A is introduced until a steady state is reached. Then, the component B is injected by a pressure jump to the desired partial pressure. As a consequence, a fraction of component A is replaced and has to travel out of the pore system, thereby counter-diffusing with the in-going component B. One realizes for instance from Fig. 19, where the experiment started with a steady-state coverage of benzene (band at 1478 cm–1 with constant absorbance), a decrease of the benzene band upon admission of ethylbenzene (p(EB): 0 → 1.15 mbar). The result is, with respect to the uptake curves, the occurrence of an ascending branch of the component ethylbenzene and a descending branch of the component benzene until a new steady state is reached (mixture of ethylbenzene and benzene in the zeolite in equilibrium with the mixture of both components in the gas stream flowing through the adsorbent, Fig. 19).
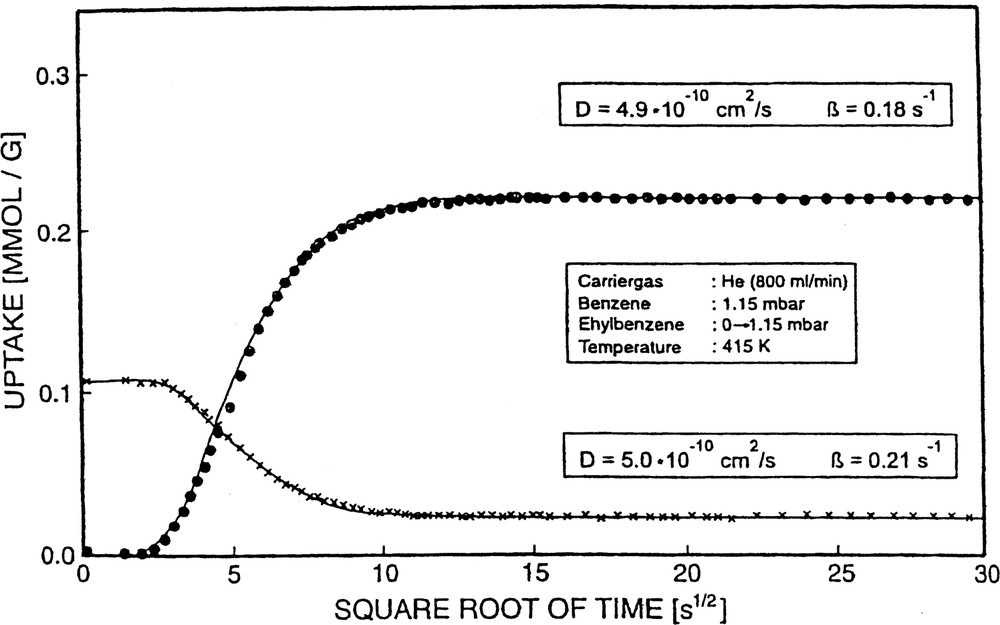
Counter-diffusion of ethylbenzene versus benzene in H-ZSM-5.
From these two branches, the diffusivities D(counter-diff.) of B and D(counter-diff.) of EB etc. were obtained via the same procedure as was followed for single-component diffusion and co-diffusion. The data obtained for this and the other two counter-diffusing sorbate pairs (B, p-X and EB, p-X) are also incorporated in the summarizing Table 6. In fact, one recognizes that under otherwise identical conditions, the diffusivities in the case of counter-diffusion are lower than those of single- component diffusion. The deviation, however, does not amount to orders of magnitude. In the currently investigated systems we found a decrease of the diffusivities by about 50–60%, when going from single-component diffusion to counter-diffusion. In exceptional cases the decrease reached one order of magnitude, most likely due to the presence of particularly strong interactions between the counter-diffusing species. As a general rule we found in the present cases D0 (single-component diffusion) > D0 (co-diffusion) > D0 (counter-diffusion).
5 Related FTIR measurements of diffusion in zeolites
Single-component diffusion of selected paraffins (n-hexane, neopentane, n-heptane and n-octane) was studied by the FTIR technique, too [66,67]. In these studies, Hermann et al. employed a micro-FTIR technique (frequently less precisely called ‘FTIR microscopy’), which allows experiments to be carried out with large single crystals (with dimensions of, e.g. 100 μm × 20 μm × 20 μm) in the case of H-ZSM-5 or small powder samples. A particular small flow-cell was used, which was a slightly modified design of the cell originally described by Novotny et al. [68]. The procedure und data evaluation was essentially the same as described above for conventional transmission FTIR experiments with self-supporting wafers. Diffusivities and activation energies of diffusion were determined. The results obtained with the above-indicated paraffins were generally in good agreement with those obtained by Square Wave Frequency Response (SW FR) Technique, [69], ZLC Technique [11], and Membrane Technique [70]. They differed, however, in particular in the case of n-hexane, from those reported for gravimetric [71] and Pulsed Field NMR [72] experiments.
The IR spectra of neopentane and n-hexane were sufficiently different, so that with this pair of paraffins also measurements of their counter-diffusion in H-ZSM-5 could be conducted [73]. The single-component diffusion coefficient of n-hexane in H-ZSM-5, which had been determined by micro-FTIR spectroscopy as D = 7 × 10⁻⁸ cm2 s–1, dropped in the counter-diffusion experiment with n-hexane vs. neopentane to 4.9 × 10⁻⁸ cm2·s–1.
Mirth and Lercher [74,75] extracted from time-resolved FTIR spectroscopic measurements diffusion coefficients of toluene (T) and xylenes (X) in H-ZSM-5. With toluene taken up at 320 K into single crystals of H-ZSM-5, these authors found D(T) ≈ (3.9–11) × 10–10 cm2 s–1, in reasonable agreement with related literature data obtained by different techniques. The diffusivities of p-X reported in [74,75] were in the order of 10–11–10–12 cm2s–1 and seemed to be too low. However, in later measurements [76] and under similar conditions, Lercher et al. arrived at D(p-X) ≈ 1.5 × 10⁻⁹ cm2s–1, which is very close to the value given in Table 6.
More recently, Zhobolenko and Dwyer [77] applied successfully the micro-FTIR technique to determine transport diffusivities of a number of hydrocarbons (benzene, toluene, p-xylene, cyclohexane) in large silicalite crystals. The obtained diffusion coefficients were close to data arrived at by Karge and co-workers [41,45,51,53] or other authors using different methods.
Also, Roque-Malherbe et al. [78,79] employed the FTIR method described in the present contribution for the investigation of diffusion and counter-diffusion in zeolites. These authors studied the kinetics of adsorption and desorption using benzene and o-xylene as adsorbates and H-MCM-22, H-ZSM-5 and H-Beta as sorbents.
Finally, the work by Jamis et al. [80] should be mentioned. These authors employed the FTIR technique in studying the kinetics of uptake of hydrogen cyanide into synthetic zeolites Y, Beta and mordenite as well as natural clinoptilolite, ferrierite and stilbite.
6 Concluding remarks
The very good agreement of the diffusivities of benzene in H-ZSM-5 with those obtained by various independent techniques confirms the reliability of the novel FTIR method. This is further supported by the good agreement between the activation energies of diffusion and the isosteric heats of adsorption of benzene, ethylbenzene, and p-xylene as derived from FTIR data on the one hand and the pertinent literature data on the other. For benzene, ethylbenzene and p-xylene in MFI structures, it seems to be a rule that D0 (single-component diffusion) > D0 (co-diffusion) > D0 (counter-diffusion). The difference between D0 (single-component diffusion) and D0 (counter-diffusion) amounts, however, only to about 50–60% and not to orders of magnitude as sometimes claimed in the literature. Sorption and sorption kinetics of pyridine and similarly strong bases in non-acid or weakly acid forms of zeolites with MFI structure are as easily studied by FTIR as sorption and sorption kinetics of weak bases in acid zeolites. But in acidic forms of zeolites, the sorption kinetics of strong bases can be investigated by any technique only if the temperature during the uptake is sufficiently high to avoid immobilization of the sorbate molecules. It is expected that the application of the FTIR method for investigation of sorption and sorption kinetics in microporous sorbents will be further extended, in particular in view of the potential in studying co- and counter-diffusion in zeolites and related materials. This will be certainly stimulated by progress in the experimental equipment and procedures as well in data evaluation.
Acknowledgements
The author wishes to acknowledge gratefully the contribution of his co-workers and colleagues, especially those by Dr. Wilhelm Niessen, Dr. Linda Josefowicz-Hilton, Dipl.-Phys. Michael Hermann, Dr. Horst Bludau, Dr. Richard Schumacher and Dr. Peter Lorenz.