

1 Introduction
The luminescence arising from the f-f transitions of lanthanide ions makes these ions attractive for a variety of applications, including sensing, bioimaging, fluoroimmunoassays and LEDs [1,2]. Since the f-f transitions are forbidden, the population of the emissive lanthanide-ion centered state is achieved through the antenna effect. For an efficient effect, the lanthanide ion is coordinated to one or more ligands or antennas capable of absorbing light. The sensitizing ligand's singlet state is easily populated through energy absorption. This singlet state undergoes intersystem crossing to populate a long-lived triplet state, which can then transfer energy to the coordinated lanthanide ion [3]. The quest for efficient sensitizers for a large variety of applications is ongoing [3–6]. While known for a while as a ligand for lanthanide ion complexes used in asymmetric catalysis [7–14], only recently was pyridine-bis(oxazoline) (Pybox) screened as a sensitizer or antenna for the visible emitting Eu(III) and Tb(III) ions [15]. In its role as a sensitizer, Pybox was derivatized with thiophen-3-yl at the para position of the pyridine ring to yield PyboxTh. This ligand proved to be an excellent sensitizer of lanthanide ion luminescence, with an emission efficiency of 78% observed for Eu(III) and 56% for Tb(III). Isolation of a metal complex with this ligand showed the formation of a 2:1 ligand-to-metal ion species. An oxazoline-derivatized Pybox is described in this manuscript, dimethyl-2,2′-(pyridine-2,6-diyl)bis(4,5-dihydrooxazole-4-carboxylate), bMePybox, which has shown to be an efficient sensitizer. This molecule has been previously described as a ligand in Ru(II) catalyzed asymmetric epoxidation of olefins [16], in asymmetric cycloadditions of diones and alkyl diazopyruvates to enol ethers [17], as well as a synthetic host for the highly selective recognition of adenine nucleobases [18]. Here, the potential of this molecule as a coordinating ligand for lanthanide ions and its sensitization ability of the f-f emission is presented for the first time. In addition to photophysical characterization of solutions of bMePybox and Eu(III) and Tb(III), a solid was also obtained. This solid could be characterized by single crystal X-ray crystallography, showing the formation of a 1:1 complex dimer. Its structure is described.
2 Experimental section
All commercially purchased chemicals were used as received. Solvents were dried by standard methods. Lanthanide ion salts were dried under reduced pressure and heating and stored in a controlled atmosphere Vacuum Atmospheres Nexus glove box (O2 < 0.2 ppm, H2O < 3 ppm). Unless otherwise specified, all reactions were carried out under inert atmosphere using standard Schlenk line technique.
Compounds a and 1 (Scheme 1) were prepared as reported in the literature, with modified purification procedures [18–20].
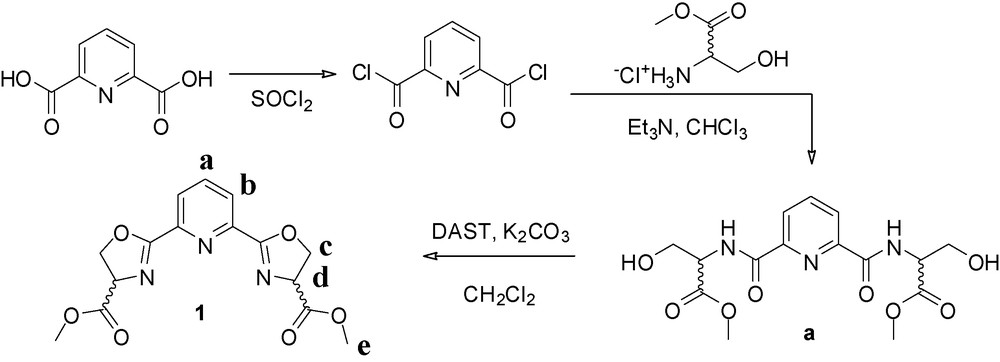
Synthetic pathway for the ligand bMePybox, 1 [19,20].
3-Hydroxy-2-{[6-(2-hydroxy-1-methoxycarbonyl-ethylcarbamoyl)-pyridine-2-carbonyl]-amino}-propionic acid methyl ester (a): the material was purified by gradient flash chromatography (6% MeOH/CHCl3 → 20% MeOH/CHCl3 on silica) to give 4.08 g of an off-white solid. Yield = 62%. 1H-NMR (400 MHz, CDCl3) δ 8.82 (t, 3J = 7.3 Hz, 2H), 8.12 (m, 2H), 7.82 (m, 1H), 4.86 (m, 2H), 4.12 (m, 4H), 3.81 (d, 3J = 3.4 Hz, 6H).
Dimethyl 2,2′-(pyridine-2,6-diyl)bis(4,5-dihydrooxazole-4-carboxylate) (1): the crude oil synthesized according to the literature was recrystallized from EtOH to give 220 mg of a white solid. Yield = 11.5%. 1H-NMR (500 MHz, CDCl3) δ 8.25 (d, 3J = 7.9 Hz, 2H, b), 7.89 (t, 3J = 7.9 Hz, 1H, a), 5.00 (dd, 3J = 10.8 Hz, 8.5 Hz, 2H, c), 4.78 (t, 3J = 8.5, 2H, d), 4.69 (dd, 3J = 10.8 Hz, 8.5 Hz, 2H, c), 3.79 (s, 6H, e). 13C-NMR (126 MHz, CDCl3) δ 170.97, 164.81, 146.11, 137.55, 126.67, 70.39, 68.60, 52.77.
2.1 Synthesis of the metal complex [bMePyboxTb(NO3)3]2·2CH3CN·2O(CH2CH3)2
The metal complex was prepared by mixing a stoichiometric amount of ligand and Tb(NO3)3 in acetonitrile. After refluxing for one hour, the solvent was removed, and a minimum amount of acetonitrile was added to provide a saturated solution. The solution was filtered and slow vapor diffusion with diethyl ether yielded X-ray quality single crystals within a few days. Only a few crystals were isolated and no effort was made at isolating bulk quantities of this complex, thus no yield is indicated.
2.2 X-ray crystallographic characterization
Crystal data, data collection and refinement details for the metal complex are given in Table 1. Selected bond lengths and angles are given in Table 2. Suitable crystals were mounted on a glass fiber and placed in the low-temperature nitrogen stream. Data were collected on a Bruker SMART CCD area detector diffractometer equipped with a low-temperature device, using graphite-monochromated Mo-Kα radiation (λ = 0.71073 Å). Data were measured using a strategy combining omega and phi scans of 0.3° per frame and an acquisition time of 10 s per frame. Multi-scan absorption corrections were applied. Cell parameters were retrieved using SMART [21] software and refined using SAINTPlus [22] on all observed reflections. Data reduction and correction for Lp and decay were performed using the SAINTPlus [22] software. Absorption corrections were applied using SADABS [23]. The structure was solved by direct methods and refined by least square methods on F2 using the SHELXTL [24] program package. All atoms were refined anisotropically. The hydrogen atoms were added geometrically and their parameters constrained to the parent site. The X-ray crystallographic information file can be obtained free of charge via http://www.ccdc.cam.ac.uk/conts/retrieving.html (or from the CCDC, 12 Union Road, Cambridge CB2 1EZ, UK; fax: +44 1223 336033; e-mail: deposit@ccdc.cam.ac.uk). CCDC 758509 contains the supplementary crystallographic data for the metal complex described here.
Crystallographic parameters for the 1:1 complex dimer [bMePyboxTb(NO3)3]2·2CH3CN·2O(CH2CH3)2.
| CCDC number | 758509 | |
| Empirical formula | C38H36N14O31Tb2 | |
| Formula weight | 1502.65 | |
| Temperature | 99(2) K | |
| Wavelength | 0.71073 Å | |
| Crystal system | Triclinic | |
| Space group | P-1 | |
| Unit cell dimensions | a = 9.6167(2) Å | α = 70.026(1)̊ |
| b = 11.6786(2) Å | β = 83.219(1)̊ | |
| c = 12.7548(3) Å | γ = 81.973(1)̊ | |
| Volume | 1329.31(5) Å3 | |
| Z | 1 | |
| Density (calculated) | 1.877 Mg/m3 | |
| Absorption coefficient | 2.749 mm−1 | |
| F(000) | 740 | |
| Crystal size | 0.13 × 0.10 × 0.09 mm3 | |
| Theta range for data collection | 1.70 to 25.50° | |
| Index ranges | −11 ⇐ h ⇐ 11, −14 ⇐ k ⇐ 14, −15 ⇐ l ⇐ 15 | |
| Reflections collected | 27,565 | |
| Independent reflections | 4916 [R(int) = 0.0244] | |
| Completeness to θ = 25.50° | 99.2% | |
| Data/restraints/parameters | 4916/0/394 | |
| Goodness-of-fit on F2 | 1.104 | |
| Final R indices [I > 2sigma(I)] | R1 = 0.0223, | |
| Largest diff. peak and hole | 0.740 and −0.779 e.Å−3 |
Selected bond distances for the 1:1 complex dimer [bMePyboxTb(NO3)3]2·2CH3CN·2O(CH2CH3)2.
| Atoms | d [Å] |
| Tb(1)-O(15) | 2.428(2) |
| Tb(1)-O(2)#1 | 2.447(2) |
| Tb(1)-O(9) | 2.457(2) |
| Tb(1)-O(13) | 2.462(2) |
| Tb(1)-O(10) | 2.465(2) |
| Tb(1)-O(7) | 2.466(2) |
| Tb(1)-O(12) | 2.526(2) |
| Tb(1)-N(1) | 2.550(3) |
| Tb(1)-N(3) | 2.566(3) |
| Tb(1)-N(2) | 2.624(3) |
| Tb(1)-N(6) | 2.869(3) |
| Tb(1)-N(4) | 2.886(3) |
2.3 Determination of stability constants
All solutions were prepared in a glove box with controlled atmosphere (O2 < 0.2 ppm, H2O < 3 ppm) in analytical grade acetonitrile at constant ionic strength, I = 0.1 M, using Et4NCl. Stock solutions of lanthanide nitrates at 0.005 M were prepared by dissolving appropriate quantities of dry Ln(NO3)3 [Ln = Eu(III), Tb(III)] in analytical grade dry acetonitrile. The solutions were standardized by titration with a standardized solution of ethylenediaminetetraacetic acid using xylenol orange as an indicator in hexamine buffered solutions [25]. The stock solution of the ligand was prepared at 0.01 M concentration in dry acetonitrile. For titrations and photophysical measurements, these stock solutions were diluted as needed.
In a typical experiment 25 ml of 1 × 10⁻⁴ M ligand was titrated against standardized metal nitrate solution, under argon. After each addition of the metal ion and an equilibration delay of five minutes, the absorption or emission spectrum was measured. Each titration run had 30 data points to allow for a good fitting. It was also ensured that a wide range of ligand-to-metal ion stoichiometric ratios was considered. Refinement of stability constants was performed using the HYPERQUAD2006 [26] software package.
All data presented are the average of at least three independent measurements.
2.4 Photophysical characterization
Solutions for spectroscopic studies were prepared by mixing the ligands with the lanthanide nitrate in acetonitrile in 2:1 stoichiometry at a final concentration of 1 × 10⁻⁴ M. Absorption spectra were measured on a Perkin Elmer Lambda 35 spectrometer and excitation and emission spectra on a Perkin Elmer LS-55 fluorescence spectrometer. For absorption measurements, a slit width of 2 nm and a scan speed of 480 nm/min were used. Excitation and emission measurements were made in the phosphorescence mode with a delay of 0 ms, a cycle time of 16 ms, a gate time of 0.05 ms and a flash count of 1. Slit widths were 5 and/or 10 nm and a scan rate of 250 nm/sec was used. The solutions for all the photophysical measurements were allowed to equilibrate for 2–3 hours before measurements. For quantum yield measurements, both the absorption and emission/excitation spectra were measured using 0.2 cm path length cells, with the emitted light at a right angle and along the long path length (1 cm). All measurements except the triplet-state measurements were performed at 25.0 ± 0.1 °C. The triplet-state measurements were performed at 77K, as described by Crosby et al. [27]. All emission and excitation spectra were corrected for instrumental function.
Quantum yields were calculated using the following equation: [28]
2.5 1H-NMR spectroscopy
1H-NMR spectra were acquired on a Varian Unity-Plus 500-MHz NMR spectrometer. The solutions were prepared by mixing appropriate stoichiometric amounts of ligand and La(CF3SO3)3 in 2:1 or 1:1 ligand-to-metal ratios. The solids were then dried overnight under vacuum at 50 °C and subsequently transferred to the glove box. The samples were then dissolved in CD3CN and filtered into the NMR tubes to give a ∼20 mM concentration. The spectra were taken immediately. After the solutions had equilibrated for 24 hours, the 1H-NMR spectra were recorded again to reveal no change.
2.6 (+)ESI-MS
Electrospray ionization mass spectra (ESI-MS) were collected in positive ion mode on a Waters Micromass ZQ quadrupole mass spectrometer. The samples were prepared by diluting the solutions utilized for NMR spectroscopy to a concentration of ∼1 mg/mL with acetonitrile. In the case of the spectrum obtained from crystals initially grown for X-ray crystallography, these were dissolved in acetonitrile to give a solution of ∼1 mg/mL concentration. All samples were filtered through a 0.2-μm syringe filter before injecting into the mass spectrometer.
3 Results and discussion
The ligand studied here, dimethyl-2,2′-(pyridine-2,6-diyl)bis(4,5-dihydrooxazole-4-carboxylate), bMePybox, 1, was synthesized as a mixture of the (S,S), (R,R) and (R,S) isomers, following literature procedures [19,20], as shown in Scheme 1. Chelidamic acid was treated with thionyl chloride to yield the acid chloride, which, without purification, is added to (D,L)-serine methyl ester hydrochloride to yield the corresponding amide a. Cyclization with DAST in the presence of base yields the targeted compound. After purification by flash chromatography, 1 was obtained in 7% overall yield from chelidamic acid. Refluxing the ligand with Tb(NO3)3 in acetonitrile, followed by removal of the solvent, dissolution of the solid residue in a minimum amount of acetonitrile and slow evaporation in a diethyl ether diffusion chamber yielded X-ray quality crystals within a few days. The structure of the isolated complex, with the formula [bMePyboxTb(NO3)3]2·2CH3CN·2O(CH2CH3)2, is shown in Fig. 1a. Details of the crystallographic characterization are summarized in Table 1.
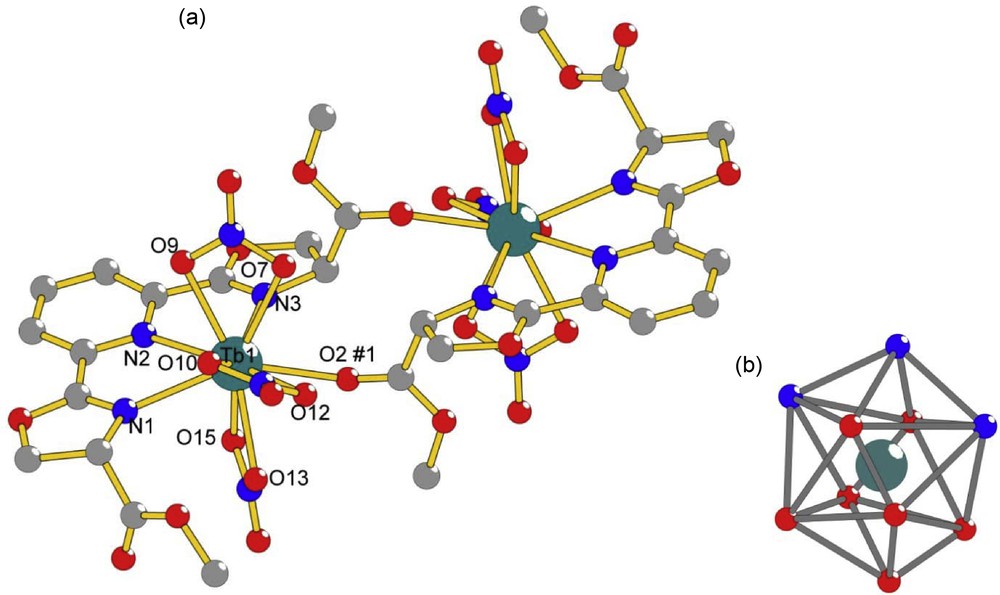
a: Ball-and-stick diagram of the 1:1 complex dimer [bMePyboxTb(NO3)3]2·2CH3CN·2O(CH2CH3)2 with selected atoms labeled. Symmetry transformations used to generate equivalent atoms are #1 −x, 1−y, 1−z. Selected bond distances [Å] are Tb1-N1 2.550, Tb1-N2 2.624, Tb1-N3 2.566, Tb1-O2#1 2.447, Tb1-O7 2.466, Tb1-O9 2.457, Tb1-O10 2.465, Tb1-O12 2.526, Tb1-O13 2.462, Tb1-O15 2.428; b: distorted bicapped square antiprism coordination polyhedron around Tb1. Hydrogen atoms and solvent molecules of crystallization were omitted for clarity.
As can be seen in Fig. 1a, the isolated complex has a dimeric structure, with two Tb(III) ions related by inversion. Each ion is coordinated to one bMePybox ligand through the nitrogen atoms of the pyridine and the oxazoline rings as well as through one ester oxygen atom of the bMePybox ligand on the other metal ion. The coordination sphere of each individual Tb(III) is completed by three nitrate ions for a total coordination number of 10. The coordination polyhedron, shown in Fig. 1b, can be best described as a distorted bicapped square antiprism. The Tb-N distances, summarized in Table 2, are in the range 2.550–2.624 Å and the Tb-O distances, also in Table 2, are in the range 2.447–2.526 Å. These are within the ranges observed for other Pybox complexes of lanthanide ions [12,15,30].
In addition to the dimer, solvent molecules (not shown) also crystallize in the unit cell. These are two acetonitrile and two diethyl ether molecules. The diethyl ether molecules are disordered, since two molecule positions, mirror images of each other, are possible. In addition, the oxygen atom is situated on an inversion center and half the molecule is generated through symmetry. The acetonitrile and diethyl ether molecules are in close contact with the complex dimer, with the packing structure of the molecule being supported by weak hydrogen bonding interactions [31] between C-H donor atoms and either O or N acceptor atoms. The weak hydrogen bonding interaction distances are in the range 2.30–2.59 Å and are summarized in Table 3.
Bond distances and angles of the weak hydrogen bonding interactions between donor atoms C-H and acceptor atoms A supporting the packing structure of the 1:1 complex dimer [bMePyboxTb(NO3)3]2·2CH3CN·2O(CH2CH3)2.
| C-H····A | C-H····A [Å] | C····A [Å] | C-H····A [°] |
| C(3)-H(3)····O(7) | 2.30 | 3.176(4) | 146 |
| C(4)-H(4A)····N(7) | 2.55 | 3.073(7) | 113 |
| C(4)-H(4A)····O(12) | 2.57 | 3.020(4) | 107 |
| C(4)-H(4B)····O(16) | 2.59 | 3.488(4) | 151 |
| C(8)-H(8)····O(14) | 2.54 | 3.331(5) | 141 |
| C(9)-H(9)····O(15) | 2.55 | 3.151(4) | 122 |
| C(13)-H(13)····O(10) | 2.53 | 3.218(4) | 125 |
| C(15)-H(15B)····O(8) | 2.54 | 3.441(5) | 152 |
| C(17)-H(17A)····O(14) | 2.46 | 3.330(8) | 148 |
| C(17)-H(17C)····O(8) | 2.57 | 3.391(8) | 142 |
This dimer complex with the 1:1 ligand-to-metal ion stoichiometry and the bridging methyl ester moieties is thus far the only one which has been isolated for bMePybox with lanthanide ions. A different and more varied coordination chemistry is present in solution. Dissolution of some of the crystals isolated for X-ray crystallography and analysis of their acetonitrile solution by (+)ESI-MS resulted in the spectrum shown in Fig. 2. The molecular ion peak, corresponding to a species with the formula [(bMePybox)Tb(NO3)2]+, is seen at 616.37 amu. Two additional prominent peaks are found for the protonated free ligand as well as free ligand with sodium ion at 334.45 and 356.47 amu, respectively. Peaks corresponding to dimer species, such as [(bMePybox)2Tb2(NO3)5]+ (1293.98 amu), [(bMePybox)2Tb2(NO3)3]3+ (390.00 amu) or [(bMePybox)2Tb2(NO3)]5+ (209.29 amu), could not be detected. This supports the conclusion that the dimer is only present in the solid state and yields monomeric species in solution. Finally, a small peak at 274.4 amu points to the possible formation through ligand redistribution in solution of the 2:1 species, [(bMePybox)2Tb]+ (calc. 275.17 amu). Unfortunately, not enough material was available to also make NMR measurements on the dissolved crystals.

(+)ESI-MS of an acetonitrile solution of crystals of [bMePyboxTb(NO3)3]2·2CH3CN·2O(CH2CH3)2 grown for X-ray crystallography.
The formation of 2:1 species is further supported by the mass spectra of solutions containing a 2:1 stoichiometry of ligand to metal ion, as shown in Fig. 3. Here, the mass spectrum of La(CF3SO3)3 in the presence of a two-fold excess of bMePybox is displayed. La(CF3SO3)3 was utilized as the source of lanthanide ion, as this solution was also utilized for NMR spectroscopy (vide infra), due to the low solubility of any other lanthanide nitrate salts in acetonitrile.
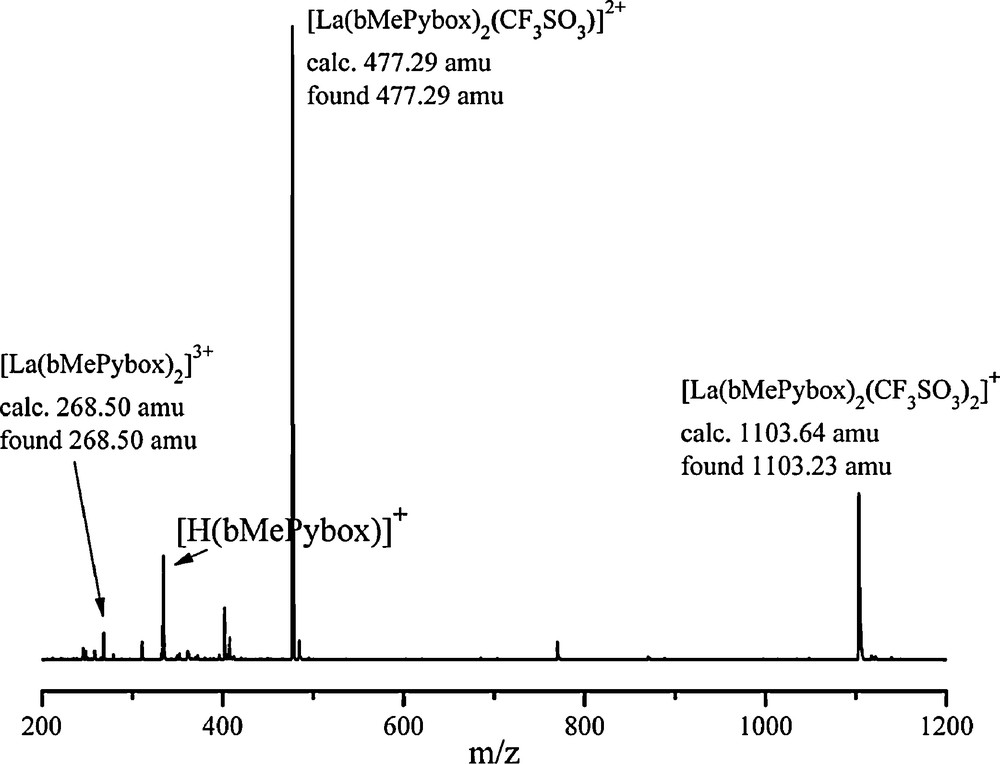
(+)ESI-MS of a solution of La(CF3SO3)3 and bMePybox with a 2:1 ligand-to-metal ion stoichiometry in acetonitrile.
In this spectrum, a molecular ion peak at 1103.23 amu is consistent with the species [La(bMePybox)2(CF3SO3)2]+ and two more peaks at 477.29 amu and 268.50 amu are seen for species containing La(III) and two bMePybox ligands, with one coordinated CF3SO3− or no triflates, respectively.
The formation of two species is also seen in preliminary studies made by 1H-NMR spectroscopy. Fig. 4 displays the 1H-NMR spectra of ligand alone and in the presence of La(III) as the triflate salt in CD3CN with 2:1 and 1:1 ligand-to-metal ion stoichiometries. Due to the racemic nature of the ligand, and the slow exchange on the NMR time scale, several species are observed in solution and the chemical shifts observed are difficult to assign unambiguously. However, the spectra obtained seem to be consistent with the formation of two different complexes, one with a 2:1 stoichiometry and one with a 1:1 stoichiometry. The ligand alone (bottom trace) displays a simple pattern for all the protons, including a singlet for the methyl protons of the methyl ester moieties, a doublet and a doublet of doublets for the aromatic protons and doublets of doublets for the oxazoline protons. In the solution with the 2:1 stoichiometry, a much more complicated spectrum emerges, the simplest part of it corresponding to the methyl protons. The four signals of the methyl protons seen in the 3.4–3.9 ppm range are consistent with seven species with different pair wise combinations of (S,S), (R,R) and (R,S) ligands, such as two ligands with (S,S) stereochemistry on one metal ion and the equivalent complex with two ligands with (R,R) stereochemistry and a distinct species with one (R,R) and one (S,S) ligand. A similar situation is encountered in the case of the solution with the 1:1 stoichiometric mixture of La(III) and bMePybox. In this case, since only one ligand is present on the metal ion, two possible signals are seen in the methyl region, depending on the stereochemistry of the ligand coordinated to the metal ion.
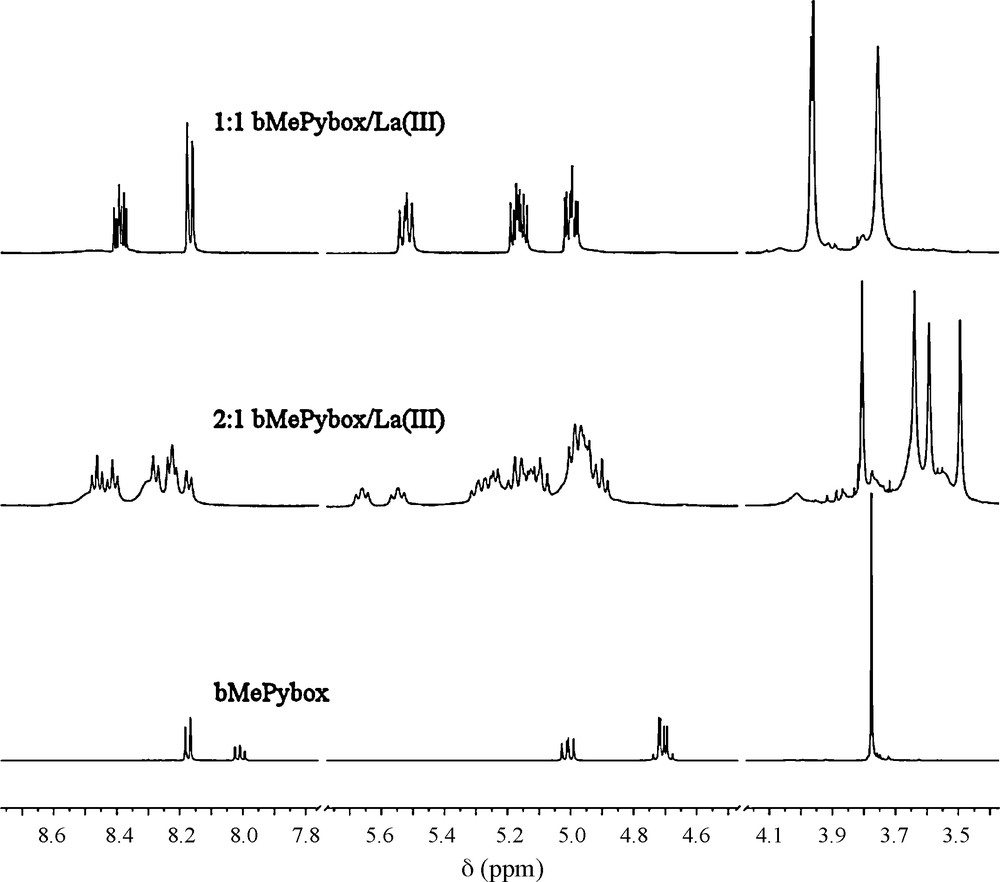
1H-NMR spectra of the ligand (bottom trace) and of solutions with 2:1 (middle) and 1:1 (top) ligand-to-metal ion stoichiometry taken with La(III) as the triflate salt in CD3CN.
The correct assignment of the resonances of the species in acetonitrile solution is currently being investigated through 2D NMR spectroscopy both on the existing compounds as well as on solutions of complexes with the pure ligand enantiomers. The synthesis of these ligands is currently underway.
The presence of different stoichiometries in solution prompted further speciation studies. These were performed through absorption and emission titrations. In the case of absorption titrations, a solution of ligand was titrated with Eu(III) or Tb(III) in acetonitrile at constant ionic strength. The representative titration with absorption spectra for Eu(III) is shown in Fig. 5. The initial trace, which corresponds to the absorption of a solution of ligand alone, shows one absorption maximum at 282 nm. Upon addition of aliquots of Eu(III), this peak decreases in intensity, while the intensity below ∼275 nm and above ∼300 nm increases. Two isosbestic points are present, with three possible absorbing species in solution, which indicates that the absorption behavior of all three species is correlated [15,32].
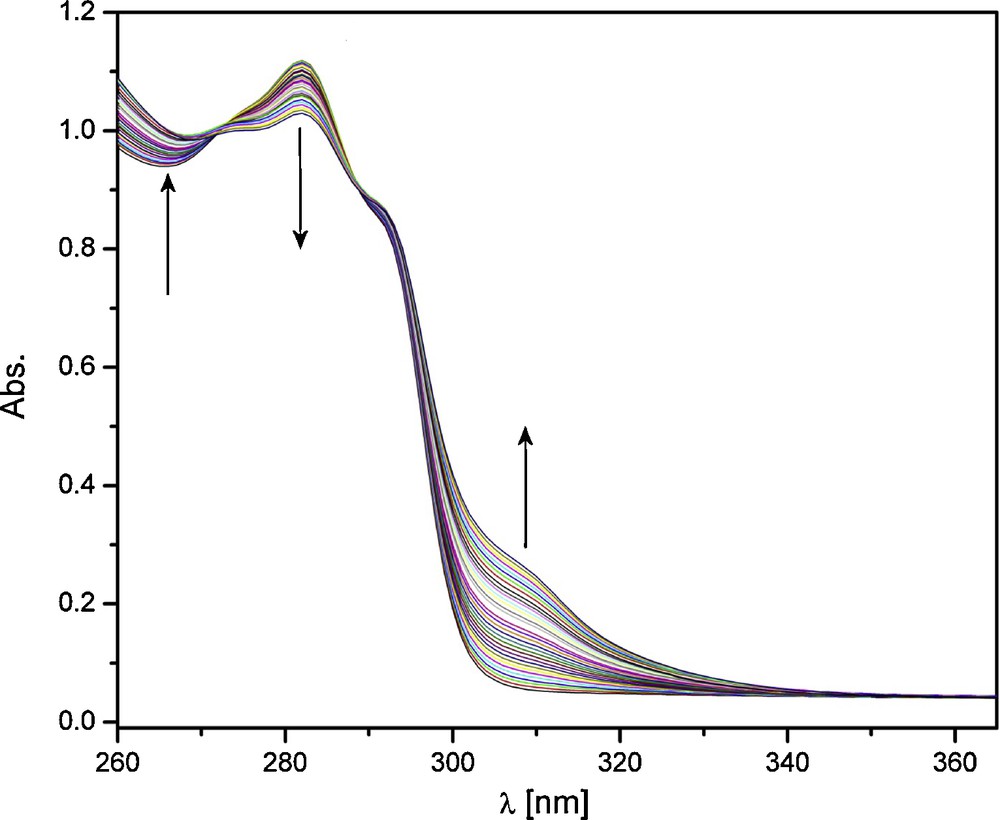
Absorption titration of ligand with Eu(III). [L]ini = 1 × 10⁻⁴ M, [Eu(III)] = 5 × 10⁻³ M, Eu(III) as the nitrate salt in acetonitrile with I = 0.1 M (Et4NCl).
Fluorescence titrations were also performed. An example, for the solutions with Tb(III), is shown in Fig. 6. The initial trace corresponds to the ligand alone, which does not emit appreciably in the region scanned. Upon addition of aliquots of Tb(III), an increase in emission intensity is seen, to yield the characteristic emission spectrum of this ion. Factor analysis of both absorption and emission titrations with the HYPERQUAD2006 [26] software package allowed fitting the stability constants for two species with 2:1 and 1:1 ligand-to-metal ion stoichiometry.

Fluorescence titration of ligand with Tb(III). [L]ini = 1 × 10⁻⁴ M, [Tb(III)] = 5 × 10⁻³ M, Tb(III) as the nitrate salt in acetonitrile with I = 0.1 M (Et4NCl).
The determined stability constants, which are an average of at least three independent measurements for each technique, are summarized in Table 4. For the 1:1 species, average stability constants of 3.66 ± 0.41 for Eu(III) and 3.56 ± 0.41 for Tb(III) were determined while for the 2:1 species, average stability constants of 6.16 ± 0.37 for Eu(III) and 6.21 ± 0.38 for Tb(III) were measured. The stability constants are smaller than those obtained for PyboxTh. For PyboxTh, for the 1:1 and 2:1 species with Eu(III) stability constants of 5.43 and 10.40, respectively, were determined. For Tb(III) stability constants of 4.88 and 9.10 for the 1:1 and 2:1 species, respectively, were determined [15]. In addition, for PyboxTh the formation of a 3:1 species was seen, which is absent for the bMePybox ligand. We cannot exclude that the mixture of ligand isomers is responsible for preventing the formation of the 3:1 species. However, we believe that these data are also consistent with the more bulky nature of the bMePybox ligand, due to the derivatized oxazoline rings. This results in a more crowded coordination environment, smaller stability constants and thus the lack of a 3:1 stoichiometry, despite the large radii of the lanthanide ions. As previously mentioned, the synthesis of pure enantiomers is currently underway and should help shed light on this issue.
Stability constants obtained through absorption and fluorescence titrations as well as average stability constants for solutions of bMePybox and Eu(III) or Tb(III) as the nitrate salts in acetonitrile at constant ionic strength (I = 0.1 M Et4NCl).
| L:M | log β Abs. | log β Fluor. | Average log β |
| Eu 1:1 | 3.40 ± 0.76 | 3.91 ± 0.29 | 3.66 ± 0.41 |
| Eu 2:1 | 6.19 ± 0.23 | 6.13 ± 0.70 | 6.16 ± 0.37 |
| Tb 1:1 | 3.12 ± 0.31 | 3.99 ± 0.76 | 3.56 ± 0.41 |
| Tb 2:1 | 6.26 ± 0.41 | 6.15 ± 0.64 | 6.21 ± 0.38 |
During purification of the ligand, a faint blue emission could be observed under the light of a handheld UV lamp (λ = 254 nm). The absorption, excitation and emission spectra of an acetonitrile solution of the ligand bMePybox are thus depicted in Fig. 7.
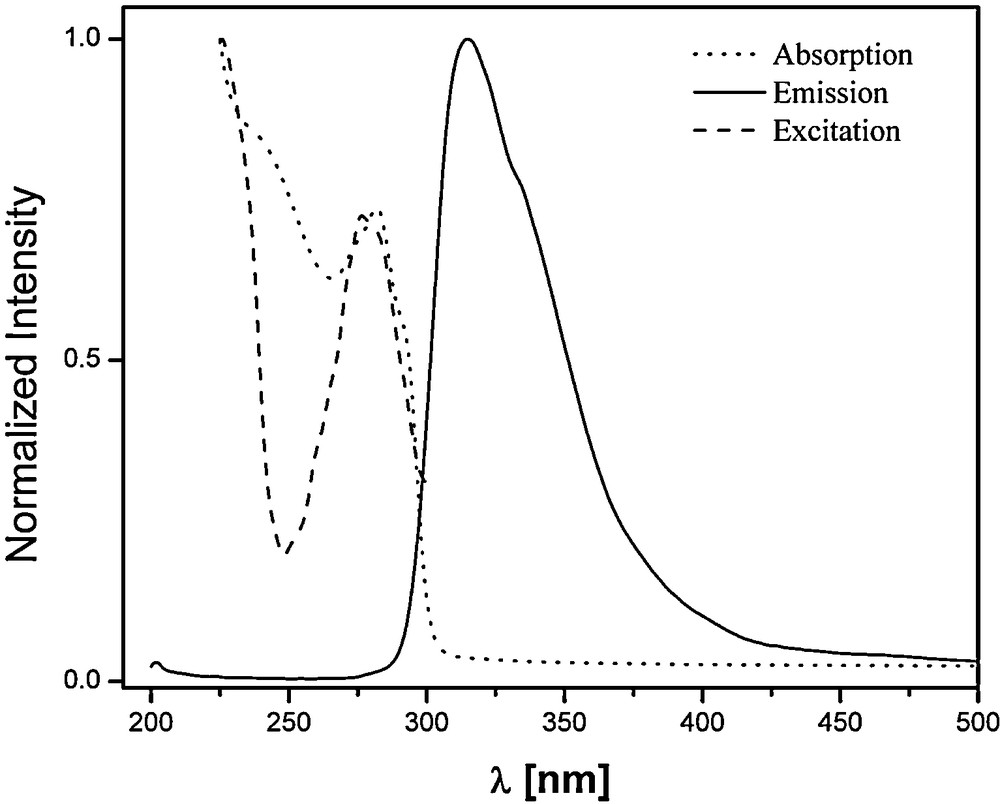
Absorption (····), excitation (- - - -) and emission (––) of bMePybox in MeCN.
The absorption spectrum shows the maximum absorption at 282 nm, while the excitation maximum, with emission monitored at 315 nm, is seen at 276.5 nm. The emission, with the excitation wavelength at 277 nm, reaches its maximum at 315 nm. A similar solution prepared in the presence of Gd(III) allows determination of the energies of singlet and triplet states of the ligand in the complex [27]. These data are summarized in Table 5. The singlet state of the ligand is located at 33,890 cm−1. This value is significantly higher than the singlet state of PyboxTh, located at 28,310 cm−1 [15]. The triplet state of bMePybox is located at 26,920 cm−1, also significantly higher than the triplet state of PyboxTh, at 21,080 cm−1 [15]. Despite the high energy of the singlet and triplet states, both the solid isolated as well as all solutions used in this study were highly luminescent and thus photophysical characterization of solutions with 2:1 stoichiometry was performed. As the nitrate salts were utilized for the speciation studies, these same salts were also utilized here.
Energies of singlet and triplet states, quantum yields and luminescence lifetimes of 2:1 solutions of bMePybox and Eu(III) or Tb(III) as the nitrate salts in acetonitrile.
| E(1S) [cm−1]a | 33,890 ± 20 |
| E(3T) [cm−1]a | 26,920 ± 70 |
| ΦEu [%] | 26.4 ± 0.5 |
| τEu [ms] | 1.47 ± 0.05 |
| ΦTb [%] | 41.0 ± 1.3 |
| τTb [ms] | 1.87 ± 0.04 |
a Measured as the Gd(III) complexes.
The absorption, excitation and emission spectrum of these 2:1 solutions are shown in Fig. 8. It can be seen that the excitation spectra, for both Eu(III) and Tb(III)-containing solutions, follow closely the absorption spectra. Absorption and excitation maxima (monitored at the maximum emission wavelength of the lanthanide ion being studied) are located around 280 nm, a clear indication that the sensitization of the lanthanide ion emission is occurring through initial excitation of the ligand. The emission spectra of the metal ions (λexc = 280 nm) show the characteristic pattern for each ion. In the case of Tb(III), four distinct peaks are seen at 492.5, 547.5, 587.5 and 622 nm, corresponding to the 5D4 → 7FJ (J = 6,5,4,3) transitions, respectively. In the case of Eu(III), three intense peaks are seen at 594.5, 618.5 and 687 nm, corresponding to the 5D0 → 7FJ (J = 1,2,4) transitions, respectively, and a less intense one at 650 nm corresponding to the 5D0 → 7F3 transition. The quantum yields of emission could be determined in both cases and are 26.4% for Eu(III) and 41.0% for Tb(III) and are summarized, along with the luminescence lifetimes, in Table 5. The emission efficiencies with bMePybox as the sensitizing ligand are lower than the ones observed with PyboxTh as the sensitizer, which were 76.2% and 58.6% for Eu(III) and Tb(III), respectively. The large difference in emission efficiency between the two Pybox-based ligands is most likely related to the larger gap between triplet state of the ligand and excited/emissive state of the lanthanide ion, which leads to less efficient energy transfer and thus a lower sensitization efficiency. With the triplet state of the ligand at 26,900 cm−1, the ΔE (3T → 5D4) ≈ 6500 cm−1 for Tb(III) and ΔE (3T → 5D0) ≈ 9700 cm−1 for Eu(III) show a better energy match for Tb(III). This supports the higher quantum yield for the Tb(III) complex when compared with the Eu(III) complex. To further support this reasoning, the intrinsic quantum yield of emission of Eu(III), ΦEu, was determined, as proposed by van Veggel and co-workers [33], to be 32.6%. Since the overall emission efficiency Φ is a product of the sensitization efficiency, Φsens, and the intrinsic quantum yield of emission ΦEu, this leads to Φsens = 82.1%. These values suggest that the luminescence of the Eu(III) is being quenched by non-radiative processes and not by the inefficiency of the sensitization process. The non-radiative quenching could come from either coordinated solvent molecules or coordinated nitrates, as shown in the solid state structure.

Absorption (····), excitation (- - - -) and emission (––) of 2:1 solutions of bMePybox with Eu(III) (red) and Tb(III) (green) in MeCN.
4 Conclusion
An oxazoline-derivatized pyridine-based ligand, bMePybox, was synthesized as a mixture of stereoisomers and explored for the first time as a coordinating ligand and sensitizer of Eu(III) and Tb(III) luminescence. Evidence was presented for the existence of two different complexes in solution, one with a 1:1 ligand-to-metal ion stoichiometry and one with a 2:1 stoichiometry. In the solid state, a dimer was isolated, with an overall 1:1 stoichiometry, with two-symmetry-related Tb(III) ions which are bridged by the methyl ester moieties of the ligands. While the solutions are luminescent, the high energies of singlet and triplet states of the ligand lead to moderate energy transfer efficiencies to the coordinated lanthanide ions, resulting in emission quantum yields of 26.4% for Eu(III) and 41.0% for Tb(III). Further studies are currently underway for this system, which include the synthesis of pure isomers of the ligand, to allow for unambiguous assignment of the 1H-NMR spectra as well as to explore the possibility of circularly polarized luminescence.
Acknowledgements
The National Science Foundation (NSF-CHE0733458) and the University of Nevada, Reno, are gratefully acknowledged for the financial support of this work.