

1 Introduction
Schiff-base ligands are an important class of organic ligands in coordination chemistry, which increase the chemical and biological aspects of the compounds because they act as antibacterial [1], antiviral [2], antifungal agents [3], as homogeneous or heterogeneous catalysts [4] and display magnetic properties [5]. Different types of complexes with various stereochemistries are formed when Schiff-bases react with metal centers [6]. In recent years, it has been realized that complexation of anticancer agents decreases the viability of cells and in many cases reduces the side effects of their toxicity [7,8]. The Schiff-base complexes containing oxygen and nitrogen donor atoms continue to attract great interest because of their aptitude for possessing uncommon configurations, and their intrinsic potential in many biochemical processes [9,10].
Nickel complexes play a strong role in bioinorganic and redox enzyme systems [11,12]. Square planar nickel in the presence of some other factors can cause plasmid cleavage [13]. Molybdenum complexes in high oxidation states are considerable catalysts for some industrial processes such as epoxidation of olefins and ammoxidation of propene [14]. Many reports show that molybdenum complexes with O and N donor ligands are potential catalysts for homogeneous and heterogeneous reactions [15,16], and in many cases DFT calculations have been performed for understanding the mechanism of the reactions as well as the molecular properties of the compounds, as well as for providing good assignment of experimental spectra [17].
In this study, we describe the synthesis, characterization and DFT calculations of two new square planar mixed-ligand Ni(II) and octahedral Mo(VI) complexes with a tridentate salicylidene derivative ligand.
2 Experimental
2.1 Materials and instrumentation
Chemicals were purchased from Merck and Aldrich Chemicals, and were used without further purification. Elemental analyses were performed using a Thermo Finnigan Flash Elemental Analyzer 1112EA. FT–IR spectra were recorded on a FT–IR 8400-SHIMADZU spectrophotometer as KBr discs in the 400–4000-cm−1 range. Molar conductance measurements were made by means of a Metrohm 712 Conductometer in MeOH. 1H-NMR spectra were recorded at 25 °C using a Bruker BRX 100 Avance spectrometer. Electronic spectra in MeOH solutions of the complexes were recorded with a Shimadzu model 2550 UV–Vis spectrophotometer. Diffraction data were measured using a Bruker APEX II CCD area-detector diffractometer.
2.2 2-(((5-chloro-2-hydroxyphenyl)imino)methyl)phenol (H2L)
H2L have been prepared according to our previous report [18]. A solution of 2-amino-4-chlorophenol (0.3 g, 2 mmol) in 5 mL of ethanol was added to an ethanolic solution (5 mL) of 2-hydroxy-benzaldehyde (0.2 g, 2 mmol) under vigorous stirring. After heating for 15 min, the solution was cooled and an orange precipitate was separated by filtration, washed with cold ethanol and dried in a desiccator over silica gel.
Yield: 0.41 g, 83%. m.p.: 156 °C. Anal. calcd. for C13H10ClNO2 (247.68 g·mol−1): C, 63.04; H, 4.07; N, 5.66. Found: C, 63.18; H, 4.01; N, 5.73%. FTIR (KBr) cm−1: ν(OH) 3047wb, ν(NH) 2099sb, ν(CN) 1627s, ν(CCring) 1496s, ν(CO) 1307 m, ν(CCl) 655 m. 1H-NMR (100 MHz, DMSO-d6, 25 °C, ppm): δ = 13.4 (s, 1H; OHaldehyde), 10 (s, 1H; OHamin), 9.0 (s, 1H; CHN), 6.7–7.8 (m, 7H, rings). UV/Vis (methanol) λmax, nm (logɛ, L·mol−1·cm−1): 226 (4.49), 268 (4.32), 350 (4.27), 438 (3.53).
2.3 Methanol (2-((5-chloro-2-hydroxyphenylimino)methyl)phenolato)dioxidomolybdenum(VI)·[MoO2(L)(MeOH)] (1)
The solid Schiff-base ligand H2L (0.01 mmol, 0.03 g) was dissolved in 3 mL of methanol. This solution was added dropwise to a methanolic solution (3 mL) of MoO2(acac)2 (0.01 mmol, 0.04 g) under constant stirring. The mixture was refluxed for 1 h. The resulting yellow solution was then left undisturbed at room temperature. After two days, yellowish block-shaped XRD-quality single crystals appeared. These were dried in the air at room temperature and stored in a desiccator over silica gel.
Irregular red, yield: 0.031 g, 77.5%. m.p.: > 300 °C. Molar conductance (10−3 M, MeOH): 4.4 Ω−1·cm2·mol−1. Anal. calcd. for C14H12ClMoNO5 (405.64 g·mol−1): C, 41.45; H, 2.98; N, 3.45. Found: C, 41.33; H, 2.91; N, 3.52%. IR (KBr) cm−1: ν(OH) 3371w, ν(CN) 1604s, ν(MoO2) 817, 925s, ν(CCring) 1550 m, ν(CO) 1288 m, ν(CCl) 694s. 1H-NMR (100 MHz, DMSO-d6, ppm): δ = 9.3 (s, 1H; CN), 6.8–8.1 (m, 7H; rings), 4.2 (q, 1H; OH), 3.2 (d, H; CH3). UV/Vis (MeOH) λmax, nm (logɛ, L·mol−1·cm−1): 218 (4.70), 240 (4.56), 302 (4.52), 354 (4.12), 426 (3.99).
2.4 Imidazole(2-((5-chloro-2-hydroxyphenylimino)methyl)phenolato) nickel(II) [Ni(L)(Im)].MeOH (2)
A methanolic solution (3 mL) of Ni(OAc)2·4H2O (0.1 mmol, 0.02 g) was added to a solution of H2L (0.1 mmol, 0.03 g) in 2 mL of methanol, and the reaction mixture was refluxed for 30 min. Then, 3 mL of a methanolic solution of imidazole (0.2 mmol, 0.02 g) was added to the reaction mixture and the reflux was continued for an additional 2 h. By slow evaporation of the resulting solution, red crystals appeared, which were separated, dried in the air at room temperature and stored in a desiccator over silica gel.
Irregular red, crystals. Yield: 0.027 g, 67%. m.p.: 208 °C. Molar conductance (10−3 M, MeOH): 3.9 Ω−1 cm2 mol−1. Anal. calcd. for C17H16ClN3NiO3 (404.49 g·mol−1): C, 50.48; H, 3.99; N, 10.39. Found: C, 50.57; H, 3.85; N, 10.46%. IR (KBr) cm−1: ν(OH) 3139w, ν(CN) 1604s, ν(NH) 3062s, ν(CCring) 1527s, ν(CO) 1280 m, ν(CCl) 655s. 1H-NMR (100 MHz, DMSO-d6, ppm): δ = 12.9 (s, 1H, NH), 9.8 (s, 1H; CHN), 6.4–8.1 (m, 10H; rings), 3.8 (q, H; OH), 3.2 (d, 3H; CH3). UV/Vis (MeOH) λmax, nm (logɛ, L·mol−1·cm−1): 206 (4.65), 234 (4.36), 294 (3.95), 428 (4.28), 452 (4.21).
2.5 Crystal structure determination
The data were collected at room temperature with a Bruker APEX II CCD area-detector diffractometer using Mo Kα radiation (λ = 0.71073 Å). Data collection, cell refinement, data reduction and absorption correction were performed using multiscan methods with Bruker software [19]. The structures were solved by direct methods using SIR2004 [20]. The non-hydrogen atoms were refined anisotropically by full-matrix least-squares on F2 using SHELXL [21]. All hydrogen atoms were placed at calculated positions and constrained to ride on their parent atoms. Details concerning collection and analysis are reported in Table 1.
Crystal data and structure refinement.
| [MoO2(L)(MeOH)] | [Ni(L)(Im)]·MeOH | |
| Empirical formula | C14H12ClMoNO5 | C17H16ClN3NiO3 |
| Formula weight | 405.64 | 404.49 |
| Temperature (K) | 293(2) | 296(2) |
| Wavelength (Å) | 0.71073 | 0.71073 |
| Crystal system, space group | Triclinic, P1 | Monoclinic, P2(1)/n |
| Unit cell dimensions | a = 6.881 Å α = 112.58° b = 10.429 Å β = 90.98° c = 11.617 Å γ = 102.95° | a = 5.75500(10) Å b = 11.1307(2) Å β = 90.9460(10)° c = 26.8164(4) Å |
| Volume (Å3) | 745.2 | 1717.55(5) |
| Z, Calculated density (Mg/m3) | 2, 1.808 | 4, 1.564 |
| Absorption coefficient (mm−1) | 1.081 | 1.306 |
| F(000) | 404 | 832 |
| Crystal size (mm) | 0.17 × 0.12 × 0.05 | 0.36 × 0.22 × 0.18 |
| Theta range for data collection (°) | 3.06 to 27.00 | 2.38 to 30.57 |
| Limiting indices | –8 ≤ h ≤ 8, –13 ≤ k ≤ 13, –14 ≤ l ≤ 14 | –8 ≤ h ≤ 8, –15 ≤ k ≤ 15, –38 ≤ l ≤ 38 |
| Reflections collected/unique | 18029/3254 [R(int) = 0.0342] | 74564/5245 [R(int) = 0.0303] |
| Completeness to θ = 27.00 | 99.9% | 99.6% |
| Refinement method | Full-matrix least-squares on F2 | Full-matrix least-squares on F2 |
| Data/restraints/parameters | 3254/1/203 | 5245/1/235 |
| Goodness-of-fit on F^2 | 1.045 | 1.067 |
| Final R indices [I > 2 σ(I)] | R1 = 0.0432, wR2 = 0.1168 | R1 = 0.0377, wR2 = 0.1054 |
| R indices (all data) | R1 = 0.0584, wR2 = 0.1279 | R1 = 0.0493, wR2 = 0.1127 |
| Largest diff. peak and hole (e·Å−3) | 1.935 and –0.694 | 0.366 and –0.433 |
2.6 Computational
Full geometry optimization of the ground-state (S0) complexes was carried out using DFT-B3LYP and PBE methods [22,23] with 6–31 + G(d,p) basis set for C, N, O, Cl, H and LANL2DZ for Mo and Ni atoms using the G03 program [24]. Crystal structures were used as starting points for DFT calculations.
To validate the optimization of the structures, frequency calculations were performed, and the results showed no negative (imaginary) frequency. Furthermore, the determination of the origin of structural behaviors has been done with Natural Band Orbital (NBO) analysis at the same level. UV–Vis spectra, electronic transitions, absorbance and oscillator strengths are computed with the time-dependent DFT (TD-DFT) method at the B3LYP/6–31 + G(d,p) level. Solvent (MeOH) was considered as a uniform dielectric constant 32.6 and Polarized Continuum Model (PCM). GAUSSSUM 2.2 with FWHM 0.3 eV have been used to calculate the DOS diagram and to analyze the contribution percentage of groups and atoms to the molecular orbitals [25].
3 Results and discussion
Mo(VI) (1) and Ni(II) (2) complexes of the H2L tridentate Schiff-base ligand can be prepared by reaction of a methanolic solution of MoO2(acac)2 and Ni(OAc)2·4H2O salts with the ligand, in a 1:1 molar ratio (1 mole imidazole for 2). The analytical data and other spectral characterizations support the formulation of the compounds. These complexes are found to be soluble in most of the common organic solvents such as methanol, CHCl3, DMSO, DMF, and insoluble in n-hexane and water. Low molar conductivity values of 1 and 2 indicates that they behave as non-electrolytes.
3.1 Characterization
According to our previous work [6], this ligand has two tautomeric forms, enol (benzenoid) or keto (quinoid) forms. FT–IR spectral studies are performed by comparison of the free ligand spectrum with those of its Ni(II) and Mo(VI) complexes. A v(CN) strong band at 1627 cm−1 in the free ligand spectrum shows a red shift to 1604 cm−1 (23 cm−1) after coordination, indicating the coordination of the azomethine nitrogen atom to the metal center. In the IR spectrum of the ligand, the band observed at 3047 cm−1 is due to the NH vibration. Its absence in the spectra of 1 and 2 is another evidence that demonstrates the coordination of the azomethine nitrogen atom to the metal center [26]. Moreover, a shift of the CO bond energy of H2L (1307 cm−1) to lower frequencies at 1288 and 1280 cm−1 for 1 and 2, respectively, is another reason for the coordination of the ligand to the metal through the phenolic oxygen atom. Dioxidomolybdenum(VI) complex with a cis-MoO2 moiety exhibits two strong bands at 817 and 925 cm−1 that can be assigned to symmetrical and asymmetrical v(OMoO) vibrations respectively [27]. The OH band vibrations of coordinated and non-coordinated methanol in 1 and 2 appear at about 3100–3400 cm−1.
The 1H-NMR spectrum of the ligand displayed singlet signals at 13.4 and 10 ppm, attributed to the OHalhehyde and OHamine respectively. After complexation, these signals disappeared, indicating that both phenolic oxygen atoms are connected to the metal atom.
The H2L spectrum shows a singlet signal at 9 ppm, which can be assigned to HCH=N. This signal appeared at 9.3 and 9.8 ppm for 1 and 2, respectively. Therefore, the high-field shift of these protons proved the coordination of the azomethine nitrogen to the metal center.
In the Mo(VI) and Ni(II) complexes, the signals at 4.1 and 3.2 ppm correspond to the coordinated methanol hydroxyl and the lattice methanol, respectively. Also, protons of the rings revealed at 6.8–8.1 ppm in both complexes.
In compound 2, the NH signal of the imidazole moiety was at 12.9 ppm and the protons of the azomethine and of the rings were disclosed to 9.8 and 6.4–8.1 ppm, respectively. Likewise, the OH and methyl groups of methanol appeared at 3.8 and 3.2 ppm, respectively.
3.2 X-ray structures
ORTEP representations of compounds 1 and 2 are shown in Figs. 1 and 2; selected bond lengths and angles are listed in Table 2.
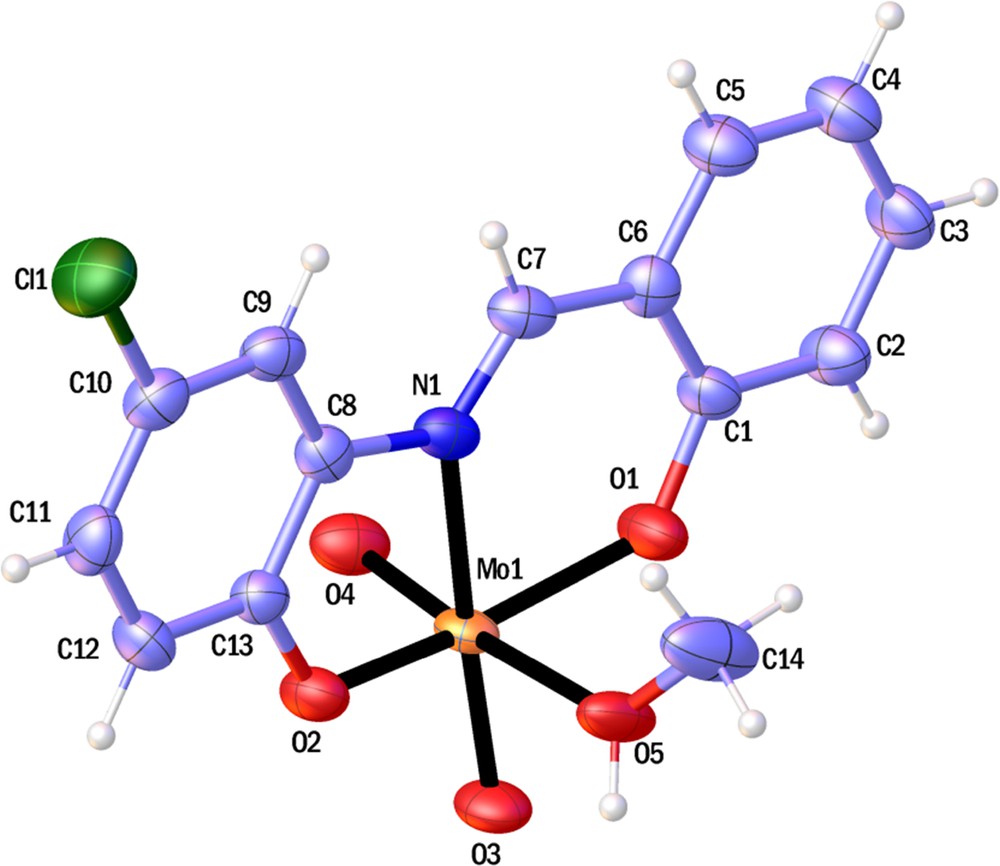
(Color online.) ORTEP view of 1. Non-H-atoms, represented as displacement ellipsoids, are plotted at the 50% probability level, while H atoms are shown as small spheres of arbitrary radius.
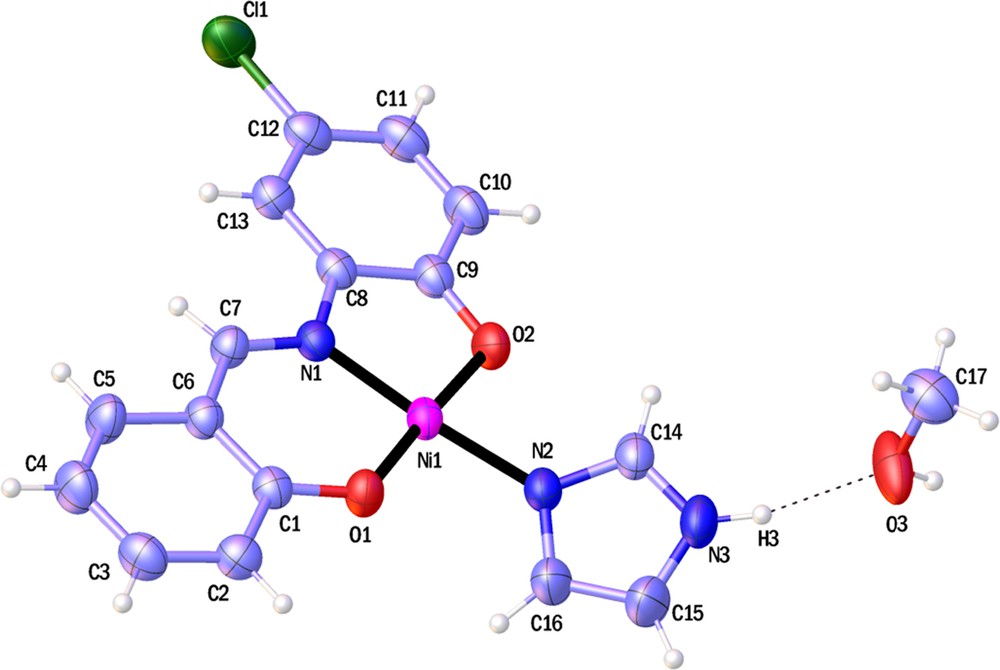
(Color online.) ORTEP view of 2. Non-H-atoms, represented as displacement ellipsoids, are plotted at the 50% probability level, while H atoms are shown as small spheres of arbitrary radius. The dotted line represents hydrogen bond interaction.
Selected bond lengths [Å] and angles [°] for the title complexes.
| [MoO2(L)(MeOH)] | [Ni(L)(Im)]·MeOH | ||||||
| exp. | theo. | exp. | theo. | ||||
| B3LYP | PBE | B3LYP | PBE | ||||
| Mo1O2 | 1.983(4) | 1.981 | 1.998 | Ni1N1 | 1.859(2) | 1.881 | 1.857 |
| Mo1N1 | 2.284(4) | 2.363 | 2.332 | Ni1N2 | 1.905(2) | 1.937 | 1.926 |
| Mo1O4 | 1.686(5) | 1.710 | 1.724 | Ni1O2 | 1.855(2) | 1.860 | 1.863 |
| Mo1O3 | 1.692(3) | 1.717 | 1.737 | Ni1O1 | 1.824(2) | 1.845 | 1.849 |
| Mo1O5 | 2.342(5) | 2.515 | 2.589 | C1C6 | 1.413(3) | 1.434 | 1.441 |
| Mo1O1 | 1.922(4) | 1.987 | 1.986 | C1O1 | 1.308(2) | 1.306 | 1.317 |
| O2C13 | 1.349(5) | 1.340 | 1.342 | N1C7 | 1.295(2) | 1.306 | 1.322 |
| N1C7 | 1.263(7) | 1.296 | 1.312 | N1C8 | 1.423(2) | 1.416 | 1.415 |
| N1C8 | 1.444(6) | 1.405 | 1.408 | O2C9 | 1.337(2) | 1.323 | 1.330 |
| O1C1 | 1.334(7) | 1.336 | 1.331 | C7C6 | 1.421(3) | 1.427 | 1.415 |
| C7C6 | 1.447(7) | 1.442 | 1.435 | C8C9 | 1.400(3) | 1.415 | 1.421 |
| C13C8 | 1.399(7) | 1.412 | 1.421 | N1Ni1N2 | 175.81(7) | 175.8 | 175.5 |
| C6C1 | 1.411(6) | 1.423 | 1.432 | N1Ni1O2 | 86.73(7) | 86.8 | 87.3 |
| O2Mo1N1 | 74.6(2) | 73.34 | 73.8 | N1Ni1O1 | 95.55(7) | 95.5 | 96.5 |
| O2Mo1O4 | 98.0(2) | 103.08 | 100.4 | N2Ni1O2 | 90.00(7) | 88.9 | 88.2 |
| O2Mo1O3 | 94.6(2) | 97.8 | 96.5 | N2Ni1O1 | 87.74(7) | 88.7 | 88.1 |
| O2Mo1O5 | 77.8(2) | 78.9 | 80.1 | O2Ni1O1 | 177.70(7) | 177.7 | 176.2 |
| O2Mo1O1 | 150.6(2) | 144.2 | 148.5 | C6C1O1 | 124.4(2) | 123.9 | 123.9 |
| N1Mo1O4 | 91.2(2) | 92.4 | 96.5 | Ni1N1C7 | 126.3(1) | 125.4 | 125.3 |
| N1Mo1O3 | 161.5(2) | 160.3 | 155.1 | Ni1N1C8 | 111.7(1) | 111.1 | 111.7 |
| N1Mo1O5 | 79.0(2) | 77.8 | 80.5 | C7N1C8 | 121.9(2) | 123.4 | 123.0 |
| N1Mo1O1 | 82.3(2) | 78.9 | 80.4 | Ni1O2C9 | 112.2(1) | 112.0 | 111.6 |
| O4Mo1O3 | 105.3(2) | 106.8 | 107.8 | N1C7C6 | 124.6(2) | 125.4 | 125.4 |
| O4Mo1O5 | 170.0(2) | 169.1 | 176.7 | C1C6C7 | 122.0(2) | 121.9 | 121.7 |
| O4Mo1O1 | 100.4(2) | 100.2 | 100.2 | N1C8C9 | 111.7(2) | 111.8 | 111.7 |
| O3Mo1O5 | 84.2(2) | 83.4 | 75.2 | O2C9C8 | 117.6(2) | 118.1 | 117.8 |
| O3Mo1O1 | 102.4(2) | 101.0 | 99.4 | Ni1O1C1 | 127.1(1) | 127.7 | 127.1 |
| O5Mo1O1 | 80.2(2) | 73.3 | 77.9 | ||||
| Mo1O2C13 | 121.5(3) | 123.3 | 122.1 | ||||
| Mo1N1C7 | 127.2(4) | 124.8 | 125.5 | ||||
| Mo1N1C8 | 112.0(3) | 110.8 | 111.4 | ||||
| Mo1O1C1 | 136.2(3) | 133.0 | 136.6 |
The molybdenum complex has a distorted octahedral geometry with the ONO deprotonated ligand connected via two phenolic oxygen and iminic nitrogen atoms in the equatorial plane, two oxido groups and a methanol molecule. The molybdenum atom has a 0.316 Å deviation from the equatorial mean plane (N1O1O2O3). Comparison of the MoN [28,29] and MoO [29–32] band distances with the other analogues compounds showed some similarities.
The Mo1O2 distance (1.983(4) Å) is longer than the Mo1O1 distance (1.922(4) Å), which is probably due to the O5H···O2 hydrogen bond. Two adjacent Mo-complexes bind to each other to form a dimmer via an O5H···O2 hydrogen bond (Fig. 3). This dimer made a one-dimensional chain with C9H9···O4 (3.398(7) Å) hydrogen bonds.
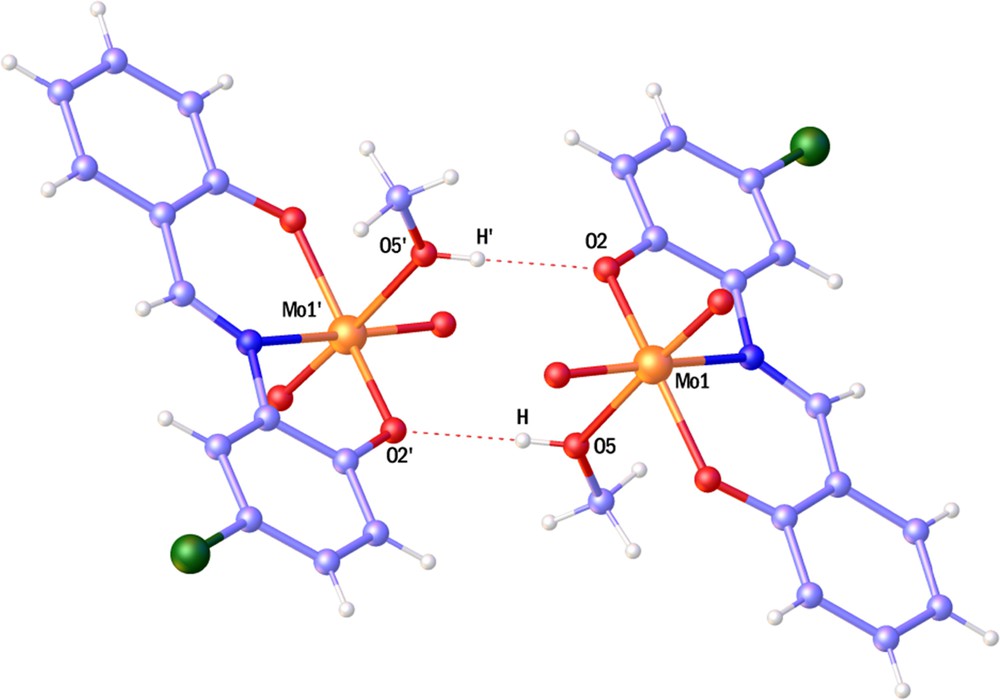
(Color online.) Perspective of
These chains join each other through C3H3···C14H14 C interactions to form a two-dimensional lattice. Finally, C7H7···O4 (3.342(6) Å), C5H5···O4 (3430(7) Å), C14H14···C9 (3.70(1) Å) and C14H14B···O3 (3.388(8) Å) hydrogen bonding interactions complete the third dimension in the lattice.
As it can be seen, the Ni ion has a distorted square planar coordination sphere in 2 and a lattice methanol molecule. The double deprotonated tridentate ONO ligand is coordinated to the nickel ion via two phenolic oxygen and iminic nitrogen atoms. The fourth coordination position is occupied by the imidazole molecule. In the center of 2, the nickel atom has a 0.019-Å deviation from the best plane formed by O1N1O2N2; also, the O1Ni1O2 (177.70(7)°) and N1Ni1N2 (175.81(7)°) angles which are close to the ideal value of 180° confirmed the nearly square planar geometry. The Ni1O1 (1.824(2)°) bond length is equal to that in the analogous compound [33], and the Ni1N2 (1.905(2)°) bond length is the smallest one reported in these nickel square planar complexes [33–36]. Two methanol molecules form N3H3···O3 and O3H···O2 intermolecular hydrogen bonds with adjacent complexes to make supra-molecular dimer with an
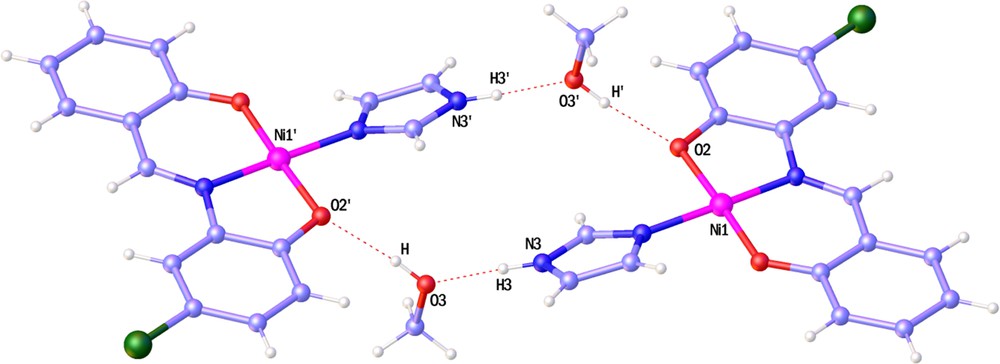
(Color online.) Perspective of
These dimmers link to each other through C1Cl interaction and C5H5···O1 intermolecular hydrogen bonds along a and b axis respectively, and form the three-dimensional lattice.
3.3 Computational
3.3.1 Geometry optimization
The structures of the complexes are optimized by DFT using the X-ray structures as input with B3LYP and PBE exchange functional. The absence of negative normal modes in frequency calculations emphasize that the optimized structures are in minimum energy. Comparison of theoretical results and experimental data shows a good agreement between them (Table 2). The negligible difference between experimental and theoretical data refers to the fact that the experimental data belong to the solid state and the lattice with interactions in the crystal structure, while the calculated values refer to a single molecule in the gas phase. As can be seen, the bond lengths and angles around central atoms in the title complexes determined from PBEPBE method are slightly higher than that obtained from B3LYP method.
3.3.2 Electronic spectra
UV–Vis spectra of the title compounds were recorded in a MeOH solution. The calculated and experimental diagrams of absorption spectra for 1 and 2 are shown in Fig. 5. The spectra of methanolic solution of H2L and the related complexes show four and five absorption bands in the UV–Vis region.
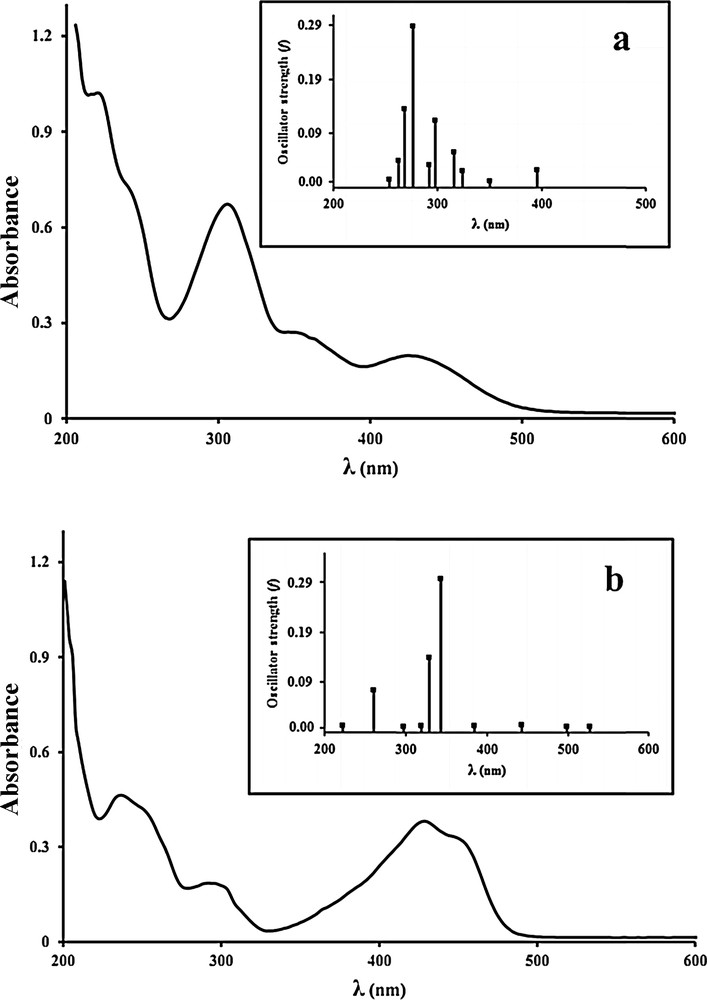
Experimental and calculated UV–Vis spectra of Mo (a) and Ni (b) complexes in MeOH solutions.
In the electronic spectrum of H2L, two bands at 226 nm and 268 nm are assigned to π→π* transitions of aromatic rings. The azomethine π→π* and n→π* transitions are viewed at 350 nm and 438 nm, respectively [6]. For both complexes, π→π* and n→π* transitions showed hypsochromic shifts. In the Mo(VI) complex, the band that appeared at 426 nm may be due to a LMCT (O(p) →Mo(d)) transition [39].
According to d0 electronic configuration (+6 formal oxidation state) of molybdenum, the Mo-complex showed no d–d transition. In the d8 square planar nickel complex, it is expected to show three spin-allowed d–d transition bands corresponding to 1A1g→1A2g, 1A1g→1B1g and 1A1g→1Eg, while the tailing of CT bands that appeared at 428 nm and 452 nm toward the visible region cause the disappearance of these bands [40]. In the calculated spectra for 2, these bands are located at 527.28 nm, 498.8 nm and 443.04 nm due to transitions of HOMO–2 and HOMO–5 to LUMO+1. Also, two bands at 384.4 and 342.72 can be related to LMCT and ILCT charge transfer transitions that are centered on 428 nm in the experimental spectra. Other bands that appeared in the theoretical spectrum can be described as an ILCT charge transfer that is mainly due to transitions from lower MOs to LUMO. Three bands at 294, 234 and 206 nm are correlated to this.
For more investigations, the observed and computed electronic transitions based on TD-DFT calculation for Mo(VI) and Ni(II) complexes are listed in Tables 3 and 4, respectively. The B3LYP level is selected due to more accurate results in comparison with those obtained using the PBE method. The calculated values of λmax are in good agreement with the experimental ones. In the calculated spectra of 1, the transitions between 395.68 and 276.72 nm are assigned to an admixture of ILCT and LMCT. These bands mainly arise from HOMO to LUMO (λ = 395.68 nm), HOMO to LUMO+1 (λ = 349.92 nm), HOMO–1 to LUMO (λ = 324.0 nm), HOMO to LUMO+2 (λ = 315.76 nm), HOMO to LUMO+3 (λ = 297.52 nm), HOMO–1 to LUMO+1 (λ = 292.08 nm) and HOMO–2 to LUMO (λ = 276.72 nm), respectively. The intense band that is located at 240 nm in the experimental spectra can be assigned to more than one excitation. In the calculated spectra, the related excitations are viewed at energies of 3.70 eV (λ = 267.92 nm) and 3.78 eV (λ = 262.16 nm), respectively. The last intense absorption band at 218 nm is attributed to ILCT, whereas appeared at 253.2 nm in simulated theoretical spectra.
Main calculated optical transition with composite ion in terms of molecular orbital contribution of the transition, vertical excitation energies and oscillator strength for [MoO2(L)(MeOH)].
| Composition | Weight (%) | E (eV) | Oscillatory strength (f) | λmax (calcd.) | λmax (exp.) | Assignment |
| H → L | 70 | 2.51 | 0.0222 | 395.68 | 426 | LMCT, ILCT |
| H → L + 1 | 70 | 2.83 | 0.0002 | 349.92 | 354 | LMCT, ILCT |
| H-1 → L | 58 | 3.06 | 0.0196 | 324.0 | LMCT, ILCT | |
| H → L + 2 H-1 → L H → L + 3 | 53 33 26 | 3.14 | 0.0556 | 315.76 | 302 | LMCT, ILCT |
| H → L + 3 H-2 → L H-1 → L + 1 H-1 → L | 49 29 26 11 | 3.33 | 0.1125 | 297.52 | LMCT, ILCT | |
| H-1 → L + 1 | 64 | 3.39 | 0.0310 | 292.08 | LMCT, ILCT | |
| H-2 → L H → L + 2 | 58 19 | 3.58 | 0.2877 | 276.72 | LMCT, ILCT | |
| H-1 → L + 4 H-2 → L H-1 → L + 3 | 61 21 21 | 3.70 | 0.1347 | 267.92 | 240 | ILCT |
| H-1 → L + 4 | 63 | 3.78 | 0.0392 | 262.16 | ILCT | |
| H-4 → L H-4 → L + 1 H-4 → L + 2 H-7 → L | 53 15 18 11 | 3.92 | 0.0035 | 253.2 | 218 | ILCT |
Main calculated optical transition with composition in terms of molecular orbital contribution of the transition, vertical excitation energies and oscillator strength for [Ni(L)(Im)]·MeOH.
| Composition | Weight (%) | E (eV) | Oscillatory strength (f) | λmax (calcd.) | λmax (exp.) | Assignment |
| H-2 → L + 1 H-5 →L + 1 | 52 17 | 1.88 | 0.0001 | 527.28 | d–d | |
| H-2 →L + 1 | 71 | 1.99 | 0.0012 | 498.8 | d–d | |
| H-5 →L + 1 H-3 →L + 1 H-6 →L + 1 | 43 44 13 | 2.24 | 0.0038 | 443.04 | 452 | LMCT, d–d |
| H-7 →L + 1 H-14 →L + 1 | 52 23 | 2.58 | 0.0024 | 384.4 | 428 | LMCT, ILCT |
| H →L + 1 | 67 | 2.89 | 0.2962 | 342.72 | LMCT, ILCT | |
| H-1 →L H →L | 67 15 | 3.02 | 0.1400 | 328.64 | 294 | ILCT |
| H →L H-5 →L + 1 H-3 →L + 1 H-1 →L + 1 | 61 19 21 18 | 3.11 | 0.0022 | 319.184 | ILCT | |
| H-2 →L | 70 | 3.34 | 0.0003 | 297.12 | ILCT | |
| H-3 →L H-6 →L H-5 →L | 66 13 14 | 3.81 | 0.0729 | 260.56 | 234 | ILCT |
| H-1 →L H-6 →L H-3 →L | 44 43 12 | 3.93 | 0.0025 | 222.64 | 206 | ILCT |
3.3.3 Analysis of frontier molecular orbitals
Frontier molecular orbitals, especially HOMO and LUMO, have a significant effect on electric properties such as UV–Vis spectra or NLO behaviors and on the prediction of the chemical reactivity of the material [41]. The surface plots of the HOMO and LUMO orbitals of Ni(II) and Mo(VI) complexes are depicted in Fig. 6.
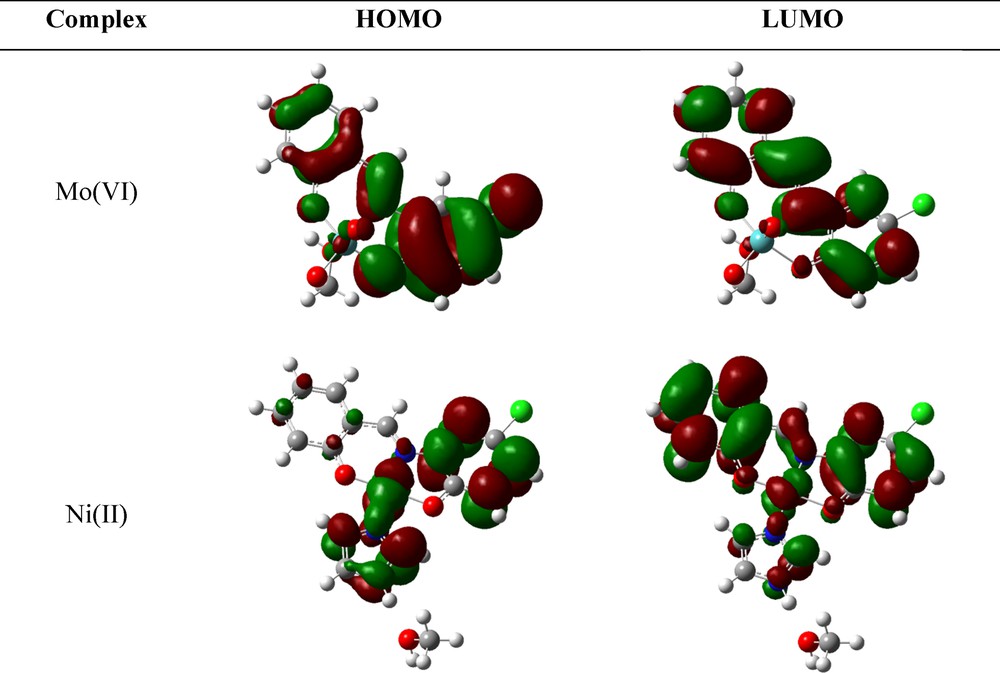
(Color online.) Contour plots of the HOMO and LUMO orbitals of Mo(VI) and Ni(II) complexes.
The HOMO–LUMO energy gap correlates with the stability of the compounds. According to Fig. 7, the HOMO–LUMO gap in [MoO2(L)(MeOH)] is higher than that in [Ni(L)(Im)]·MeOH complex. Hence, the Ni(II) complex is chemically more active than 1. Furthermore, details of the frontier molecular orbitals in complexes 1 and 2 are presented in Table 5.
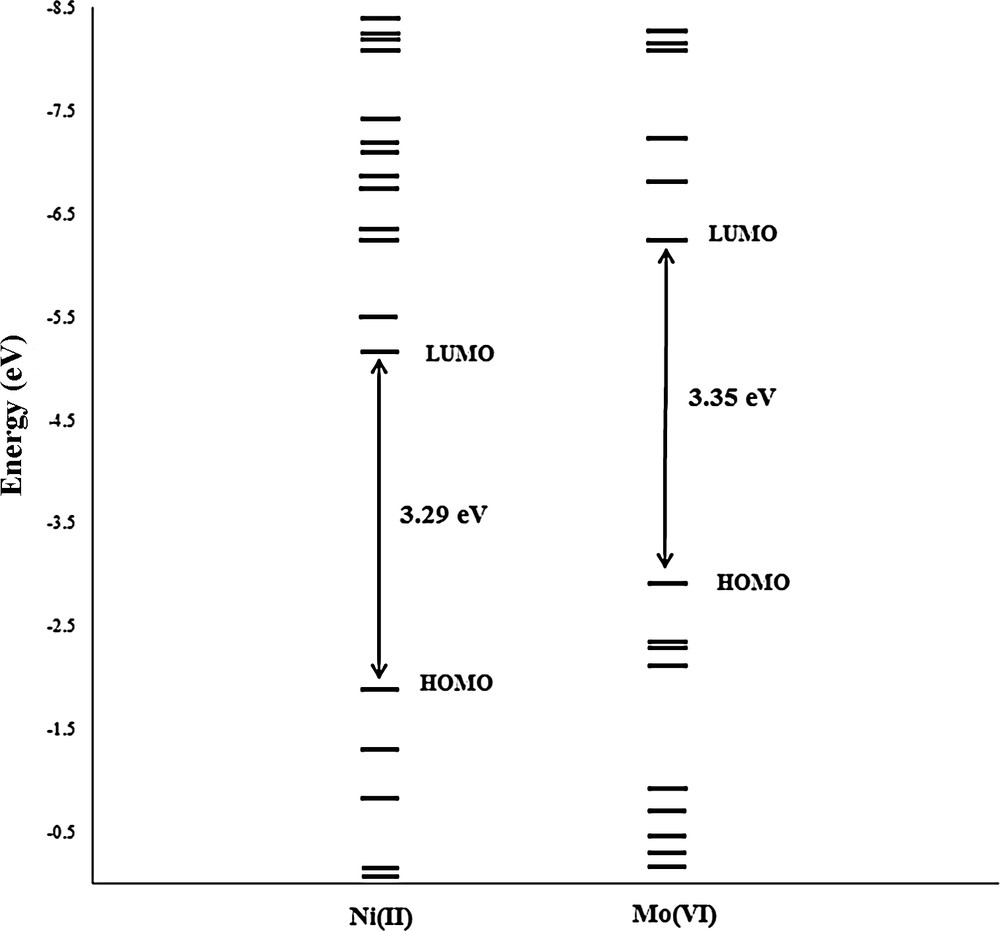
Diagram of Frontier molecular orbital energies of Mo(VI) and Ni(II) complexes.
Orbital energies and atomic orbital contributions for the frontier molecular orbitals for Mo(VI) and Ni(II) complexes.
| Ni(II) | Mo(VI) | |||||||||
| E (eV) | Ni (%) | Im (%) | L (%) | Met (%) | E (eV) | Mo (%) | Oxo% | L (%) | Meth (%) | |
| LUMO+4 | –0.08 | 6 | 50 | 28 | 16 | –0.92 | 4 | 2 | 93 | 1 |
| LUMO+3 | –0.15 | 5 | 13 | 76 | 5 | –2.11 | 59 | 27 | 13 | 1 |
| LUMO+2 | –0.84 | 10 | 2 | 4 | 84 | –2.3 | 57 | 18 | 25 | 0 |
| LUMO+1 | –1.3 | 63 | 6 | 30 | 1 | –2.35 | 50 | 22 | 27 | 1 |
| LUMO | –1.88 | 3 | 0 | 97 | 0 | –2.91 | 18 | 12 | 70 | 0 |
| HOMO | –5.17 | 4 | 0 | 96 | 0 | –6.26 | 1 | 3 | 96 | 0 |
| HOMO−1 | –5.5 | 18 | 0 | 82 | 0 | –6.83 | 1 | 3 | 96 | 0 |
| HOMO−2 | –6.26 | 100 | 0 | 0 | 0 | –7.25 | 0 | 0 | 100 | 0 |
| HOMO−3 | –6.35 | 24 | 3 | 73 | 0 | –8.09 | 0 | 25 | 74 | 1 |
| HOMO−4 | –6.75 | 28 | 42 | 30 | 0 | –8.15 | 0 | 63 | 32 | 5 |
The HOMO and LUMO orbitals in both complexes are mainly localized on non-metal atoms. For the Mo(VI) complex, the value of the contribution for non-metals in HOMO/HOMO–2 is equal to 99–100% and for LUMO/LUMO+3, it is equal to 82, 50, 43 and 41%, respectively. In the higher LUMOs of the Mo center, the contributions of the d orbitals have been calculated as follows: LUMO+1: 50%, LUMO+2: 57% and LUMO+3: 59%. The L−2 has the major contribution to the frontier orbitals. The L−2 constructs 96% and 70% of HOMO and LUMO, respectively. In [MoO2(L)(MeOH)], coordinated methanol to the central atom in HOMO–3/–8 played a 26–62% role, whereas it varies between 18–27% in LUMO+1/+3.
The d orbitals of Ni in the [Ni(L)(Im)]·MeOH have a significant contribution (18–27%) to lower HOMO (HOMO–1/–7), also 63 and 14% for LUMO+1 and LUMO+2. The ligand's contributions to the HOMO and LUMO are equal to 96 and 81%. The minimum contribution in HOMO and lower MOs belongs to MeOH (0%), but in orbitals higher than HOMO this value has increased up to 84% for LUMO+2. The DOS diagrams of complexes 1 and 2 are presented in Fig. 8.
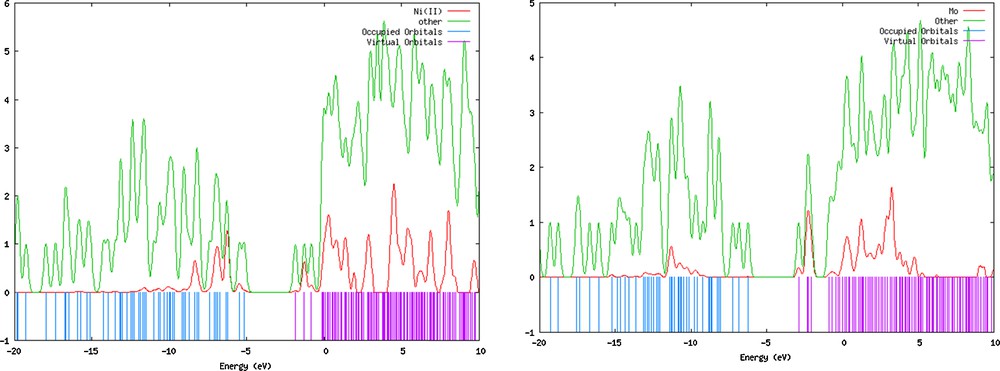
(Color online.) DOS diagrams of complexes 1 and 2.
These diagrams display the orbital composition characteristics of molecular orbitals with respect to particular fragments or atoms. According to these diagrams, the ligand plays a significant role in the frontier orbitals, except for central atoms that have no importance in the frontier molecular orbitals (especially in HOMO). However, the central metal ion contributes to a wide range of LUMO orbitals (Fig. 8).
Based on these data, the first transition state from HOMO to LUMO in the Ni(II) complex can be assigned to an intra-ligand charge transfer (ILCT), and for the Mo(VI) complex it can be predicted as an admixture of ILCT and LMCT.
3.3.4 Mulliken population analysis
The Mulliken atomic charges inferred from the natural population analysis (NPA) for the most important atoms in the complexes are summarized in Table 6. The formal oxidation states expected for the studied complexes are +2 (Ni) and +6 (Mo), but the calculated natural charges and electron configuration differ from these values and are lower than the anticipated values: Ni, 0.813; Mo, 1.44. Additionally, according to Table 6, electronic configuration and charges on the terminal oxido (in [MoO2(L)(MeOH)]) and the coordinated oxygen atoms of aromatic rings to the metal center in both complexes are significantly smaller than the expected amount.
Atomic charges from the natural population analysis (NPA) for [MoO2(L)(MeOH)] and [Ni(L)(Im)]·MeOH.
| [MoO2(L)(MeOH)] | ||
| Atom | Charge | Valance arrangement |
| Mo | 1.440 | [core]4d(3.90)5p(0.45)6S(0.20) |
| O1 | –0.634 | [core]2S(1.62)2p(4.99) |
| O2 | –0.604 | [core]2S(1.63)2p(4.95) |
| O3 | –0.455 | [core]2S(1.80)2p(4.64) |
| O4 | –0.438 | [core]2S(1.80)2p(4.62) |
| O5 | –0.748 | [core]2S(1.67)2p(5.06) |
| N1 | –0.473 | [core]2S(1.29)2p(4.15) |
| [Ni(L)(Im)]·MeOH | ||
| Atom | Charge | Valance arrangement |
| Ni | 0.813 | [core]3d(8.69)4p(0.30)5S(0.18) |
| O1 | –0.672 | [core]2S(1.65)2p(5.00) |
| O2 | –0.701 | [core]2S(1.67)2p(5.02) |
| N1 | –0.477 | [core]2S(1.28)2p(4.17) |
| N2 | –0.510 | [core]2S(1.34)2p(4.15) |
Natural charges data indicate that the donations from the ligands to the central ions have the advantage over the back donations from the metal to the ligands.
In the Mo(VI) complex, oxygen atoms of the oxido are less negative from the other oxygen atoms. This is due to higher electron density delocalization from the terminal oxido to the Mo and is the reason why their bond length (MoO) is lower in comparison with the case of other MoO bonds. The bond lengths can be arranged as follows:
| MoO < MoO (rings) < MoO (methanol) |
In case of 2, electron delocalizations in both NiO bonds are close together and therefore the bond lengths have no significant differences.
4 Conclusion
Mo(VI) and Ni(II) complexes of the general composition [MoO2(L)(MeOH)] and [Ni(L)(Im)]·MeOH have been synthesized and characterized by different spectroscopic methods. Molecular structures for both complexes have been identified by single-crystal X-ray analysis. According to X-ray structural determination, Ni(II) and Mo(VI) complexes have a square planar and octahedral geometry respectively and are distorted. DFT calculations were performed on both kinds of complexes. The theoretical results and the spectral studies are in agreement with the proposed structure of all synthesized compounds. Energies of the important MO's, absorption wavelength (λmax), oscillator strength and excitation energies of the compounds were also determined from the TD-DFT method and compared with the experimental values. According to DFT calculations, the main contribution of HOMO and LUMO belongs to L−2, while the central atoms in the two studied complexes play a little role in frontier orbitals, especially in HOMO and in lower frontier molecular orbitals.
Acknowledgements
This work was supported by Ferdowsi University of Mashhad and Payame Noor University (PNU). We would like to thank the Università di Messina (Italy) for technical assistance in crystallography.