

1 Introduction
As sustainable development has become a major global issue, oil production with minimal negative impacts on the environment is essential. The principal by-products generated from oil refineries include oil cake, stem, and grain husk. Numerous studies have shown that these by-products contain valuable compounds and lignocellulosic fractions. For example, oil cake is reported to be rich in proteins [1–3]. In hazelnut oil cake, the protein content can reach 54.4% [4]. The stem and grain husks represent two coarse and fibrous by-products with high concentrations of cellulose, hemicelluloses, and lignin [5–7]. Therefore, these by-products might represent an important source for various industrial sectors such as green fertilizer, animal feed, chemicals, and energy [8,9]. They also allow farmers to find new markets for their crops as renewable and biodegradable biomass.
Recent studies on the valorization of oil refinery biomass focus on three ways including animal feed, recovery of extractives (proteins, polyphenols, pectins…), and production of bioethanol. However, lignocellulosic biomass is composed of strong lignin layers and cellulose of high crystallinity, which reduce its accessibility to chemicals and enzymes. Therefore, the valorization methods mentioned above are usually combined with mechanical (grinding and cutting) or thermal (heating and freezing-thawing) treatments to increase the surface area or cell permeability. However, these conventional treatment methods present certain disadvantages, including high energy consumption and low extract purity due to the non-selective release of intracellular compounds [10,11].
In the past few decades, ultrasound technology has been used to intensify the extraction of different natural products such as antioxidants, essential oils, and dyes [12,13]. The application of power ultrasound (10–100 W/cm2) in sonochemistry is attributed to the cavitation phenomena, which is defined as the phenomena of the formation, growth, and subsequent collapse of bubbles, releasing large magnitude of energy, and inducing localized extreme conditions (T = 5000 K, P = 20 MPa) [12,14]. Biological cells and tissues nearby undergo significant repetitive shears and their permeability may be increased, which facilitates the release of intracellular compounds into the surrounding media [15]. Recent studies showed that ultrasound in the field of extraction has brought green impacts: use of alternative solvents (water or agro-solvents), low energy consumption, and enhanced extract quality when compared to conventional methods [12,13]. The extreme conditions generated by collapsing bubbles can also lead to the formation of hydrogen peroxide in an aqueous solution, which provides methods for evaluating acoustic cavitation activity [16,17].
The scope of published applications of ultrasound in valorization of oil refinery by-products including enhancement of extract recovery and bioethanol production is summarized in Table 1. In most studies, a green solvent, which has a low environmental impact such as ethanol or water, was used during ultrasound treatment. The power and temperature applied varied from 100 to 600 W and from 50 to 75 °C, respectively, according to the nature of the biomass. It was shown by Nikolić et al. [23] that ultrasound can also be used as a pretreatment method for the enhancement of bioethanol production from corn oil cake. A short-time pretreatment of 5 min by ultrasound followed by simultaneous saccharification and fermentation led to an increase in an ethanol production yield of 11.15%.
List of ultrasound applications for valorization of oil refinery by-products.
| Final product | Ultrasound conditions | Solvent | Performance | Reference |
| Carotenoids from rapeseed meal | 28 kHz, 240 W, 48.5 min, 49.6 °C | Petroleum ether/acetone (v/v = 1:1) | Similar yields compared with three times of conventional water bath extraction. | [18] |
| Antioxidant from olive leaves | 30 kHz, 600 W, 180 min, 60 °C | 80% ethanol | Increased antioxidant capacity compared with extraction without ultrasound. | [19] |
| Polyphenols from rice bran | 35 kHz, 140 W, 40–45 min, 51–54 °C | 65–67% ethanol | Increased yield compared with extraction without ultrasound. | [20] |
| Polysaccharide from corn silk | 40 kHz, 250 W, 17 min, 56 °C | Water | Increased yield compared with extraction without ultrasound. | [21] |
| Hemicelluloses from corn bran | 20 kHz, 100 W, 5 min, 70 °C | Water | Similar yields compared with the classical procedures using H2O2-containing alkaline media. | [22] |
| Bioethanol from corn oil cake | 40 kHz, 600 W, 5 min, 60 °C | Water | 11.15% increased yield compared with production without ultrasound | [23] |
| Bioethanol from palm fronds | 37 kHz, 200 W, 30 min, 75 °C | 80% ethanol + 1.4% NaOH | Increased yield and time reduction compared with production without ultrasound. | [24] |
Rapeseed (Brassica napus L.) is an important source of vegetable oil. Worldwide production of rapeseed was 64.8 million tons in 2012, in which the mass portion of the green part of the plant, the rapeseed stem, is about 30%. Therefore, about 20 million tons of such green residual biomass is produced annually after oil extraction. Rapeseed can also be cultivated as a cover crop to help minimize soil erosion and prevent nutrient leaching [25]. Destruction is usually carried out before the maturation stage of the plant (in February) and its further valorization was rarely studied. Both the immature and mature rapeseed stems are promising green biomass feed stocks containing polyphenols, proteins, chlorophylls, and carotenoids [26]. To the best of the authors’ knowledge, no study dealing with the recovery of extractives from rapeseed stems by ultrasound has been published to date.
The aim of the present research was to investigate, in a first approach, the effect of ultrasound power, treatment time, sample length, and agitation speed on the extraction yield of polyphenols and proteins from mature rapeseed stems. Then, the possibility of using ultrasound as a pretreatment method for recovery of extractives from immature rapeseed stems was also studied. Finally, the performance of the ultrasound technique during extraction was compared to conventional extraction techniques without ultrasound treatment.
2 Materials and methods
2.1 Plant materials
Immature and mature rapeseed samples (cultivar Dkextorm) were collected from a local field in Chevrières, France, in February and around the time of the summer harvest in early July, respectively. Immediately following the collection, all samples were brought to the laboratory and were stored in a cold room at 4 °C until used. The extraction experiments were conducted within two weeks following the collection to prevent sample degradation. The Dry matter content (DM) was determined by drying fresh rapeseed stems (2 g) at 130 °C to a constant mass in a moisture analyzer (Scaltec SMO 01, France) and was expressed in percent (%):
| (1) |
2.2 Ultrasound treatment experiments
Ultrasound treatment experiments were carried out using an ultrasonic processor UP 400S (Hielscher GmbH, Stuttgart, Germany) connected to an ultrasonic probe placed in the treatment chamber (190 × 200 × 130 mm). The maximum power and frequency of the ultrasonic processor are 400 W and 24 kHz. The titanium ultrasonic probe (H11, Hielscher GmbH, Stuttgart, Germany) has a diameter of 11 mm, and the maximum length that can be submerged is 90 mm (total length: 100 mm). The probe was immersed in a glass beaker (volume, V = 600 ml, diameter, d = 95 mm) containing 40 g of cylinder-shaped mature rapeseed stems (diameter of sample d = 8 ± 2 mm) to be treated. Distilled water was used as the solvent (liquid to solid ratio r = 8) during the ultrasound treatment due to its ability to co-extract polyphenols and proteins in the rapeseed stems [26]. The preliminary experiments showed that the thermal efficiency for ultrasound power ranging from 100 to 400 W was about 25% (equal to 6.6–26.3 W/cm2) when using distilled water as the solvent. The treatment was conducted in batch mode. Agitation was provided using a mechanical stirrer (VELP Scientifica, Italy). No cooling system was used to avoid heating induced by ultrasound irradiation in order to keep energy requirements as low as possible. The glass beaker was covered with aluminum foil to reduce evaporation of the solvent during treatment. The varied parameters were ultrasound power, treatment time, rapeseed stem length, and agitation speed. Polyphenol and protein contents in the extracts were determined by the spectrophotometric method following the treatment.
2.3 Experimental design
Response Surface Methodology (RSM) was used to determine optimal conditions for extraction of polyphenols and proteins from mature rapeseed stems assisted by ultrasound treatment. A Box–Behnken Design (BBD) was applied to evaluate the effects of ultrasound power (W) (X1), treatment time (min) (X2), sample length (cm) (X3) and agitation speed (rpm) (X4), at four equidistant levels, on the response pattern of extracts with regard to their polyphenol and protein contents. The ranges of the four independent variables of the extraction process (ultrasound power from 0 to 400 W, treatment time from 5 to 60 min, sample length from 0.5 to 2.5 cm, and agitation speed from 0 to 600 rpm), depicted in Table 2, were based on preliminary experimental results. Each variable was coded at three levels, low (−1), middle (0), and high (+1) (Table 2).
Experimental values and coded levels of the independent variables used for the Box–Behnken Design (BBD).
| Coded levels | Uncoded levels | |||
| Ultrasound power (W) | Treatment time (min) | Sample length (cm) | Agitation speed (rpm) | |
| −1 | 0 | 5 | 0.5 | 0 |
| 0 | 200 | 32.5 | 1.5 | 300 |
| +1 | 400 | 60 | 2.5 | 600 |
The complete design consisted of 29 experimental runs, including 5 replicates of the central point for measurements of residual variability and process stability. In order to minimize the effect of unexpected variability in the observed responses, all experimental runs were randomized.
The experimental data were analyzed using software Design-Expert (version 7.0), and the parameters obtained from the RSM analysis were substituted into the following second-degree polynomial model equation:
| (2) |
2.4 Ultrasound pretreatment experiments
Ultrasound pretreatment experiments were performed using the same system as treatment experiments under optimal conditions obtained by RSM. Immature rapeseed stems (diameter of sample d = 0.6 ± 0.1 cm) were pretreated by using ultrasound for 0, 5, 10, 20, and 30 min. After ultrasound pretreatment, the ultrasonic processor was switched off while the extraction was continued for 60–90 min. The extraction kinetics of polyphenols and proteins were measured and compared.
2.5 Specific ultrasound energy input
The total specific energy input of ultrasound treatment WUS (kJ/kg) was determined by the following formula [27]:
| (3) |
2.6 Comparison of extraction performance
The performance of the ultrasound technique during extraction was compared with two conventional extraction techniques, including cold and hot water extraction without ultrasound treatment. Both the cold and hot water extractions were conducted under the same conditions of liquid to solid ratio, sample length and agitation speed as ultrasound water extraction. The hot water extraction was carried out with the use of a magnetic hot plate stirrer (VELP Scientifica, Italy) connected to a digital temperature regulator, which allowed us to heat the samples by following a similar temperature evolution as ultrasound treatment (Fig. 1). The extraction kinetics of polyphenols and proteins of the aforementioned extraction processes were measured and compared.
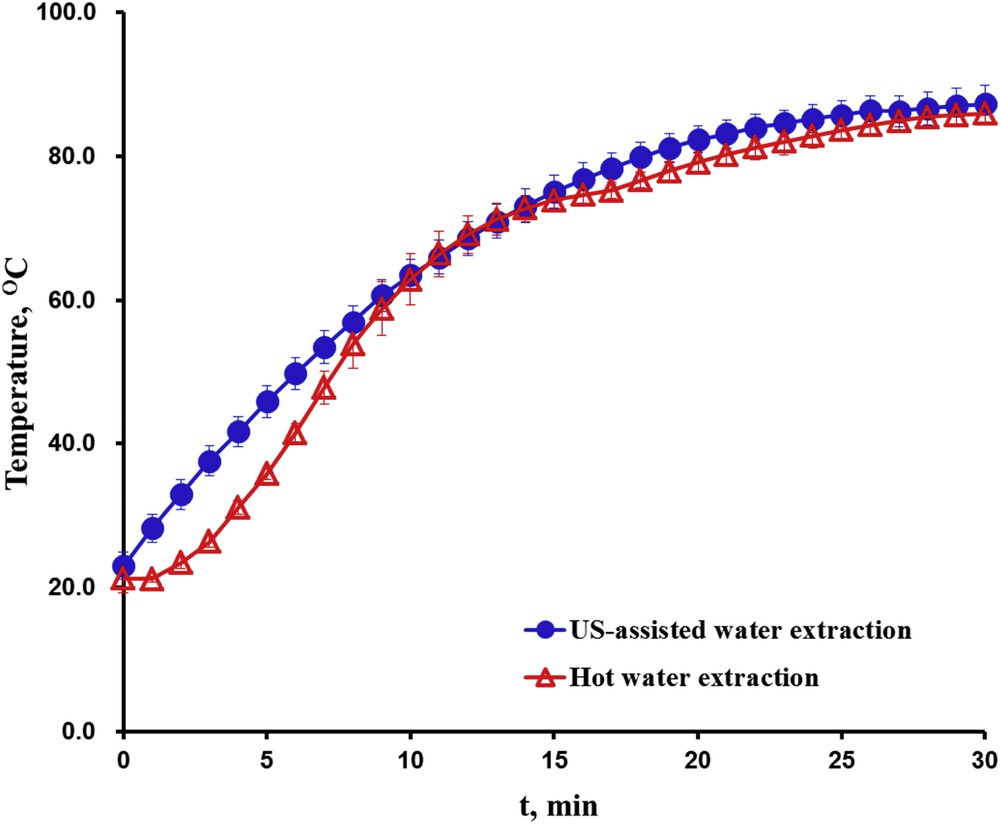
Temperature evolution during US-assisted water extraction and hot water extraction.
2.7 Determination of total polyphenol content
The total polyphenol content (Cpolyphenols) in the extracts was determined by the Folin–Ciocalteu method [28]. The supernatant samples were obtained by centrifugation at 5000 rpm for 5 min. Then, a 0.2 ml appropriately diluted extract was mixed with 1 ml of 10-fold diluted Folin-Ciocalteu reagent. After agitation and incubation in the dark for 5 min, 0.8 ml of sodium carbonate solution (75 g/L) was added to the mixture. After agitation, all test tubes were incubated in a water bath at 60 °C for 10 min and then cooled to room temperature. Absorbance was measured at 750 nm against a blank sample by using a spectrophotometer UV/Vis (Biochrom Libra S32, Cambridge, UK). Gallic acid (Sigma-Aldrich, France) was used as the standard for calibration, and the results of duplicate analyses were expressed as gram of gallic acid equivalent (GAE) per 100 g of dry matter (DM) (g GAE/100 g DM). The polyphenol extraction yield (Ypolyphenols, %) was calculated by using the following formula:
| (4) |
2.8 Determination of total protein content
The total protein content (Cproteins) in the extracts was measured by the modified Bradford method with bull serum albumin (BSA, Sigma–Aldrich, France) as the standard [29]. The supernatant samples were obtained by centrifugation at 5000 rpm for 5 min. Then, a 0.6 ml of appropriately diluted extract was mixed with 0.4 ml of the Bradford reagent. After agitation and incubation at room temperature for 5 min, absorbance was measured at 595 nm against a blank sample by using a spectrophotometer UV/Vis (Biochrom Libra S32, Cambridge, UK). The results of duplicate analyses were expressed as gram of BSA equivalent per 100 g of dry matter (DM) (g BSA/100 g DM). The protein extraction yield (Yproteins, %) was calculated by using the following formula:
| (5) |
2.9 Statistical analysis
All the experiments were repeated at least three times. Means and standard deviations were calculated and are presented in the figures as error bars. Fisher’s least Significant Difference (LSD) tests were applied for analysis of the effects of operating parameters. For each analysis, a significance level of 5% was assumed.
For the RSM, the software Design-Expert (version 7.0) was used for experimental design, data analysis, calculation of predicted responses, plots of response surfaces, and model building. Data from the Box–Behnken Design (BBD) were subjected to regression analysis in order to obtain mathematical parameters of the model. Three-dimensional response surfaces were plotted according to the fitted model by keeping two out of the four independent variables constant at level-coded zero. The adequacy and quality of the models were examined by evaluating the coefficient of regression R2 and the Fisher test value (F-value) obtained from the analysis of variance (ANOVA) executed by the software. Statistical significance of both the model and regression coefficients was established at p < 0.05.
3 Results and discussions
3.1 Polyphenol and protein recovery from mature rapeseed stems assisted by ultrasound treatment
3.1.1 Model fitting
An RSM approach was conducted in order to determine the combined effect of ultrasound power, treatment time, sample length, and agitation speed on the extraction of polyphenols and proteins from mature rapeseed stems assisted by ultrasound. In accordance with the experimental design, the experimental and predicted response values for polyphenol (Cpolyphenols) and protein contents (Cproteins) are indicated in Table 3.
Experimental and predicted values of polyphenol (Cpolyphenols) and protein content (Cproteins) in the mature rapeseed stem extracts by ultrasound treatment at various conditions.
| Experiments | Independent variables | Responses | ||||||
| Ultrasound power (W) | Treatment time (min) | Sample length (cm) | Agitation speed (rpm) | Cpolyphenols (g GAE/100 g DM) | Cproteins (g BSA/100 g DM) | |||
| Predicted | Experimental | Predicted | Experimental | |||||
| 1 | 200.0 | 60.0 | 1.5 | 0.0 | 0.055 | 0.050 | 0.013 | 0.010 |
| 2 | 200.0 | 32.5 | 1.5 | 300.0 | 0.040 | 0.040 | 0.020 | 0.020 |
| 3 | 0.0 | 32.5 | 0.5 | 300.0 | 0.035 | 0.050 | 0.030 | 0.030 |
| 4 | 200.0 | 32.5 | 2.5 | 600.0 | 0.035 | 0.030 | 0.017 | 0.020 |
| 5 | 200.0 | 5.0 | 1.5 | 0.0 | 0.000 | 0.010 | 0.007 | 0.010 |
| 6 | 200.0 | 32.5 | 0.5 | 600.0 | 0.061 | 0.030 | 0.027 | 0.030 |
| 7 | 200.0 | 32.5 | 0.5 | 0.0 | 0.046 | 0.030 | 0.029 | 0.030 |
| 8 | 200.0 | 60.0 | 1.5 | 600.0 | 0.075 | 0.080 | 0.017 | 0.010 |
| 9 | 200.0 | 60.0 | 2.5 | 300.0 | 0.065 | 0.070 | 0.021 | 0.020 |
| 10 | 200.0 | 5.0 | 1.5 | 600.0 | 0.008 | 0.030 | 0.010 | 0.010 |
| 11 | 200.0 | 32.5 | 1.5 | 300.0 | 0.040 | 0.040 | 0.020 | 0.020 |
| 12 | 200.0 | 5.0 | 2.5 | 300.0 | 0.004 | 0.010 | 0.010 | 0.010 |
| 13 | 400.0 | 32.5 | 0.5 | 300.0 | 0.170 | 0.200 | 0.033 | 0.030 |
| 14 | 200.0 | 32.5 | 2.5 | 0.0 | 0.020 | 0.030 | 0.009 | 0.010 |
| 15 | 200.0 | 32.5 | 1.5 | 300.0 | 0.040 | 0.040 | 0.020 | 0.020 |
| 16 | 400.0 | 60.0 | 1.5 | 300.0 | 0.200 | 0.190 | 0.025 | 0.030 |
| 17 | 0.0 | 32.5 | 1.5 | 600.0 | 0.025 | 0.030 | 0.013 | 0.010 |
| 18 | 400.0 | 32.5 | 1.5 | 600.0 | 0.140 | 0.140 | 0.016 | 0.020 |
| 19 | 0.0 | 32.5 | 2.5 | 300.0 | 0.038 | 0.020 | 0.010 | 0.010 |
| 20 | 400.0 | 5.0 | 1.5 | 300.0 | 0.060 | 0.030 | 0.014 | 0.010 |
| 21 | 200.0 | 32.5 | 1.5 | 300.0 | 0.040 | 0.040 | 0.020 | 0.020 |
| 22 | 200.0 | 60.0 | 0.5 | 300.0 | 0.092 | 0.090 | 0.031 | 0.030 |
| 23 | 400.0 | 32.5 | 2.5 | 300.0 | 0.110 | 0.110 | 0.023 | 0.020 |
| 24 | 0.0 | 32.5 | 1.5 | 0.0 | 0.020 | 0.020 | 0.005 | 0.000 |
| 25 | 0.0 | 60.0 | 1.5 | 300.0 | 0.021 | 0.030 | 0.012 | 0.020 |
| 26 | 200.0 | 5.0 | 0.5 | 300.0 | 0.030 | 0.030 | 0.030 | 0.030 |
| 27 | 0.0 | 5.0 | 1.5 | 300.0 | 0.040 | 0.030 | 0.010 | 0.010 |
| 28 | 200.0 | 32.5 | 1.5 | 300.0 | 0.040 | 0.040 | 0.020 | 0.020 |
| 29 | 400.0 | 32.5 | 1.5 | 0.0 | 0.110 | 0.110 | 0.018 | 0.020 |
The experimental values ranged from 0.01 to 0.20 g GAE/100 g DM for polyphenol content and from 0.00 to 0.03 g BSA/100 g DM for protein content. The results were then analysed by RSM. The regression coefficients of the mathematical models describing polyphenol and protein contents in the mature rapeseed stems extracts as a function of ultrasound power (X1), treatment time (X2), sample length (X3), and agitation speed (X4), are depicted in Table 4. The results of analysis of variance are also summarized in Table 4 to show the significance of regression coefficients, the goodness of fit, and adequacy and quality of the models.
Regression coefficients and statistical parameters describing the effect of the independent variables on the ultrasound-assisted extraction of polyphenols and proteins from mature rapeseed stems.
| Model term | Regression coefficients estimateda | |
| Cpolyphenols | Cproteins | |
| ß0 | 4.88 × 10⁻²*** | 3.58 × 10⁻²*** |
| ß1 | −2.95 × 10⁻⁴ *** | 1.65 × 10⁻⁵** |
| ß2 | −4.96 × 10⁻⁴ *** | 1.45 × 10⁻⁴* |
| ß3 | −1.96 × 10⁻² * | −3.30 × 10⁻²*** |
| ß4 | 4.29 × 10⁻⁵ | 3.75 × 10⁻⁵ |
| ß11 | 9.90 × 10⁻⁷*** | −4.17 × 10⁻⁸ |
| ß22 | 1.10 × 10⁻⁶ | −3.86 × 10⁻⁶ |
| ß33 | 7.08 × 10⁻³ | 5.83 × 10⁻³** |
| ß44 | −7.41 × 10⁻⁸ | −6.02 × 10⁻⁸** |
| ß12 | 7.27 × 10⁻⁶*** | 4.55 × 10⁻⁷ |
| ß13 | −7.50 × 10⁻⁵ | 1.25 × 10⁻⁵ |
| ß14 | 8.33 × 10⁻⁸ | −4.17 × 10⁻⁸ |
| ß23 | 0.00 | 9.09 × 10⁻⁵ |
| ß24 | 3.03 × 10⁻⁷ | 0.00 |
| ß34 | 0.00 | 8.33 × 10⁻⁴ |
| Adequacy of the mathematical model | ||
| R2 | 0.9256 | 0.8717 |
| F-value | 12.44 | 6.80 |
a Significance at *p < 0.05, **p < 0.01, ***p < 0.001.
As can be seen in Table 4, the experimental data showed a good fit with Eq. (3) since both regression models were statistically significant (p < 0.05) and adequate, as they presented relatively high values of the coefficient of regression (R2 ≥ 0.87). The model F-value of 12.44 for polyphenol content (Cpolyphenols) and 6.80 for protein content (Cproteins) also implied that the models were significant. There is only a 0.01% and 0.05% chance that a “Model F-value” this large can occur due to noise.
The p-values were utilized to evaluate the significance of each coefficient and the interaction effects between independent variables. For polyphenol extraction, both ultrasound power (X1) and treatment time (X2) presented a significant linear effect (p < 0.001) on the polyphenol content (Table 4). Meanwhile, ultrasound power (X1) also exhibited a significant quadratic effect and a significant interaction effect with treatment time (X2) (p < 0.001). Compared with ultrasound power (X1) and treatment time (X2), the effect of sample length (X3) was less significant (p < 0.05). No significant effect of agitation speed (X4) was observed on the polyphenol content (p > 0.05). For protein extraction, the sample length (X3) was the variable with the largest linear and quadratic effect on the protein content (p < 0.001), closely followed by the impact of ultrasound power (X1) (p < 0.01) and treatment time (X1) (p < 0.05). Agitation speed (X4) only exhibited a significant quadratic effect (p < 0.01).
3.1.2 Interpretation of the response surface model and contour plots
Taking into account only the significant factors and interaction effects (Table 4), three-dimensional (3D) response surface plots were built on the basis of the model equations mentioned in the preceding section to illustrate correlations between the independent and dependent variables that were considered. Each 3D response surface plot showed the effects of two out of the four independent variables on the response factor, keeping the third and the fourth ones at the central level (200 W, 32.5 min, 1.5 cm and 300 rpm for ultrasound power, treatment time, sample length, and agitation speed, respectively).
3.1.2.1 Effect of extraction variables on the polyphenol content
The effect of the four independent variables on polyphenol extraction from mature rapeseed stems is shown in Fig. 2. With regard to the combined influence exhibited by both ultrasound power and treatment time (Fig. 2a), the recovery of total polyphenols displayed a small increase when treatment time was increased from 5 to 60 min at the lowest ultrasound power. This linear effect became more noticeable as ultrasound power increased. As can be observed, the quadratic effect of the ultrasound power changed significantly, depending on the treatment time conditions. A small but steady increase in the polyphenol content with increasing ultrasound power was observed for a short treatment time. With the longest treatment time (60 min), the polyphenol content increased greatly and achieved the maximal value at the highest ultrasound power tested (400 W). This result is in agreement with the report of González-Centeno et al. [30], which highlights that the application of high ultrasound power for long treatment times may promote the required cell wall disruption, which facilitates solvent access to the polyphenol content in the grape pomace, thus intensifying the mass transfer rate.
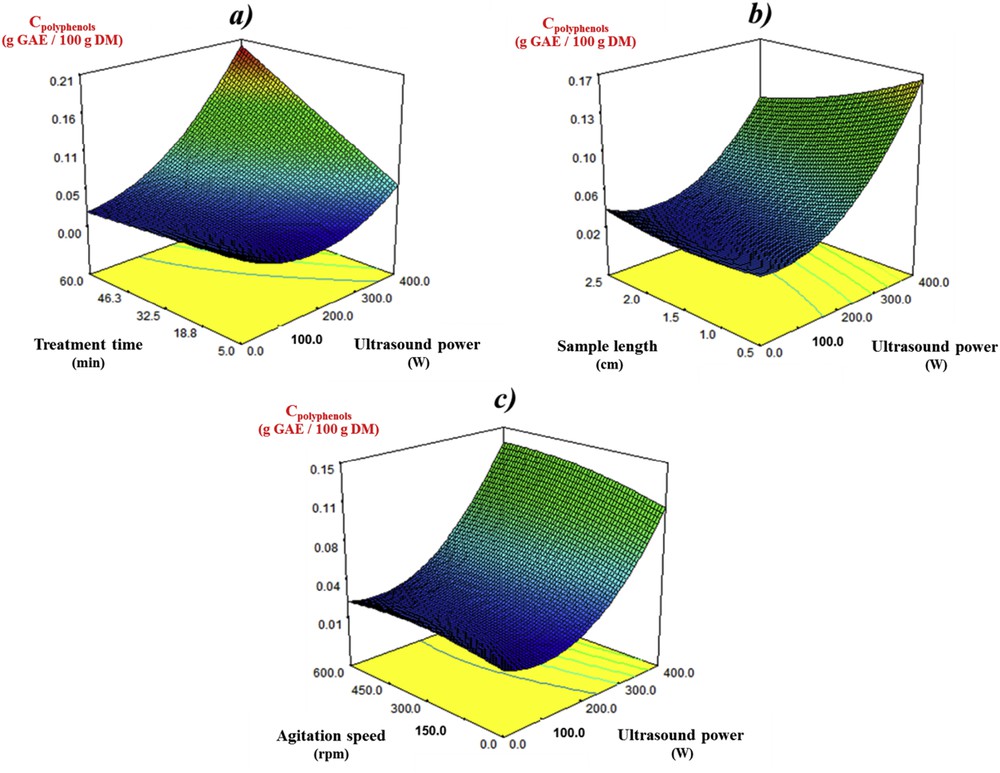
Response surface plots of the polyphenol content (Cpolyphenols) in the mature rapeseed stem extracts as affected by (a) ultrasound power and treatment time (sample length = 1.5 cm, agitation speed = 300 rpm); (b) ultrasound power and sample length (treatment time = 32.5 min, agitation speed = 300 rpm); (c) ultrasound power and agitation speed (treatment time = 32.5 min, sample length = 1.5 cm).
The trend observed for polyphenol recovery from mature rapeseed stems upon simultaneous variation of ultrasound power and sample length is depicted in Fig. 2b. The effect of ultrasound power changed significantly when the sample length varied from 0.5 to 2.5 cm. The polyphenol content in the extracts decreased with the increase of sample length at high ultrasound power. The experimental conditions needed to achieve greater polyphenol extraction shifted from medium to short sample length at the highest ultrasound power.
Finally, the plot of the polyphenol content as affected by varying ultrasound power and agitation speed (Fig. 2c) indicates that the linear influence of the ultrasound power was not significantly affected when the agitation speed moved from 0 to 600 rpm.
From the three figures mentioned above, it was apparent that high ultrasound power levels in combination with long treatment time and medium to short sample strength may be favorable for polyphenol recovery from mature rapeseed stems assisted by ultrasound treatment.
3.1.2.2 Effect of extraction variables on protein content
The effect of the four independent variables on the proteins extraction from mature rapeseed stems is shown in Fig. 3. With regard to the combined influence exhibited by both ultrasound power and treatment time (Fig. 3a), the protein content in the extracts increased, then slightly decreased after 32.5–35 min of ultrasound treatment at low powers. This was probably caused by the imprecision of the mode or the instability of proteins at increased surrounding temperature. Increasing the ultrasound power could prevent such an undesirable decrease. This may be further explained by the supposed enhanced extraction of transmembrane proteins under high power ultrasound which are more thermally stable than the water-soluble ones [31]. The linear effect of ultrasound power became more significant as the treatment time increased, which was found to be following a similar trend to that of polyphenol extraction.
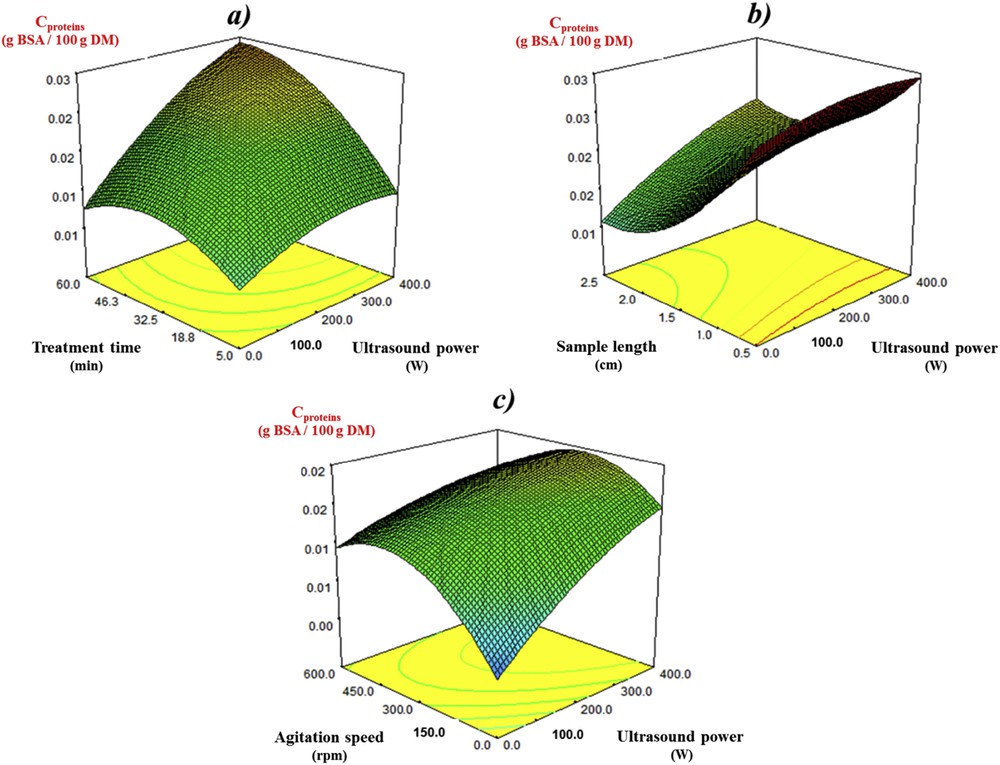
Response surface plots of the protein content (Cproteins) in the mature rapeseed stem extracts as affected by (a) ultrasound power and treatment time (sample length = 1.5 cm, agitation speed = 300 rpm); (b) ultrasound power and sample length (treatment time = 32.5 min, agitation speed = 300 rpm); (c) ultrasound power and agitation speed (treatment time = 32.5 min, sample length = 1.5 cm).
The results concerning the effect of ultrasound power and sample length suggested that a decrease of sample length at both low and high ultrasound power affected the recovery of proteins more positively than the recovery of polyphenols (Fig. 3b). The authors assume that the importance of sample length for proteins extraction might be caused by their high molecular weight. According to the literature, the molecular weight of Profilin, Albumin, and RubisCO, the most common proteins in plants, is 15 kDa, 65 kDa, and 540 kDa, respectively [32]. Therefore, the diffusion of proteins in the mature rapeseed stems might have taken place preferably in the longitudinal direction, through two cross-sections of the cylinder-shaped rapeseed stems. The decrease of the sample length might thus help to reduce the time for proteins to reach the two cross-sections. In contrast, the molecular weight of condensed tannins, one of the main phenolic compound groups found in rapeseed, is much lower (0.5–3 kDa) [33]. The diffusion of polyphenols might have occurred in both transverse and longitudinal directions, and was less affected by sample length than diffusion of proteins. At the same time, the linear effect of ultrasound power on the protein extraction became more significant as sample length decreased.
The plot of protein content as affected by ultrasound power and agitation speed is depicted in Fig. 3c. In contrast to polyphenols recovery, the quadratic effect of the agitation speed was significant (p < 0.01). For this reason, although the linear effect of agitation speed was not significant, these two variables exhibited a curve effect indicating that the increase of agitation speed might also facilitate the recovery of proteins from mature rapeseed stems. However, a slight decrease of protein content in the extracts can be observed when agitation speed was higher than 300 rpm. A similar result was reported by Kumoro et al. [34] when they studied the extraction behavior of collagenous protein from chicken bone waste. They assumed that when the agitation speed was too high, the samples moved together with the solvent at a very close angular velocity rate. Since the relative velocity between the sample and solvent was then very low, the physical and chemical interactions between the two substances became less effective. Therefore, the use of moderate agitation speed might be more efficient for the recovery of proteins from mature rapeseed stems compared with the other agitation speeds studied.
3.1.3 Process optimization by RSM
The objective of this procedure is to determine the optimal conditions that would allow obtaining an extract with a high content of polyphenols and proteins from mature rapeseed stems. Derringer’s desirability function was used to find optimal compromises among the significant factors and interaction effects taken into account [35]. This algorithm varies on a scale of 0–1, where 0 represents a completely undesirable response, and 1 the most desirable one. The optimal conditions were obtained on the basis of the model prediction for the highest global desirability value by maximizing the response factors. Specifically, a global desirability value of 0.996 was obtained when applying 396.05 W of ultrasound power on mature rapeseed stems of 0.51 cm length during 51.20 min under agitation at 236.22 rpm. Under these optimal conditions, ultrasound-assisted extraction of mature rapeseed stems would achieve a maximum of 0.21 g GAE/100 g DM for polyphenol content and 0.035 g BSA/100 g DM for protein content (predicted values). Table 5 shows the predicted and experimental values of the response under optimal extraction conditions. When obtaining the experimental values, the optimal conditions were slightly adjusted due to practical constraints. The results indicate a good agreement between the predicted and experimental values, reflecting the validity of the model for improved recovery of polyphenols and proteins from mature rapeseed stems.
Predicted and experimental values of the responses at optimum conditions.
| Optimum extraction conditions | Responses | |||||
| Ultrasound power (W) | Treatment time (min) | Sample length (cm) | Agitation speed (rpm) | Cpolyphenols (g GAE/100 g DM) | Cproteins (g BSA/100 g DM) | |
| Predicted value | 396.05 | 51.20 | 0.51 | 236.22 | 0.210 | 0.035 |
| Experimental value | 400.00 | 50.00 | 0.50 | 250.00 | 0.207 | 0.034 |
The polyphenol and protein contents in the extracts after optimization correspond to an extraction yield of 86% and 11%, respectively. Authors assume that the low extraction yield of proteins might be caused by their high molecular weight, which blocks their transfer through the cell membranes. Another possible reason may be protein coagulation due to long-time exposure to an average surrounding temperature of 67.8 °C during the ultrasound treatment [36]. High temperatures (above 50 °C) can also result in degradation of polyphenols extracted from rapeseed stems (about 20% in 1 h) [36], which should be carefully taken into consideration for ultrasound treatment in future studies.
3.2 Polyphenol and protein recovery from immature rapeseed stems assisted by ultrasound pretreatment
Based on our previous study [26], immature rapeseed stems before flowering contain higher polyphenol and protein content than mature ones (Table 6). Hardy [37] and Sincik et al. [38] have also noted such diminution of extractives as rapeseed maturity progressed. Meanwhile, the cell membranes of immature rapeseed stems may be relatively thinner, which facilitate the mass transfer from cellular tissue to surroundings [26]. For this reason, the treatment time of ultrasound was reduced to 5, 10, 20, and 30 min for immature stems, and a supplementary extraction without sonication was conducted. The same conditions of ultrasound power (400 W), liquid to solid ratio (r = 8), sample length (l = 0.5 cm), and agitation speed (v = 250 rpm) were applied to all the aforementioned experiments.
Comparison of polyphenol and protein contents between immature and mature rapeseed stems.
| Immature stems | Mature stems | |
| Polyphenol content (Cpolyphenols g GAE/100 g DM) | 0.44 | 0.24 |
| Protein content (Cproteins g BSA/100 g DM) | 2.01 | 0.31 |
Fig. 4a presents extraction kinetics of polyphenols from rapeseed stems after ultrasound pretreatment. It can be observed that a 5 min ultrasound pretreatment (when temperature was comprised between ambient and 45.8 °C) followed by a 85 min water extraction stage had no effect on the polyphenol extraction as compared to control. The authors assume that such short-time ultrasound treatment (5 min) may not be sufficient to induce the necessary structural changes of rapeseed cell membranes and increase the membrane permeability. The increase of treatment time from 5 min to 10 min resulted in a significant increase in the polyphenols extraction yield (9.6 vs. 30.6%), however the temperature of the system was also higher (45.8 vs. 63.5 °C). In addition, 10 min of ultrasound pretreatment followed by 70 min of water extraction led to the same polyphenol yield as grinded samples. Further increase of treatment time (from 10 min to 20 or 30 min) can lead to such satisfactory polyphenols yield with shorter durations of water extraction, but the energy consumption needs to be significantly higher (667 kJ/kg for 10 min, 1333 kJ/kg for 20 min and 2000 kJ/kg for 30 min).
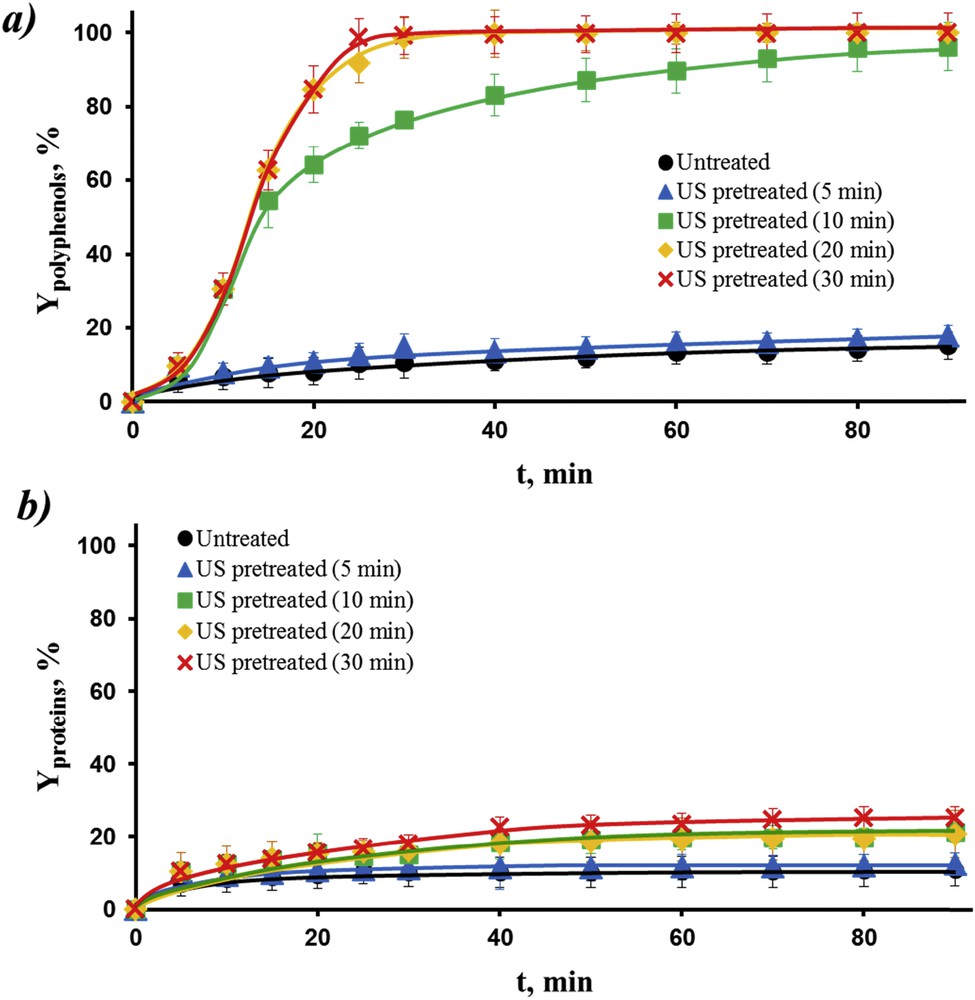
Extraction kinetics of polyphenols (a) and proteins (b) from immature rapeseed stems after ultrasound (US) pretreatment under optimal conditions obtained by RSM for 0, 5, 10, 20, and 30 min. After US pretreatment, the ultrasonic processor was switched off while the extraction was kept for another 60–90 min.
In the case of protein extraction (Fig. 4b), the highest yield (23%) was obtained by a 30 min ultrasound treatment followed by a 10 min water extraction stage. Compared with mature rapeseed stems, immature rapeseed stems present not only higher extract contents, but also higher extraction yields (polyphenols: 100 vs. 86%; proteins: 23% vs. 11%) with lower energy consumption (2000 vs. 3333 kJ/kg).
3.3 Performance comparison of ultrasound-assisted extraction and conventional extraction techniques
To better understand the advantages of ultrasound technique, the performance of ultrasound-assisted water extraction was compared to two conventional extraction methods including cold and hot water extraction without ultrasound treatment. For ultrasound-assisted water extraction, the ultrasound power was set at 400 W. The same conditions of liquid to solid ratio (r = 8), sample length (l = 0.5 cm) and agitation speed (v = 250 rpm) were applied to all the aforementioned extractions.
As shown in Fig. 5a, no significant difference in polyphenol extraction yield was observed among the three extraction methods in the first 5 min of extraction. After 10 min of ultrasound treatment, when temperature was increased from 45.8 °C to 63.5 °C, the obtained polyphenol extraction yield was almost 3 times higher (30.6 vs. 11.1%) than that obtained after 10 min of hot water extraction with a similar temperature evolution. The authors assume that such difference of extraction yield can be attributed to the cavitation effect induced by ultrasound. The polyphenol extraction yield obtained after longer treatment time (t = 15 min, T = 73.9 °C, t = 20 min, T = 82.3 °C, t = 25 min, T = 85.7 °C, t = 30 min, T = 87.2 °C) was always higher than that obtained by hot water extraction with a similar temperature evolution. At the end of the 30 min extraction stage, the polyphenol yields for ultrasound-assisted water extraction and hot water extraction were 99% and 70%, respectively. This result implies that the cavitation effect begins to play an important role in the increase of polyphenol extraction yield after 10 min of treatment, and the effect can last until 30 min of treatment even though the surrounding temperature was high. Compared with hot water extraction, ultrasound-assisted water extraction also allowed us to double the protein extraction yield at the end of the 30 min extraction (18 vs. 9%) (Fig. 5b). Furthermore, the extraction yields of polyphenols and proteins obtained from cold water extraction were always the lowest during the 30 min of extraction. These results clearly demonstrate that ultrasound-assisted extraction is a competitive and effective extraction technique for valorization of rapeseed green biomass, especially by recovery of polyphenols. For recovery of proteins, Coustets et al. [39] reported that the addition of lytic enzyme to the electropermeabilised cells allowed for an enhancement in the protein release by 20%, which suggests a very interesting topic for further research.

Performance comparison of US-assisted water extraction, cold and hot water extraction in terms of extraction kinetics of polyphenols (a) and proteins (b) from rapeseed stems. All the aforementioned extractions were conducted under optimal conditions obtained by RSM.
Ultrasound-assisted extraction could also be used to recover extracts from by-products on a pilot or industrial scale. Virot et al. [40] have verified the possibility of the process scale-up by comparing the performance of ultrasound-assisted extraction carried out in a 30-L extraction tank with that in a 3 L one. They showed that both reactors presented the same extraction yield of polyphenols from apple pomace, which was confirmed later by Pingret et al. [41].
4 Conclusions
The results of this study demonstrate the efficiency of the ultrasound technique for the valorization of extractives (polyphenols and proteins) from two types of rapeseed green biomass by aqueous extraction. For mature rapeseed stems collected around the time of harvest, Response Surface Methodology was used to optimize the experimental conditions such as ultrasound power, treatment time, sample length, and agitation speed. For immature rapeseed stems used as cover crop, the possibility of using ultrasound as a pretreatment method was confirmed due to their less fibrous structures. Compared with mature stems, immature stems present a potentially high interest with higher extraction yield and lower energy consumption. In addition, the ultrasound technique proved to be more effective than the conventional hot water extraction method during extract recovery from rapeseed stems, as shown in a performance comparison. Overall, all these results can provide useful information for designing, optimizing, and scaling up the ultrasound-assisted extraction process for the valorization of by-products generated from rapeseed oil refineries.
Acknowledgment
This work was performed, in partnership with the SAS PIVERT, within the frame of the French Institute for the Energy Transition (Institut pour la Transition Énergétique (ITE) P.I.V.E.R.T. (www.institut-pivert.com) selected as an Investment for the Future (“Investissements d'Avenir”). This work was supported, as part of the Investments for the Future, by the French Government under the reference ANR-001-01. We also thank Dr. Samo Mahnic-Kalamiza for providing English language correction and improvement.