

1 Introduction
Fossil oil resources are of great importance because they generate significant amounts of energy, nevertheless their production and use have significant environmental and health impacts, including global warming, environmental pollution, and degradation [1,2]. In addition, the global fluctuation in petroleum prices and the emission of greenhouse gases have necessitated the search for alternative fuel from renewable sources [1–3]. Biodiesel appears to be the most attractive alternative because it is nontoxic, renewable, and environment-friendly that can substitute fossil-based fuel [4,5]. The production cost of biodiesel regarding the source of feedstock is the major drawback for its commercialization [3–5]. In recent years, researchers have focused on use of various abundantly available resources and economical production technique to make biodiesel-based fuel more competitive relative to petroleum-based fuels.
Biodiesel is commonly produced by transesterification of vegetable oils and alcohol in the presence of a suitable homogeneous or heterogeneous catalyst. There are several shortcomings to the use of the homogeneous catalysts, including the difficulty in product isolation [1,6]. To overcome the soap formation, huge amounts of wastewater, and environmental pollution during the production of biodiesel, researchers have focused on heterogeneously catalyzed transesterification [4–8].
Unlike the homogeneous catalysts, the heterogeneous catalysts can be easily recovered, regenerated, and reused and thus known to be eco-friendly [8]. A variety of solid-based heterogeneous catalysts such as alkali-earth metal oxides (CaO, MgO, SrO, and BaO), transition metal oxides (ZrO, TiO, and ZnO), and zeolite were used in the transesterification reactions without the presence of free fatty acid (FFA) and water [6,8,9]. These catalysts are less corrosive, react faster, and have higher activity as compared to solid acid catalysts [8]. However, they are unfavorable for feedstock with high FFAs and moisture content leading to saponification and hydration, respectively [8–10]. To mitigate the saponification issues during base-catalyzed transesterification, a two-step method is often used [11]. However, the two-step method increases system complexity and the cost of production [8–10].
The present work is focused on exploiting crude neem oil as a source of biodiesel production via a single-stage transesterification in the presence of potassium fluoride–enhanced eggshell catalyst. Here, the heterogeneous catalyst was prepared from adequately available eggshells. The recyclability and efficiency of the as-prepared eggshell-based catalyst were enhanced via the integration of magnetite (Fe3O4) nanoparticles. Predictive modeling and optimization of parameters were achieved using the response surface methodology and the artificial neural network (ANN). This is the first report on the single-stage transesterification behavior of KF/eggshell–Fe3O4 (MKEC) for neem, Jatropha, and waste cooking oils having high FFA (2.3–6.6%). Finally, leaching test, acid tolerance, and reusability of the KF/eggshell–Fe3O4 mesoporous catalysts were studied.
2 Materials and methods
2.1 Materials
Spent eggshells were collected from restaurants within the main campus of the Ahmadu Bello University, Nigeria. Samples of neem oil of varying FFA contents (0.49–6.6%), jatropha (FFA, 5.8%), and waste cooking oils (FFA, 3.16%) were provided by the National Research Institute for Chemical Technology, Zaria, Nigeria. Potassium fluoride (KF, 98.9%), absolute methanol (chromatography grade, 99.5%), and calcium oxide (CaO, 99%) were all analytical grade reagents and purchased from Sigma–Aldrich. Iron(III) chloride hexahydrate (FeCl3·6H2O, 98%), iron(II) tetrahydrate (FeCl2·4H2O, >99.5%), and ammonium hydroxide (NH4OH, 99%) were supplied by Merck. Analytically pure reagents were used without further purification.
2.2 Catalyst preparation
Collected eggshells were thoroughly rinsed with deionized water and air dried at ambient conditions. Five hundred grams of dried eggshells were subjected to calcination (900 °C for 2 h)–hydration–dehydration (105 °C for 24 h) procedures [7] to transform the calcium species in the eggshell into highly active CaO particles. The nonmagnetic catalyst was prepared by the impregnation method followed by calcination [12]. Typically, powdered dehydrated eggshells were impregnated with an appropriate amount of KF (0.1 M) solution (29 wt %) followed by homogenization for 1 h. The slurry formed was oven-dried at 105 °C for 6 h, and the resultant precursor (KF/eggshell (KEC)) was then calcined at 600 °C for 2 h and kept in the desiccator for later use. For the magnetic catalyst, the magnetite (Fe3O4) synthesized via coprecipitation method [13] was fully mixed with the dehydrated eggshell in a ratio of 1:20. The well-mixed powder was then impregnated with 29 wt % aqueous solution of KF and calcined as described above to obtain KF/eggshell–Fe3O4 (MKEC).
2.3 Characterization of catalysts and properties of crude oils
The morphology and elemental chemical contents of the synthesized catalysts were measured by Hitachi S-4500 field emission scanning electron microscopy equipped with a Quartz PCI XOne SSD X-ray analyzer (Hitachi, Japan). The X-ray diffraction (XRD) analysis was performed using a Shimadzu XRD-6000 diffractometer (Shimadzu, Japan) at room temperature. Cu kα radiation (λ = 0.15406 nm) in a 2θ scan range of 10–90° was used for all samples. The surface area, pore size, and volume of the samples were obtained using the Quantachrome Nova 4200e analyzer (Quantachrome Instruments, USA). Before measurements, all samples were degassed overnight under vacuum. Shimadzu GC–MS-QP2010 PLUS machine was used for the characterization of the biodiesel produced, its fuel properties were characterized and compared with the American Standards and Testing Methods (ASTM) standards. The physicochemical properties of the oils (neem, Jatropha, and waste cooking oil) were determined according to the ASTM and ISO standards and used for the transesterification reaction without further purification.
2.4 Transesterification reaction procedure
The MKEC was used during the transesterification process to investigate its activities and efficacy as compared with KEC. The transesterification of the neem seed oil was carried out using a 250 mL two-necked flask equipped with a condenser and a magnetic stirrer in a water bath as previously described with some modifications [1,9]. Appropriate amounts of neem oil, methanol, and MKEC catalyst were introduced into the reaction flask and stirred.
Specifically, for the optimum biodiesel yield, 23 g of the pretreated neem oil (0.026 mol, calculated from the average molecular weight of the oil), 1:12 neem oil/methanol ratio, 5 wt % MKEC, and reaction time and temperature of 1.5 h and 65 °C, respectively, were used. The experiment was stirred at 400 rpm and refluxed using a water-cooled condenser. After the completion of the reaction, the KEC was separated by filtration, and the transesterification products were allowed to settle (24 h) for the clear separation of glycerol and biodiesel. The biodiesel layer was decanted, washed in warm water, and oven dried. The methyl ester contents of the samples were quantitatively analyzed using Agilent Cary 630 FTIR and Shimadzu GC–MS-QP2010 PLUS as described elsewhere [10]. The transesterification reaction was repeated to determine the catalytic stability of the catalyst, and the physicochemical properties of the as-prepared biodiesel were measured and compared with the ASTM standards of biodiesel. The FAME yield (%) was evaluated using Eq. (1):
| (1) |
The experiments were repeated three times, and the average value for the measured data was used.
3 Experimental design for optimum biodiesel yield
3.1 Response surface methodology
High yield of biodiesel is desired; thus, it is necessary to find optimal conditions that maximize desirability function of the yield. Hence, the Design expert software 10.1 (Stat-Ease, USA) was used to generate the 5-level-4-factor central composite design (CCD) matrix. The CCD is an efficient approach for modeling complex problems in which the responses are influenced by different variables [14–16]. The CCD was used to evaluate the effect of process variables during the conversion of oil to FAME. The independent factors with actual and coded levels of each factor are presented in Table 1. The independent factors were coded into two levels, namely, high (+1) and low (−1), whereas the axial points are coded as (+α) and (−α). The total amount of experiment generated from the response surface methodology is 28, obtained according to Eq. (2):
| (2) |
Experimental design matrix with experimental and predicted values.
| Independent variables | Units | Coding | Level of factors | |||||
| −α (−2) | −1 | 0 | 1 | α (2) | ||||
| Catalyst amount | wt % | A | 2 | 3 | 4 | 5 | 6 | |
| Methanol/oil molar ratio | mol/mol | B | 6 | 9 | 12 | 15 | 18 | |
| Reaction time | h | C | 1 | 1.5 | 2 | 3 | 3.5 | |
| Reaction temperature | °C | D | 50 | 55 | 60 | 65 | 70 | |
| Std. order | Type | A | B | C | D | FAME yield (%) | ||
| CCD | ANN | Experimental | ||||||
| 1 | Center | 0 | 0 | 0 | 0 | 79.2 | 81.3 | 81.3 |
| 2 | Center | 0 | 0 | 0 | 0 | 78.3 | 78.3 | 82.6 |
| 3 | Center | 0 | 0 | 0 | 0 | 80.5 | 82.1 | 81.4 |
| 4 | Center | 0 | 0 | 0 | 0 | 82.6 | 82.6 | 78.6 |
| 5 | Axial | −2 | 0 | 0 | 0 | 77.5 | 78.0 | 76.2 |
| 6 | Axial | 2 | 0 | 0 | 0 | 89.5 | 90.1 | 89.3 |
| 7 | Axial | 0 | −2 | 0 | 0 | 71.1 | 72.9 | 72.0 |
| 8 | Axial | 0 | 2 | 0 | 0 | 96.6 | 95.7 | 94.2 |
| 9 | Axial | 0 | 0 | −2 | 0 | 76.3 | 75.2 | 75.1 |
| 10 | Axial | 0 | 0 | 2 | 0 | 88.5 | 89.2 | 88.1 |
| 11 | Axial | 0 | 0 | 0 | −2 | 77.5 | 78.0 | 77.6 |
| 12 | Axial | 0 | 0 | 0 | 2 | 87.2 | 88.0 | 88.3 |
| 13 | Factorial | 1 | 1 | 1 | 1 | 98.0 | 96.9 | 96.0 |
| 14 | Factorial | −1 | 1 | 1 | 1 | 90.0 | 91.1 | 91.1 |
| 15 | Factorial | 1 | −1 | 1 | 1 | 87.1 | 88.2 | 87.2 |
| 16 | Factorial | −1 | −1 | 1 | 1 | 81.8 | 83.4 | 81.2 |
| 17 | Factorial | 1 | 1 | −1 | 1 | 89.0 | 89.2 | 90.1 |
| 18 | Factorial | −1 | 1 | −1 | 1 | 86.6 | 87.7 | 88.1 |
| 19 | Factorial | 1 | −1 | −1 | 1 | 79.1 | 79.9 | 80.1 |
| 20 | Factorial | −1 | −1 | −1 | 1 | 73.1 | 75.0 | 74.2 |
| 21 | Factorial | 1 | 1 | 1 | −1 | 92.4 | 92.0 | 92.1 |
| 22 | Factorial | −1 | 1 | 1 | −1 | 90.0 | 92.2 | 91.2 |
| 23 | Factorial | −1 | −1 | 1 | −1 | 74.5 | 75.7 | 75.3 |
| 24 | Factorial | 1 | 1 | −1 | −1 | 89.0 | 89.2 | 90.0 |
| 25 | Factorial | −1 | 1 | −1 | −1 | 83.0 | 84.8 | 85.1 |
| 26 | Factorial | 1 | −1 | −1 | −1 | 71.7 | 78.6 | 71.0 |
| 27 | Factorial | −1 | 2 | −1 | −1 | 96.6 | 95.9 | 94.0 |
| 28 | Factorial | 0 | 1 | 0 | 0 | 97.0 | 97.1 | 95.3 |
The factorial design comprises 24 full factorials, eight axial points, and four repeated runs, which resulted in an orthogonal distribution of 28 experiments. The experiments were run randomly to minimize systematic errors. The data obtained from the experimental design were used to generate a polynomial equation and thereafter subjected to the analysis of variance (ANOVA). The ANOVA was used to determine the statistical significance of the regression model and the model terms. At 95% confidence level, the P values less than 5% represent significant effects on the parameters [13–15].
3.2 ANN modeling
The experimental yield and CCD predicted values were used for network training using the MATLAB R2017a software (MathWorks, Inc., USA) as earlier reported [17]. In the present study, a three-layered feed-forward neural network with logsig transfer function at a hidden layer and a linear transfer function (purelin) at an output layer was used. To minimize network error, numerical overflows, and achieve higher homogeneous results, inputs and outputs were normalized in the range of 0–1 using Eq. (3):
| (3) |
The normalized value is Ynom, where Y, Ymax, and Ymin represent the actual, maximum, and minimum values, respectively.
Sixty-five percent of the data was trained; 20% was validated, and rest set was used as testing data. The number of neurons was optimized between 2 and 22 neurons in the hidden layer, and nine different backpropagation (BP) training algorithms were evaluated to determine the best BP. Herein, the Levenberg–Marquardt BP algorithm was selected because of its very high degree of correlation (R2 = 0.996) and the least mean square error (0.00256). In addition, eight neurons were adopted as the optimum number of neurons in the hidden layer because of its least mean square error value of 0.119, and the optimized ANN architecture is shown in Fig. 1.
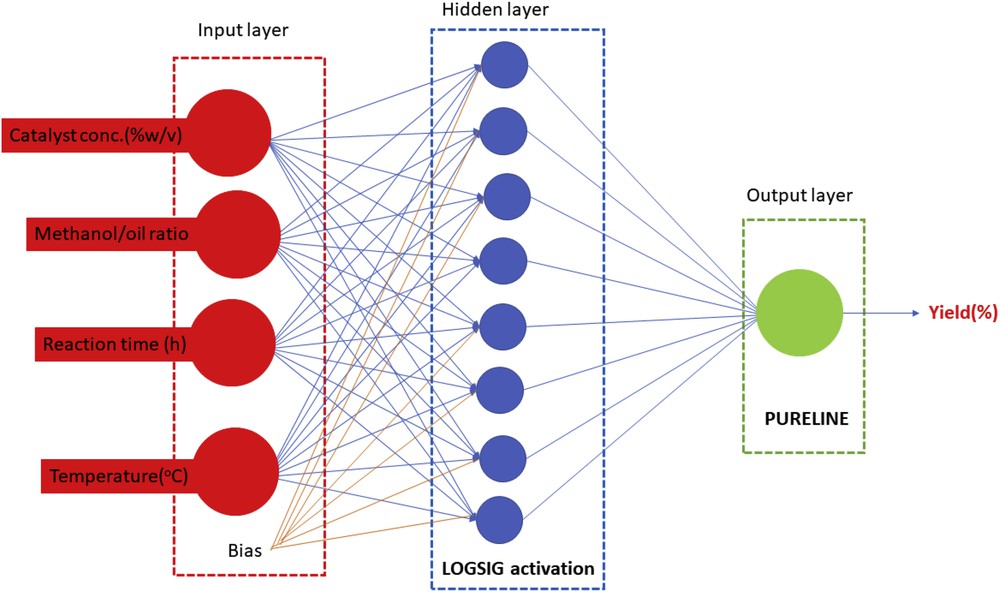
Schematic architecture of the optimized ANN structure for biodiesel production from neem oil.
The comparative importance of each input variable was computed as described in our previous reports [13,17]. To evaluate the prediction accuracy and suitability of the constructed models (CCD and ANN), error analyses such as correlation coefficients (R2), relative percent deviation (RPD), and standard error of prediction (SEP) were investigated using the formulas described elsewhere [6].
4 Results and discussion
4.1 Characterization of catalysts and eggshells
The XRD profiles of raw eggshell, calcined eggshell, KEC, and MKEC, respectively, are shown in Fig. 2. The phase transformation, crystallite size, and shape of the samples were obtained from the XRD results and are indicated in Table 2. For the raw eggshell (Fig. 2a), the most intense diffraction peak was seen at 2θ = 29.32° having a crystalline plane of (104). The other typical peaks were noted at 35.95° (110), 39.37° (113), and 43.08° (202), which were attributed to the crystal of calcite (CaCO3) (according to the JCPDS card number: 01-085-1108; R-3c). Upon calcination of the calcite, a complete transformation of the CaCO3 into CaO was observed (Fig. 2b). The typical peaks of the CaO were observed at 2θ = 32.03° (111), 37.26° (200), and 53.71° (220). These peaks matched precisely with those reported by Hu et al. [18].
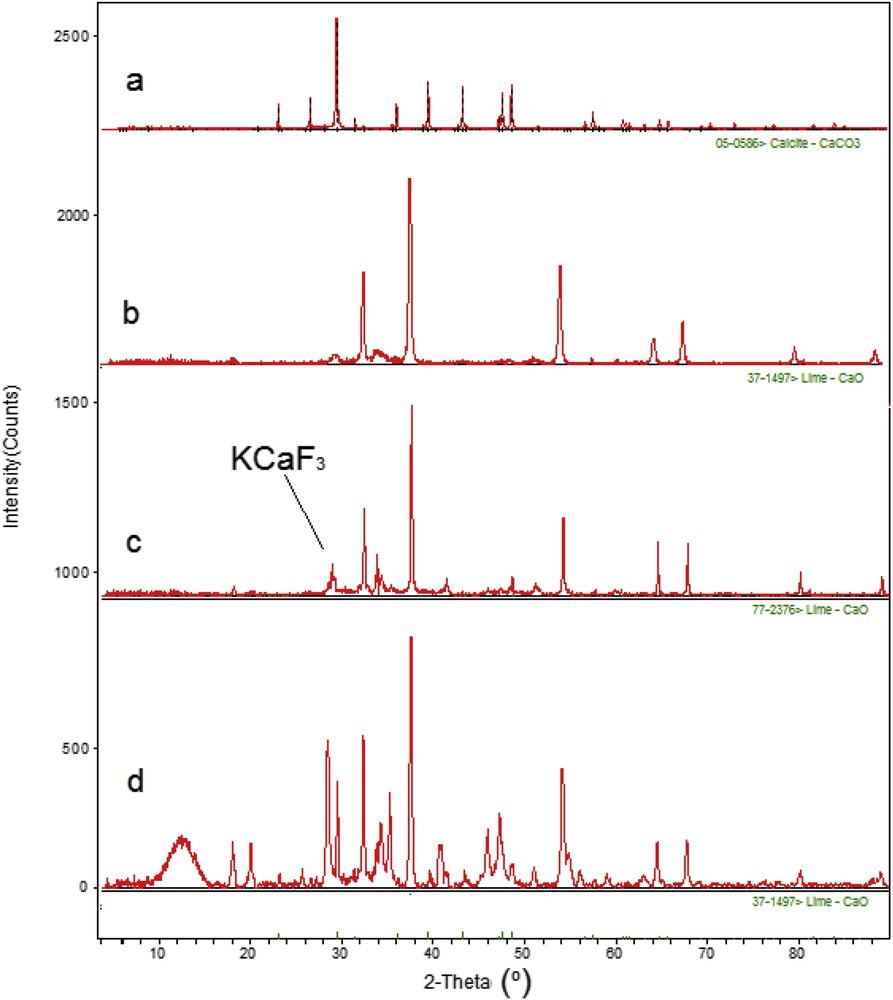
XRD patterns of (a) raw eggshell, (b) calcined eggshell, (c) KEC catalyst, and (d) MKEC catalyst.
Crystallite sizes and shapes of the samples.
| Samples | Crystallinity (%) | Crystal size (nm) | Crystal Shape |
| Eggshell | 94.2 | 99.9 | R-centered hexagonal |
| Calcined eggshell | 91.9 | 83.5 | Face-centered cubic |
| KEC | 86.8 | 79.4 | R-centered hexagonal |
| MKEC | 98.4 | 108.4 | Orthorhombic |
The phase transformation of the nonmagnetic catalyst (KEC) indicated that two major phases (CaO and KCaF3) are present in the catalyst (Fig. 2c). The KCaF3 peaks are distinctly noticed at 2θ = 20.14° (101), 30.05° (121), 34.89° (102), and 54.51° (311). The KCaF3 peaks were produced during the impregnation of KF, and thus enhanced the catalytic activity and improved saponification resistance of the KEC [18,19]. The KCaF3 peaks were consistent with the standard pattern reported in JCPDS file (3567). Obviously, the peaks are sharp with broad base indicating ultrafine nature and small crystallite size of the particles. No obvious peaks of Ca(OH)2 and KF were observed in the XRD of the KEC catalyst. Fig. 2d shows the XRD pattern of the KF/eggshell–Fe3O4 (MKEC) catalyst with intense peaks of CaO and KCaF3. Furthermore, four peaks that can be assigned to the diffraction of (311), (400), (422), and (511) planes of the cubic Fe3O4 emerged, confirming the formation of the Fe3O4 [20]. The crystallite sizes, Dhkl, of the samples were evaluated using the Shimadzu XRD-6000 diffractometer and are presented in Table 2.
The morphologies of the samples are shown in Fig. 3. The micrograph of the eggshell in Fig. 3a shows irregular agglomerates of rough bump-like particles of eggshell. The morphology conforms to those reported by Tan et al. [21] and Zhang et al. [22]. The elemental compositions of the eggshell were further analyzed by energy-dispersive X-ray spectroscopy (EDS) spectrum. It confirmed that the eggshell was composed of C, Ca, O, Na, Sr, and Mg (Fig. 4a). The amounts of Ca and O in the eggshell were found to be 51.18 and 37.02 wt %, respectively. After calcination at optimal conditions, a nearly uniform morphology of the eggshell was observed comprising small and big distinctive cubical-like particles with definite structure (Fig. 3b). The EDS analysis indicated that the Ca content of the calcined eggshell increased to 58.78 wt %, whereas the O content reduced to 30.56 wt %, and 18% reduction in the C content was also obtained (Fig. 4b), which is in line with the obtained XRD data.
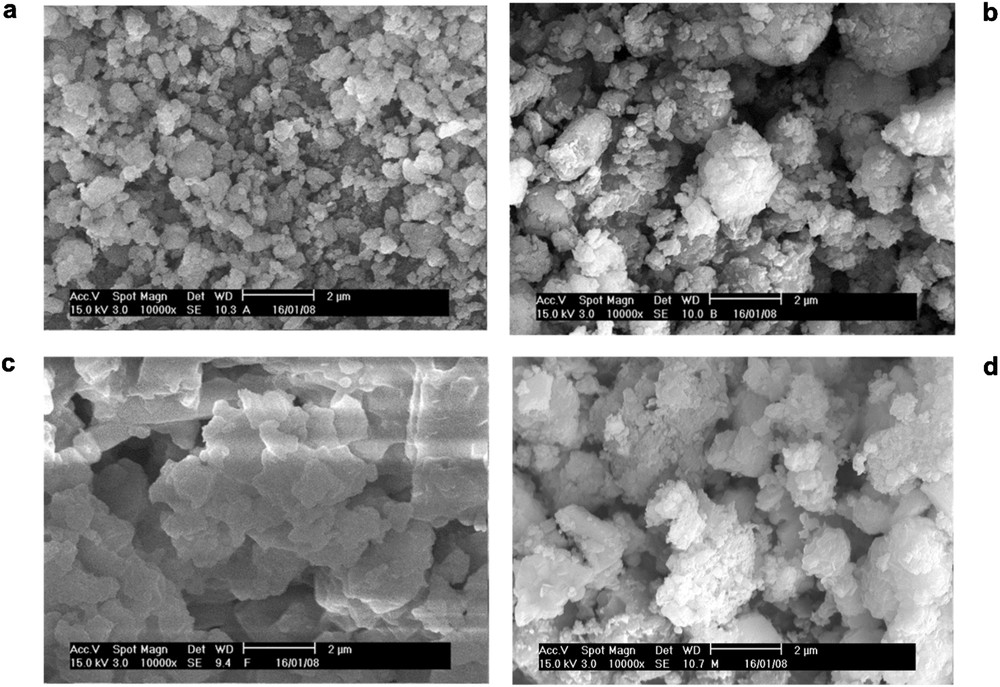
Scanning electron microscopy images of (a) raw eggshell, (b) calcined eggshell, (c) KEC, and (d) MKEC catalyst.
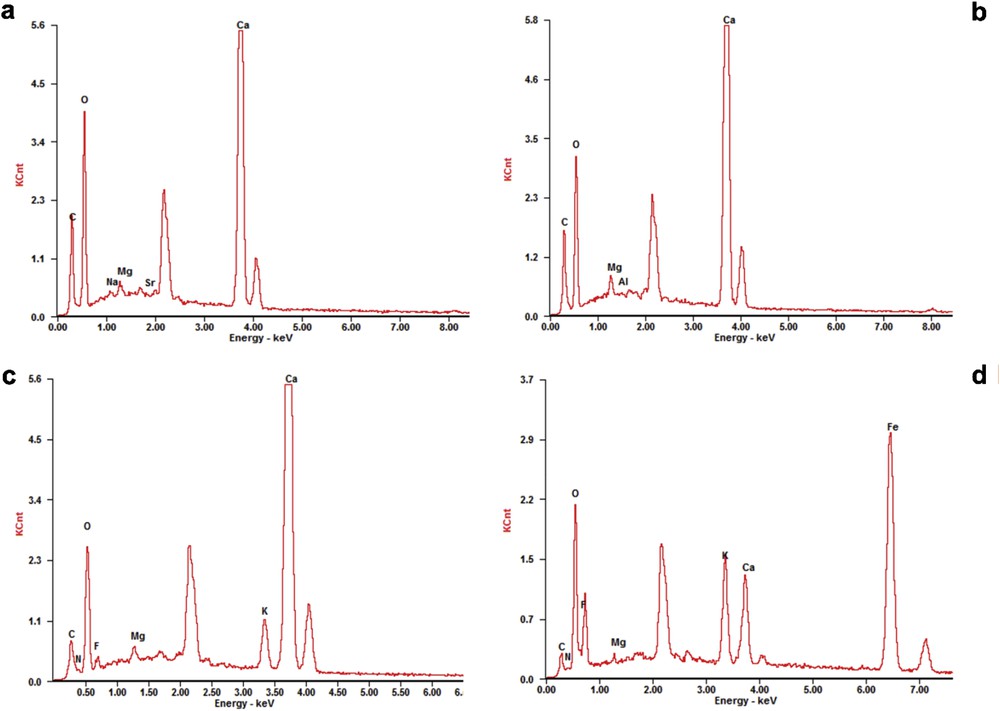
EDS spectra of (a) raw eggshell, (b) calcined eggshell, (c) KEC, and (d) MKEC catalyst.
As shown in Fig. 3c, the micrograph of the KEC catalyst exhibited a compacted hexagonal-like plate with a smoother surface. The wide hexagonal-like plates suggest the availability of high surface area, which enhanced the activity of the catalyst. The EDS spectra confirmed the presence of F (3.72 wt %), C (2.13 wt %), Ca (60.76 wt %), O (15.56 wt %), and K (15.72 wt %). The decrease in the percentage of oxygen and carbon may be due to additional calcination of the KEC after impregnation and loss of oxygen during the formation of a new KCaF3 crystal when CaO combined with KF [18,19]. For MKEC, the catalyst exhibited a unique granular structure with an average particle diameter of 90 nm (Fig. 3d). The presence of rough-like microstructures explains its high catalytic activity. As seen in Fig. 4d, the presence of Fe (65.45%) and increased content of O from 15.56 to 19.56 wt % confirmed successful loading of Fe3O4 onto the KEC. These results are consistent with those of the XRD and Brunauer–Emmett–Teller (BET) analysis.
The data from N2 adsorption–desorption isotherms demonstrated that the MKEC catalyst was porous with a surface area of 128.01 m2/g, average pore size of 3.24 nm, and a pore volume of 0.0449 cm3/g. The KEC is mesoporous because its pore width (3.24 nm) falls within the mesopores' size range of 2 nm–50 nm as specified by IUPAC classification [14,23]. The analysis results in Table 3 indicated that the raw eggshell possesses the lowest BET surface area. However, upon high-temperature calcination, the calcined eggshell surface area increased and exhibited bimodal particle size distribution with a mixture of small and large agglomerates.
Physical properties of eggshells and catalysts.
| Physical property | Material | ||||
| Commercial CaO | Eggshell | Calcined eggshell | KEC | MKEC | |
| BET surface area (m2/g) | 38.5 | 19.6 | 79.9 | 107 | 128 |
| Average pore radius (nm) | 6.78 | 5.18 | 5.66 | 3.98 | 3.24 |
| Pore volume (cm3/g) | 0.0129 | 0.0016 | 0.0165 | 0.0312 | 0.0449 |
4.2 Effect of input parameters on biodiesel production
The yield of biodiesel is influenced by the number of input parameters. Herein, the influence of catalyst concentration (% w/v) on the single-stage transesterification was examined by varying the catalyst amount (2–6%) over the volume of the oil. The results are summarized in Fig. 5a, the reaction conversion increased rapidly with the increase in the catalyst concentration from 2 to 4 wt %. This result indicated that increasing the amount of catalysts increased the contact between the reactants and the catalyst [21,23]. Meanwhile, as the amount of catalyst exceeded 4 wt %, the biodiesel yield did not increase proportionately. It is inferred that excess catalyst may inhibit the mixing of oil, methanol, and catalyst and lead to phase separation [23–25]. Furthermore, the comparative efficacy of selected samples is investigated as depicted in Fig. 5b. The yield of biodiesel produced from neem oil (FFA, 4.2%) by commercial CaO, calcined eggshell-derived CaO, KEC, MKEC, and KF/commercial CaO was obtained as 47%, 65%, 90.6%, 95.6%, and 87.9%, respectively. The observed trend in the yield is attributed to enhanced surface areas of the catalysts.
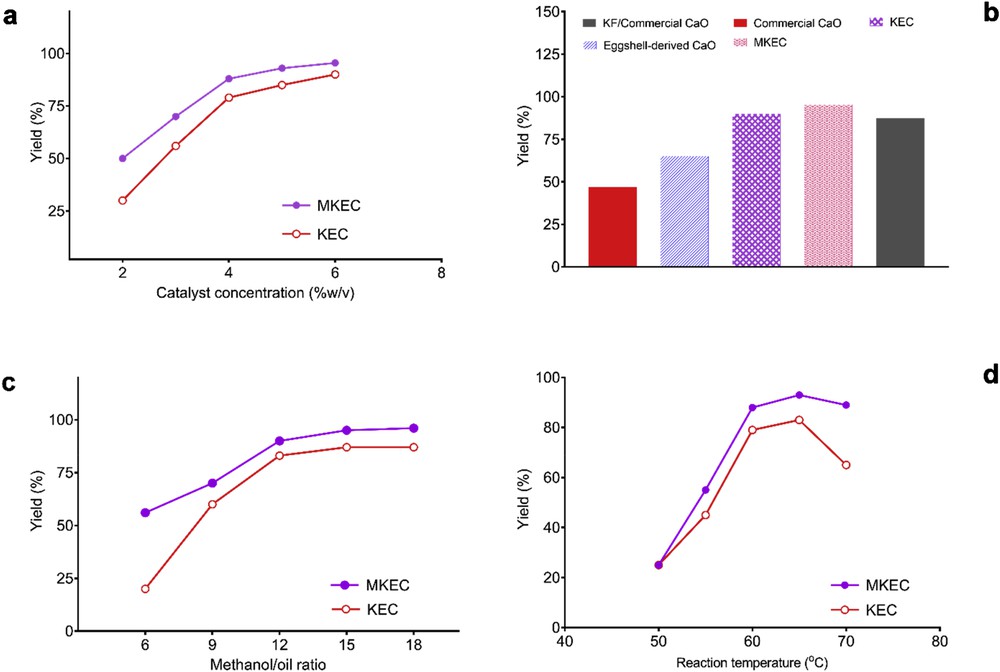
(a) The effect of MKEC amount; (b) comparative efficacy of catalysts (temperature, 65 °C; catalyst amount, 6 wt %; methanol/oil ratio, 15:1; and reaction time, 2 h); (c) effect of methanol/oil ratio; and (d) effect of reaction temperature.
As illustrated in Fig. 5c, the biodiesel yield increased considerably when the methanol/oil molar ratio was increased from 6:1 to 12:1. An optimal methanol/oil molar ratio shifted the reaction equilibrium to the forward direction and thus achieved maximum biodiesel yield. Further increase in the methanol/oil molar ratio of higher than 12:1 showed a little effect on the triglyceride conversion. Although the higher molar ratio is used to enhance the contact between the methanol and oil, the glycerol will likely dissolve in excessive methanol and inhibit the reaction. This phenomenon would shift the equilibrium in the reverse direction [21]. Hence, 15:1 was selected to guarantee the biodiesel quality.
Fig. 5d shows the effect of reaction temperature on the biodiesel yield. The yield increased appreciably when the reaction temperature increased from 50 to 60 °C. Afterward, the yield increased slowly beyond 60 °C until the equilibrium was attained at 65 °C, and then decreased beyond 65 °C. The temperature higher than 65 °C will burn the methanol and decrease the biodiesel yield because the boiling point of methanol is 65 °C [26]. Hence, 65 °C was selected because it was difficult to control the reaction system due to vaporization of methanol when the temperature was higher than 65 °C.
4.3 Optimization studies: CCD and ANN data analyses
The complete CCD design matrix with experimental and predicted values of biodiesel yield (%) is presented in Table 1. The results of the experiments obtained from the significant parameters were fitted into a quadratic polynomial equation as presented in Eq. (4):
| (4) |
The results shown in Table 4 indicate that the derived second-order polynomial model is significant. Tabulated variables such as F value and sum of square for the chosen model for biodiesel yield are 86.09 and 2297.6, respectively, indicating only 0.01% chance for occurrence of F value due to noise. Therefore, the model is statistically significant for predicting the biodiesel yield within the range of the experimental variables investigated.
ANOVA for the response surface quadratic model.
| Source | Mean square | F value | P value (probability > F) | Remarks | Model accuracy | |
| Correlation coefficients | Values | |||||
| Model | 170.91 | 86.09 | 0.0001 | Significant | R-Squared | 0.976 |
| A—Catalyst dosage | 210.04 | 105.80 | 0.0001 | Adj. R-squared | 0.956 | |
| B—Methanol/oil | 975.37 | 491.30 | 0.0001 | Pred. R-squared | 0.929 | |
| C—Reaction time | 222.04 | 111.84 | 0.0001 | Adeq. precision | 34.91 | |
| D—Reaction temperature | 176.04 | 88.67 | 0.0001 | PRESS | 19.67 | |
| BC | 27.56 | 13.88 | 0.0017 | Sum of squares | 2297.6 | |
| BD | 14.06 | 7.08 | 0.0164 | |||
| A2 | 39.40 | 19.85 | 0.0003 | |||
| B2 | 47.46 | 23.91 | 0.0001 | |||
| C2 | 25.52 | 12.86 | 0.0023 | |||
| D2 | 32.09 | 16.16 | 0.0009 | |||
| Residual | 1.99 | |||||
| Lack of fit | 2.21 | 2.42 | 0.2544 | Not significant | ||
| Pure error | 0.92 |
The P value of 0.0001 implies that the model is significant at 95% confidence level [27]. The suitability of the model was also evaluated using the coefficient of determination (R2), adjusted coefficient of determination (Adj. R2) and predicted residual sum of squares (PRESS). The values of R2 and Adj. R2 were found to be very high, 0.976 and 0.956, respectively. Only 2.4% of the total variations in Eq. (4) are not explained by the model. This indicates an excellent correlation between the independent variables [14]. Meanwhile, the PRESS is low (19.67), which revealed reliability and a better precision of the experimental results [28].
4.3.1 Effects of process variables and interactions on biodiesel yield
Fig. 6a–d shows the three-dimensional surface plots of the interaction among catalyst amount, methanol/oil ratio, reaction time, and reaction temperature on the biodiesel yield. Fig. 6a demonstrates the effect of interaction between the reaction time and catalyst concentration on biodiesel yield. The combined effect of the increased reaction time and catalyst concentration results in the increment in biodiesel yield up to an optimum point (91.5%). The biodiesel yield was higher at high catalyst concentration with shorter reaction time. However, low catalyst concentration (1.2% w/v) and very high reaction time (4 h) do not yield appreciable biodiesel (56%). In addition, with very high catalyst concentration, a decline in biodiesel yield was obtained. The three-dimensional surface plot indicated that the maximum amount of the biodiesel yield (91.5%) was obtained with 6% of the catalyst amount and 2 h of reaction time. Similar trends have been reported [28,29].
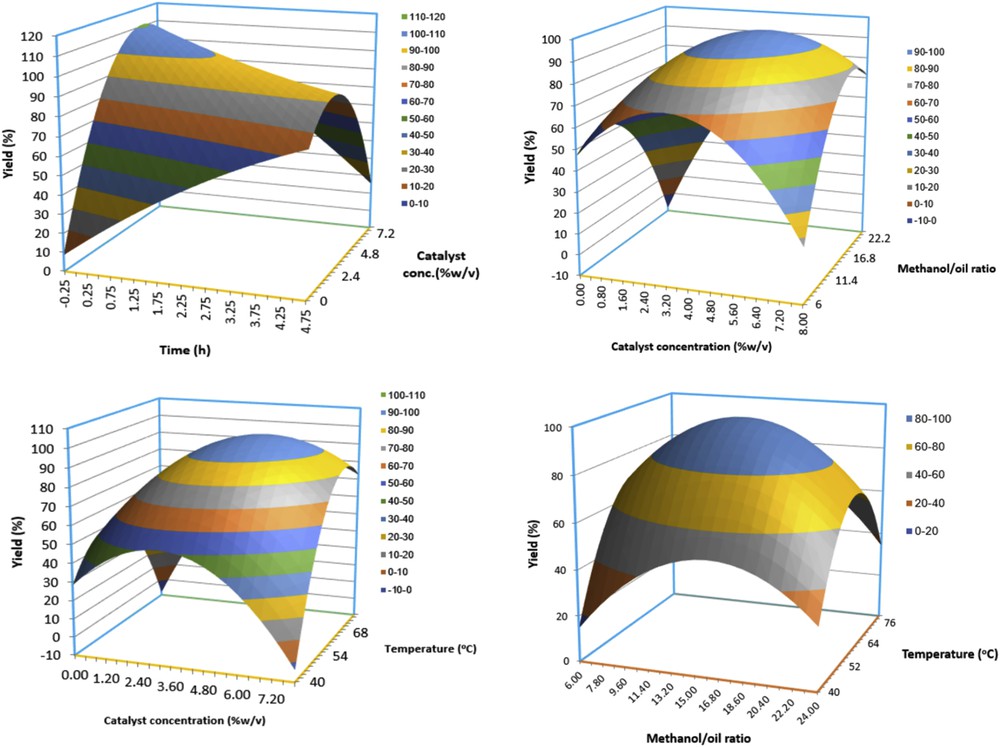
Three-dimensional response surface plots showing the effects of input variables on biodiesel yield (%).
The dependence and variation of biodiesel yield (%) on both catalyst concentration and methanol/oil ratio at constant temperature (65 °C) and reaction time of 2 h are depicted in Fig. 6b. It is obvious that with increasing both catalyst weight percent and methanol/oil ratio resulted in an increased biodiesel yield (96.9%) until a certain point. The biodiesel yield declined beyond the optimum parametric range. Similar trends were obtained considering the interactive effects of temperature and catalyst concentration (Fig. 6c) and methanol/oil ratio and temperature (Fig. 6d).
According to the optimization results obtained by the CCD and the desirability function (1.00), an average of 96.9% biodiesel yield was achieved at predicted optimum conditions of the variables. The verification experiment revealed only 2.39% difference between predicted and actual yield. The relative importance of the four input variables was calculated by the Garson equation [30,31] based on an ANN approach. All of the four variables have strong effects on the FAME content, and the degree of effectiveness of the variables followed this order: catalyst concentration (38.11) > methanol/oil ratio (28.67%) > temperature (19.89%) > reaction time (13.31%). It is inferred that none of the variables could be neglected in the present analysis.
Fig. 7 presents the comparison between predictive capabilities of the CCD and ANN. It is evident from Fig. 7 that the trained neural network predictions lie much closer to the actual experimental line than the CCD model. Also, the higher value of R2 = 0.996, lower values of RPD = 3.12, and SEP = 4.25 for ANN as compared to the R2 (0.981), RPD (7.18), and SEP (6.94) of CCD suggested better prediction capability of the ANN in predicting the FAME yield. The lower predictive accuracy of the CCD herein is attributed to its restricted ability to a second-order polynomial [14], whereas the ANN has universal ability to approximate nonlinearity of the system [6].
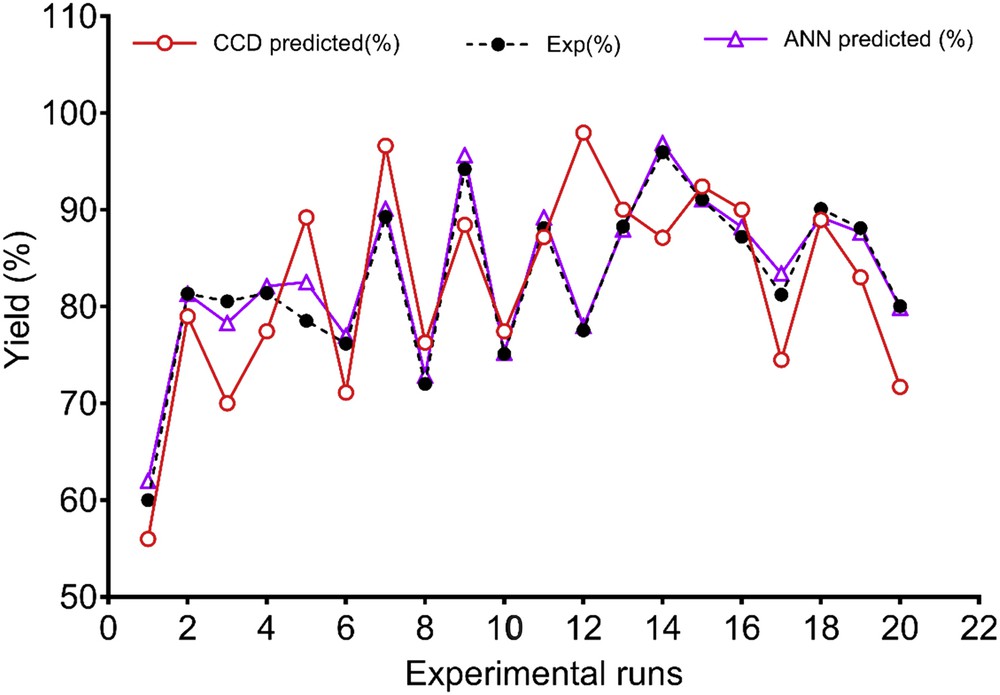
Comparison between ANN and CCD predictive ability for an experimental run to obtain biodiesel from neem oil.
4.4 Acid tolerance studies of MKEC
The efficacy of MKEC was also examined for biodiesel yields as a function of acid values. The neem oil with different FFA contents (6.6%, 4.2%, 3.1%, 2.3%, and 0.49%) was used for biodiesel production. As shown in Fig. 8, the MKEC catalyst had the good antiacidic ability and could yield over 80% of biodiesel when the FFA values of the oil were less than 5.0. As observed, oil with FFA of 6.6% yielded 73% biodiesel as compared to 84% biodiesel yield when the FFA of the oil is 4.2%. Furthermore, under established transesterification optimal conditions, biodiesel yields were obtained using Jatropha (FFA, 54.8%) and waste cooking oils (FFA, 3.16%).
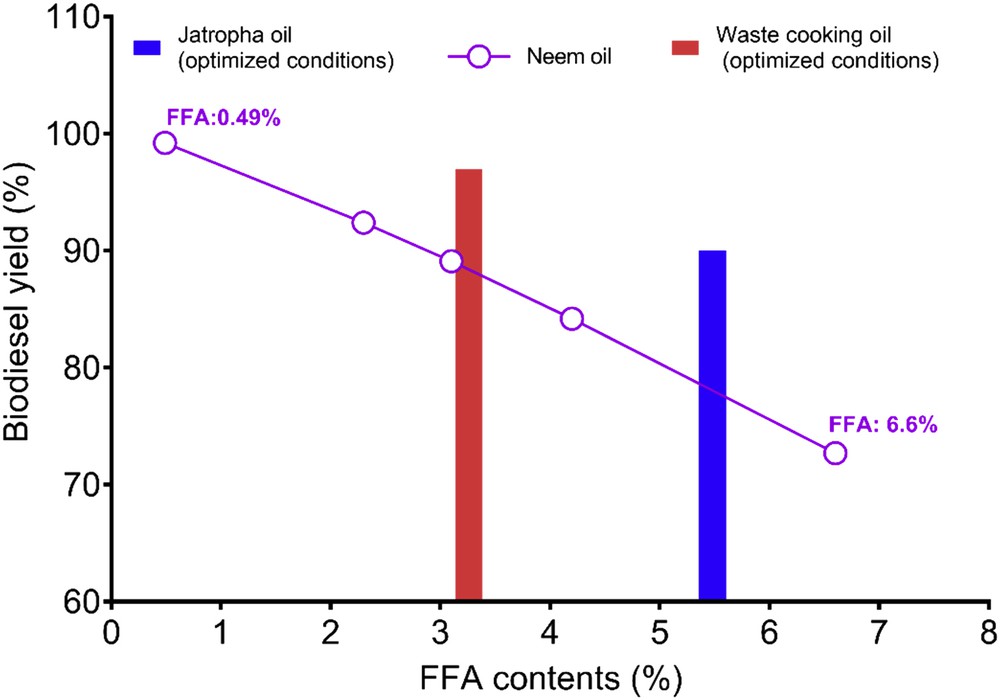
Biodiesel yield from oil of various acid values (optimized conditions: MKEC, 6 wt %; oil/methanol ratio, 1:15; temperature, 60 °C; and time, 2 h).
The results suggest that the proposed catalyst is usable with good performance on a variety of vegetable oils having FFA greater than 0.5% in a single stage, for biodiesel production with relatively high yields without the occurrence of saponification. Interestingly, the activity of the catalyst is promising on biodiesel yield from waste cooking oil (97%) as compared to the neem oil (89.1%) having FFA content. This improvement in yield of biodiesel from waste cooking oil may be attributed to the difference in a chemical constituent of waste cooking oil as compared to neem oil.
4.5 Stability and comparative reusability studies: KEC and MKEC
The stability and sustained activity of the catalyst are of great importance for industrial applications. Herein, the magnetic capability of MKEC enhanced its recoverability after the completion of the reaction. The MKEC and KEC were regenerated and reused to investigate the catalyst lifetime and stability under same reaction conditions. The results indicate that MKEC catalyzed biodiesel yield was more than 80% after six cycles (Fig. 9), whereas the yield dropped to less than 60% beyond the sixth run using the nonmagnetic catalyst (KEC).
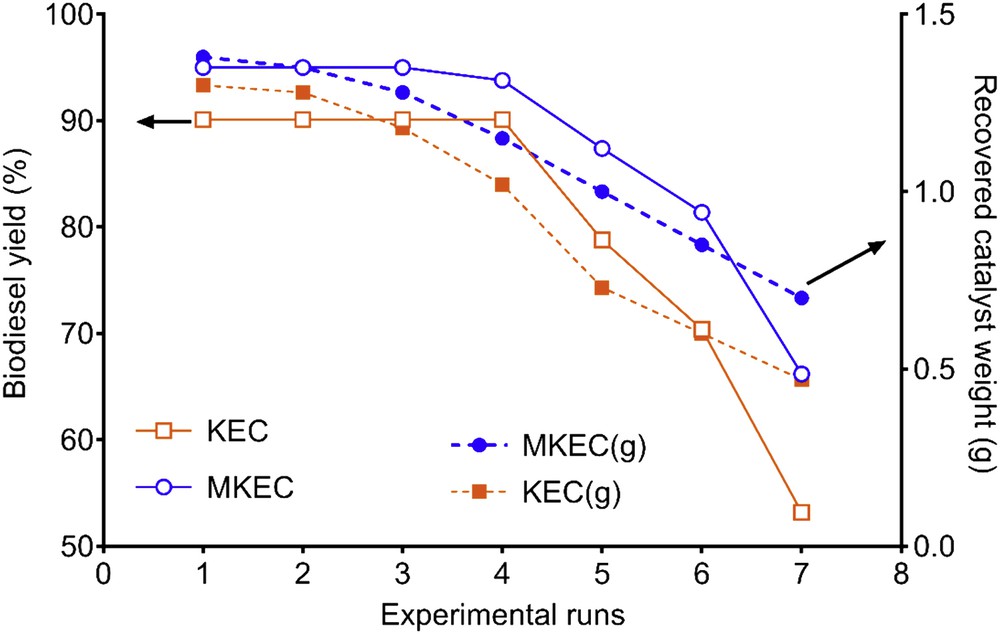
Comparative recoverability and reusability studies of the MKEC and KEC (1.4 g).
The reduction in the biodiesel yield per cycle is attributed to increasing blockage of the catalyst pores [1,19,32]. As obtained, 1.0 g of the MKEC was recovered and reused for the reaction in the fifth run, meanwhile, only 0.73 g of the KEC was recovered and reused. This contributed to the substantial differences seen in the yields. Hence, MKEC can contribute much to decreasing the cost of biodiesel production because of its high recoverability, good stability, and long catalyst lifetime.
4.6 Biodiesel physicochemical and fuel properties obtained under optimum conditions
The quality of the biodiesel fuel produced from the neem oil was evaluated according to the ASTM D6751-12. The physical properties of the obtained biodiesel prepared under optimum conditions are within the appropriate range of ASTM D6751-12 as shown in Table 5.
Neem oil, biodiesel physicochemical and fuel properties.
| Properties | Units | Neem oil | Biodiesel (B100) measured value | ASTM standard B100 |
| Density at 40 °C | (g/cm3) | 0.92 | 0.89 | 0.86–0.89 |
| Iodine value | (mg I/100 g oil) | 71.4 | 42.5 | – |
| Viscosity at 40 °C | (mm2/s) | 26.09 | 4.78 | 1.9–6.0 |
| Acid value | (mg KOH/g) | 8.36 | 0.264 | 0–0.5 |
| Saponification value | (mg KOH/g oil) | 205.5 | – | – |
| Flash point | °C | – | 137 | 93–170 |
| Cloud point | °C | – | 10 | −3 to 12 |
| Pour point | °C | – | 4 | −15 to 10 |
| Water and sediment | (vol %) | – | 0.02 | 0–0.05 |
| Molecular weight | (g/mol) | 870 | – | – |
| Color | Dark brown | Light brown | – |
4.6.1 Qualitative chemical analysis of the produced biodiesel fuel
The presence of molecules of methyl esters in the biodiesel produced was examined using Agilent Cary 630 FTIR and Shimadzu GC–MS-QP2010 PLUS. As shown in Fig. 10, broad peaks occur at 2922, 2855, 1744, 1461, 1159, 723 cm−1, and so forth. It is evident that saponification was circumvented during the biodiesel production process as the peaks corresponding to the presence of metal carboxylates were absent within the expected range of 1580–1541 cm−1. The peaks corresponding to 1750–1730 cm−1 represent the presence of fatty acid methyl esters, which are essentially biodiesel [33].
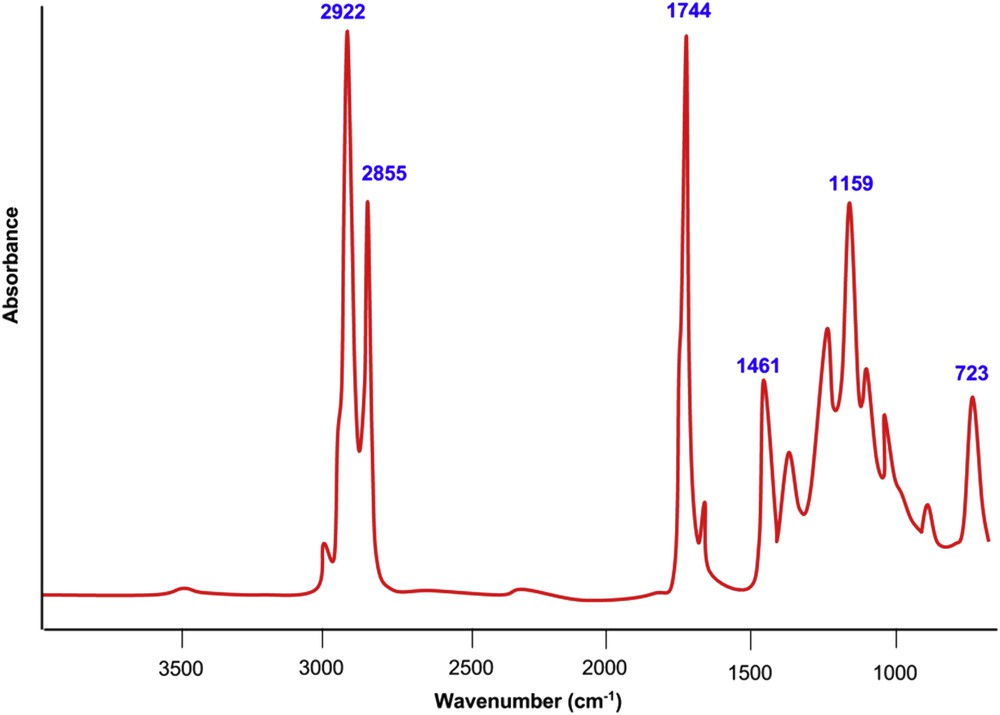
FTIR spectra of biodiesel fuel produced under optimal process parameters.
The chromatogram of the biodiesel also corroborated the FTIR as depicted in Fig. 11. The total ester content of the biodiesel was found to be 96.82%, which is higher than 96.5% specified in the ASTM 6571-12 standard reference. The description of the peaks is given in Table 6, it is important to stress that the molecules of glycerine (1.61%) present in the biodiesel may likely be due to insufficient purification after production.
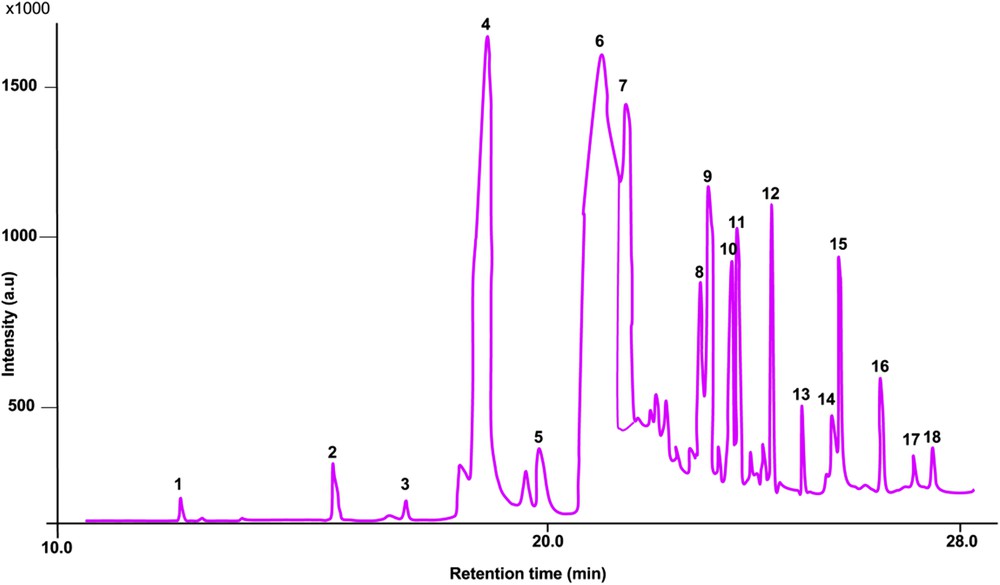
Chromatogram of the produced biodiesel fuel under optimal conditions.
Percentage compositions of the produced biodiesel.
| Peak no. | IUPAC name | Molar mass (g/mol) | Retention time (min) | Percentage compositions |
| 1 | Methyl tridecanoate | 228 | 14.0 | 0.25 |
| 2 | Methyl myristate | 242 | 16.3 | 0.83 |
| 3 | Methyl pentadecanoate | 256 | 17.4 | 0.35 |
| 4 | Methyl palmitate | 270 | 18.7 | 22.9 |
| 5 | Methyl margarate | 284 | 19.5 | 2.15 |
| 6 | Methyl oleate | 296 | 20.4 | 39.6 |
| 7 | Methyl stearate | 298 | 20.8 | 11.6 |
| 8 | Methyl eicosatrienoate | 320 | 22.0 | 2.47 |
| 9 | Methyl eicosadienoate | 322 | 22.3 | 2.56 |
| 10 | Methyl 11-eicosanoate | 324 | 22.8 | 3.01 |
| 11 | Methyl arachidate | 326 | 23.0 | 3.69 |
| 12 | Methyl heneicosanoate | 340 | 23.8 | 3.18 |
| 13 | Methyl behenate | 354 | 24.6 | 0.64 |
| 14 | Glycerin 1-monooleateNE | 356 | 25.4 | 1.61 |
| 15 | Methyl lignocerate | 382 | 25.5 | 3.04 |
| 16 | n-OctacosaneNE | 394 | 26.6 | 1.23 |
| 17 | SqualeneNE | 410 | 27.5 | 0.34 |
| 18 | Methyl melissate | 466 | 27.9 | 0.53 |
| Total non-ester (NE) | 3.18 | |||
| Total ester content | 96.8 |
5 Conclusions
Heterogeneous KF-functionalized magnetic catalyst (MKEC) was prepared from chicken eggshells. The MKEC heterogeneously catalyzed oil yielded 94.5% and 97% biodiesel from neem oil (FFA, 4.2%) and waste cooking oil (FFA, 3.16%), respectively. It is worth mentioning that saponification was circumvented in the proposed single-stage transesterification process. The efficacy of MKEC outperformed commercial CaO and nonmagnetic KF-functionalized catalyst (KEC) under same reaction conditions. The maximum biodiesel conversion (97%) from neem oil was achieved under the optimum reaction condition of 6 wt % catalyst, 15:1 methanol/oil molar ratio, 65 °C reaction temperature, and in 2 h reaction time. The MKEC can be reused up to five times without much deterioration in its activity, and the catalyst recovery is more than 75% after five recycling runs.
Acknowledgments
The authors are thankful to Dr. Solmaz Azarmi of Faculty of Tourism of EMU for optimization and predictive modeling of the results. The statistical inputs greatly helped improve the manuscript for which we are grateful. The team at the Language center of Cyprus Science University is thankfully acknowledged for editing this manuscript.