


 CC-BY 4.0
Introduction
Similar to other social insects, the integrity of the superorganism formed by a honey bee (Apis mellifera) colony relies on coordination of the tasks of the different individuals living in the colony. Chemical communication through pheromones plays a major role in the regulation of homeostasis, development, food sourcing, defences, division of labour and reproduction of the social group [1, 2]. Pheromones are chemicals that are secreted externally and that produce changes in behaviour and physiology, with the emitter and receiver belonging to the same species [3]. Pheromones act as a chemical language that is very diverse in terms of the chemical nature of the semiochemicals involved and the complexity of the signal, but at the same time very specific in relation to the state of the colony and the environmental conditions. Two types of pheromones can be identified depending on their effect on the receiver of the chemical message upon reception: releaser pheromones initiate an immediate behavioural response, whereas primer pheromones have long-term effects and modify the physiology of the receiver [4]. One given pheromone can have both primer and releaser effects [5].
The success of a honey bee colony not only relies on efficient reproduction that is ensured by the queen but also on the development of its population. Efficient population development requires new individuals to be regularly raised because the life expectancy of individual honey bee workers is limited to a few weeks [6]. Brood care thus ensures the renewal of the colony population because immature individuals at the larval stage are totally dependent on the care provided by adult workers for their survival. The developing brood produces a complex blend of pheromones that influence both the behaviour and physiology of worker bees [5, 7]. A mixture of ethyl and methyl esters of fatty acids (10 in all) forms the main brood pheromone and is known as brood ester pheromone (BEP) [8]. Individual esters and/or subsets of BEP can be interpreted by worker bees in various ways depending on the brood stage. In the last instar worker larvae, four BEP compounds mediate brood cell capping initiation. Differences in the proportion of different compounds of BEP and, more particularly, the ratio of ethyl to methyl esters provide a signature that serves as a reliable indicator of larval age [9, 10]. However, the contribution and role of each of the 10 BEP compounds for other behaviours remains unknown.
BEP not only modifies the behaviour and physiology of workers but also plays a critical role in the optimisation of nutrition provided to the brood at the colony level. BEP can increase the amount of royal jelly that is delivered to larvae [11], as well as the amount of proteins found in the hypopharyngeal glands [12, 13]. BEP also influences the transition of workers from nurses to foragers [14], which provides the brood with additional control over the amount of care that is delivered to them, thus ensuring that their development is optimal. If the amount of brood within the colony increases, the levels of BEP increase. As a result, the transition from nursing to foraging is slowed down and the nurse/forager ratio is increased. This blend of ten fatty-acid esters has also been identified as a kairomone that attracts the parasitic mite Varroa destructor [15, 16, 17] and has been shown to serve as a defence pheromone in the hygienic response of honey bee workers towards varroa-infested brood [18].
These chemical cues that are found on the surface of the cuticles of honey bee larvae and pupae are one of the few examples of primer pheromones among more than 50 chemicals that are known to ensure the efficient functioning of a honey bee society [5] and are at the centre of the complex regulation of behaviour and physiology that ensure the cohesion of the honey bee colony.
Brood physiology is often studied using an in vitro rearing method that allows the control of temperature and other environmental parameters, such as pesticide exposure [19]. This OCDE-validated protocol has been proven to provide broods with normal morphological development and a high emergence rate into adults.
To improve our knowledge of the ecophysiology of the BEP pheromone, we investigated the natural variations in the production of the 10 components of the BEP during the bee season using monthly measurements from spring to fall. Using a comparative approach, we also investigated the BEP chemical profile of in vitro- and in-hive-reared broods during their development.
1. Material and methods
1.1. Honey bee colonies
This study was conducted using Apis mellifera L. hybrid honey bee colonies located at the INRAE research centre of Avignon (France), in 2017.
1.2. In vitro brood rearing
Larvae were reared in vitro according to the method developed by Aupinel et al. [19]. To obtain larvae of a known age, three days before the experiment, combs containing empty cells were previously equipped with a queen excluder and placed in the hive for egg laying. Four days later, 1st instar larvae were transferred into plastic queen-starter-cells and placed in an incubator under controlled conditions (34 ± 2 °C and 95 ± 5% relative humidity (RH)). On the 7th day, the RH was changed to 80% for the period. On the 8th day, each plate was individually sealed with a thin layer of beeswax so that each cell was individually capped. In each cell, orifices were made on the top to enable air exchange. Larvae were provided with food at the daily intakes recommended for each developmental stage [19]. The food was composed of 1 volume of royal jelly and 1 volume of an aqueous solution containing 12% (w/v) glucose, 12% fructose, and 2% yeast extract (diet A); 15% glucose, 15% fructose, and 3% yeast extract (diet B); or 18% glucose, 18% fructose, and 4% yeast extract. Daily feeding of larvae (volume per diet and per day) was performed from the 1st day (grafting) to the 6th day, except for the 2nd day, which was considered a period of acclimatisation. The diet was: 20 μL of diet A on the 1st day, 20 μL of diet B on the 3rd day, and 30, 40, and 50 μL of diet C on the 4th, 5th, and 6th days, respectively.
1.3. Sampling of honey bee brood for chemical analyses
BEP production was studied across the beekeeping season, monthly from April to October. Each month, frames containing open brood were brought to the laboratory and ready to be capped last-instar larvae were carefully sampled with soft tweezers. Six samples were collected (30 larvae) from each colony. The experiment was conducted on 3 colonies.
To study BEP production under different rearing environments and during development, frames on which the queen had been caged (see above) were retrieved each day from the colony, and larvae or pupae were carefully sampled from the uncapped or capped cells. At the same time, brood cells from the same colonies, but artificially reared in the lab (see above), were sampled using the same procedure. Larval staging was performed by weighing the larvae, whereas pupal staging was performed by observing the colouration of the eyes, mandibles and body parts [20]. The experiment was also conducted on 3 colonies in April 2015, with a sample size between 6 and 15 larvae/prepupae per stage and rearing condition and between 4 and 5 pupae per stage and rearing condition. A total of 131 samples were analysed for this second experiment.
1.4. Brood ester pheromone (BEP) extraction
The BEP compounds were extracted by crushing 10 individuals (larvae, pre-pupae or pupae, only 5 larvae for L5 larvae as the level of emission is very high) in 1900 μL of hexane (Sigma Aldrich) and 100 μL of C17 ester methyl heptadecanoate (10 ng/μL; internal standard, Sigma Aldrich) using an automatic grinder with a metal bead (Fritsch Pulverisette 23). Crushed samples were immediately placed on ice and stored at −30 °C. The tubes were then centrifuged at 4000 rcf at 4 °C for 20 min. The supernatant was transferred to new tubes and stored at −30 °C until fractionation.
To facilitate analyses of the chemical profile of the samples, which are composed of many compounds, fractionation of the samples was performed. This allowed the separation of nonpolar compounds (e.g. cuticular hydrocarbons) from compounds containing polar groups (e.g. esters). Sample extracts were applied to a silica column (silica gel 60, particle size 40–63 mm, 230–400 mesh). The column was first rinsed with a solvent mix (98.5% isohexane, 1.5% diethyl ether—Sigma-Aldrich) until 3 mL of the mix was collected. Samples were added to the column and eluted in a final volume of 3 mL of the solvent mix containing 1.5% diethyl ether. The second fraction was eluted in a final volume of 3 mL of a second solvent mix (94% isohexane, 6% diethyl ether). The 3 mL of the second fraction, containing the BEP compounds, was concentrated to 30 μL under a nitrogen stream.
1.5. Gas chromatography analysis
Quantitative analysis of the BEP compounds contained in the extracts of the second fraction was performed on a fast gas chromatograph (Shimazu GC-2014) equipped with a split/splitless inlet, a flame ionisation detector, and a capillary Supelcowax column (15 m × 0.10 mm, 0.10 μm film thickness). 1 μL of each sample was injected with a 30-ratio split mode and a column flow of 0.94 mL/min. The carrier gas was hydrogen, and the temperatures of the injector and detector were both set at 250 °C. The oven temperature was programmed with the following conditions: 90 °C isothermal held for 1 min, followed by temperature increases at a rate of 40 °C/min up to 195 °C, at a rate of 1 °C/min up to 201 °C, and at a rate of 40 °C/min up to 250 °C. The oven was finally held at 250 °C for 3 min. The peaks corresponding to the internal standard and each compound of the BEP were attributed to injection of pure commercial compounds (Sigma Aldrich) diluted in isohexane at the end of each batch of 10 samples. Profile comparison of each pure synthetic compound injected individually and the sample profiles allowed for identification of the 10 BEP compounds.
Quantification was obtained using a standard curve constructed for each compound of the BEP, and normalised to the internal standard concentration of each sample after correction of the slope differences between the BEP standard curve and the C17 ester standard curve. Standard curves were built using five concentrations (selected to cover the concentration range of the samples) and five replicates of each concentration. 18 samples were analysed for each date for the temporal study, while 80 samples were taken from the hive and 51 from the in vitro setting (5⩽n⩽15) to examine the effect of the rearing environment.
Further confirmation of the identification process of the BEP compounds in the samples was performed on a gas chromatograph coupled with a mass spectrometer (GC-MS, ThermoQuest Trace GC—Polaris) equipped with a Phenomenex ZB-WAX column (30 m × 0.25 mm, 0.25 μm film thickness). 1 μL of a selection of 10 representative samples was injected with the inlet in splitless mode and a column flow of 0.7 mL/min. The carrier gas was helium, and the temperatures of the injector and detector were set at 250 °C. The GC–MS programme has been adapted to match the GC-FID programme. The oven temperature was programmed with the following conditions: 60 °C isothermal held for 1 min, followed by temperature increases at a rate of 30 °C/min up to 180 °C, at a rate of 1.5 °C/min up to 210 °C, and at a rate of 20 °C/min up to 250 °C. The oven was finally held at 250 °C for 5 min. Compound identification was confirmed by comparison of their mass spectra with those of synthetic compounds, those available in libraries, and further comparisons of their retention indices.
1.6. Statistical analyses
All statistical analyses and figures were generated in the R environment (Version 3.5.3). Redundancy analyses were performed to identify overall differences in BEP profiles during different months in the beekeeping season, stages, or according to the rearing environment (package “vegan”). Months was included as a fixed factor in the first RDA, whereas Stage, Environment, and their interaction were included in the second RDA. In both RDAs, “Colony IDs” were included as a random factor, and pairwise comparisons were performed between group levels with corrections for multiple testing using the pairwise.factorfit function (package “RVAideMemoire”).
Total BEP, ethyl/methyl ratio, and single compound amounts were analysed using linear mixed models, with Months or Stage and Environment as fixed factors and colonies as random factors. Wald tests were used to assess the effect of independent variables, and pairwise comparisons of estimated marginal means were performed using the emmeans function (package “emmeans”). The P values of pairwise comparisons were adjusted using false discovery rate correction [21].
We also normalised the amount of each BEP compound according to the maximum emitted during the 7 months of measures (temporal effect) or along the 9 stages to represent the relative median values in a heatmap.
2. Results
2.1. Temporal variations of brood ester pheromone (BEP) production
To highlight the main tendencies in the BEP pheromonal bouquet over time, we performed multivariate redundancy analysis (RDA). The first two components of the RDA explained 92.9% of the variance. Emissions varied throughout the beekeeping season (RDA; Season: F6,115 = 22.51, p = 0.001). The first component of the RDA allowed the separation of samples collected in July, August, and September from those collected in April, May, June, and October, with the latter being tightly clustered together (Figure 1). The second component separated samples collected in September from those collected in July and August, which harbour highly similar profiles.
Redundancy analysis (RDA) performed on brood ester pheromone (BEP) compounds captured on last-instar larvae, monthly from April to October. Compounds are represented by their IDs and grey arrows. MP, methyl palmitate; MS, methyl stearate; MO, methyl oleate; ML, methyl linoleate; MLN, methyl linolenate; EP, ethyl palmitate; ES, ethyl stearate; EO, ethyl oleate; EL, ethyl linoleate; ELN, ethyl linolenate.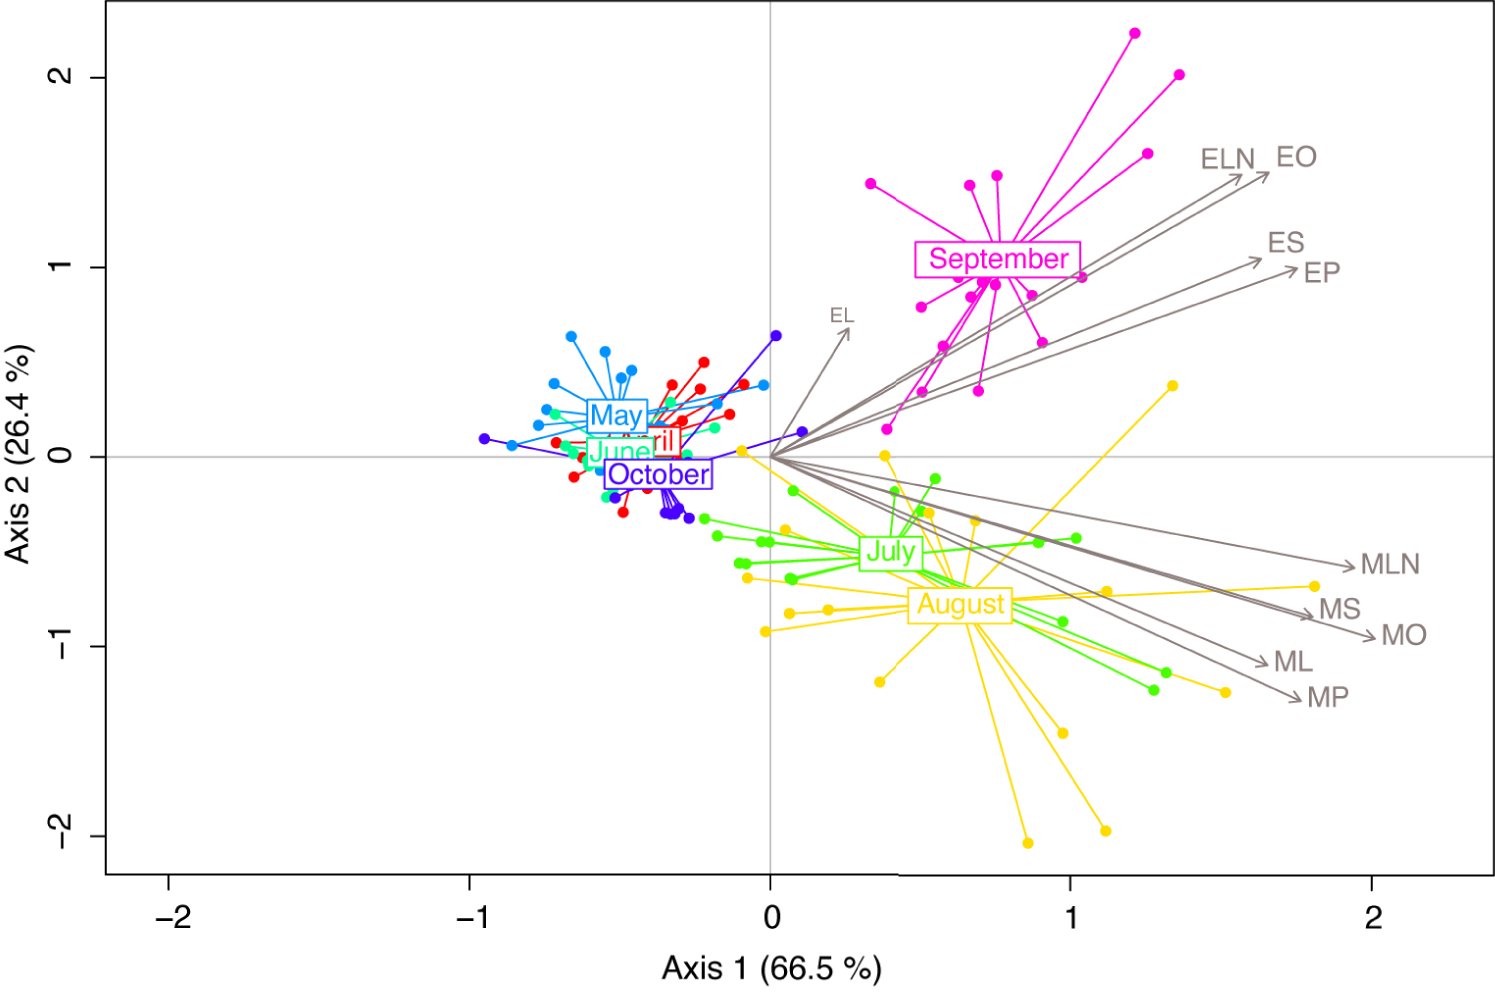
Samples collected in April, May, June, and October harboured similar bouquets, whereas samples from July and August were grouped together; September samples formed a third group of samples.
For each month, n = 18. Compounds are represented by their IDs and grey arrows. MP, methyl palmitate; MS, methyl stearate; MO, methyl oleate; ML, methyl linoleate; MLN, methyl linolenate; EP, ethyl palmitate; ES, ethyl stearate; EO, ethyl oleate; EL, ethyle linoleate; ELN, ethyl linolenate.
Comparison of total BEP production over time showed a significant difference in total BEP abundance (LMM; X6,115 = 447.6, p < 2 × 10⁻¹⁶; Figure 2A). In particular, BEP levels greatly increased during summer (July, August and September). Following the variable structuration visible on the RDA, we then examined the ethyl/methyl ratio by estimating the proportion of the amount represented by the ethyl compounds over the total amount. The ratio significantly differed across time (LMM; X6,115 = 126.8, p < 2 × 10⁻¹⁶), with a drastic increase in ethyl compound amounts in September (Figure 2B).
Temporal variations in brood ester pheromone (BEP) compounds. (A) Total amount of BEP variations. (B) Ethyl/methyl ester ratio variations. (C) Heat map showing the temporal variations of the 10 components of the BEP. N = 18 per month. Different letters indicate significant differences between groups. MP, methyl palmitate; MS, methyl stearate; MO, methyl oleate; ML, methyl linoleate; MLN, methyl linolenate; EP, ethyl palmitate; ES, ethyl stearate; EO, ethyl oleate; EL, ethyl linoleate; ELN, ethyl linolenate.
When looking at the temporal evolution of each compound, the 10 BEP compounds could be classified in two groups (Figure 2C). The first group, composed of all 5 methyl compounds (MP, MS, MO, ML, MLN) reached their maximum in July or August. In particular, when compared to the April level, MO, MP, MS, and MLN exhibited significantly higher levels in July, August, September, and to a lesser extent in October for MO and MLN (Figure S1, Table S1). ML displayed higher levels in July and August, and significantly lower levels in May, June, and October (Figure S1, Table S1). The second group, composed of all five ethyl compounds, reached their maximum in September. EP and ELN indeed displayed an isolated peak of production in September; EO and ES also showed this peak, but with an intermediate increase in August (Figure S1, Table S1). Ethyl linoleate (EL) displayed a peculiar temporal dynamic, with marked production in spring and particularly in May (Figure 2C).
2.2. Effect of the rearing environment on brood ester pheromone production during development
To highlight the main tendencies in the BEP pheromonal bouquet across the development and the rearing environment (natural rearing conditions in the hive versus in vitro rearing conditions in the laboratory), we performed a multivariate redundancy analysis (RDA). The first two components of the RDA explained 87.60% of the variance. Production varied along the development (stages) and according to the rearing environment (RDA; Stage: F8,113 = 17.69, p = 0.001; Rearing: F1,113 = 23.26, p = 0.001), and the interaction between factors was significant (F8,113 = 4.74, p = 0.001). The first component of the RDA allowed the separation of samples from the last-instar larvae (L5) and sealed larvae (LS) groups from the rest of the stages (Figure 3). The second component separated samples reared in vitro from those reared in hives. This separation seemed to be linked with differential expression of MS, MO, and MP in the in vitro reared group compared with the in-hive reared group, which was more characterised by ML, EL, EN and to a least extent EP, MN, EO and ES.
Redundancy analysis (RDA) performed on brood ester pheromone (BEP) compounds captured at 9 different stages of honey bee brood, reared under natural (hive) or in vitro (IV) conditions. Compounds are represented by their IDs and grey arrows. MP, methyl palmitate; MS, methyl stearate; MO, methyl oleate; ML, methyl linoleate; MLN, methyl linolenate; EP, ethyl palmitate; ES, ethyl stearate; EO, ethyl oleate; EL, ethyl linoleate; ELN, ethyl linolenate.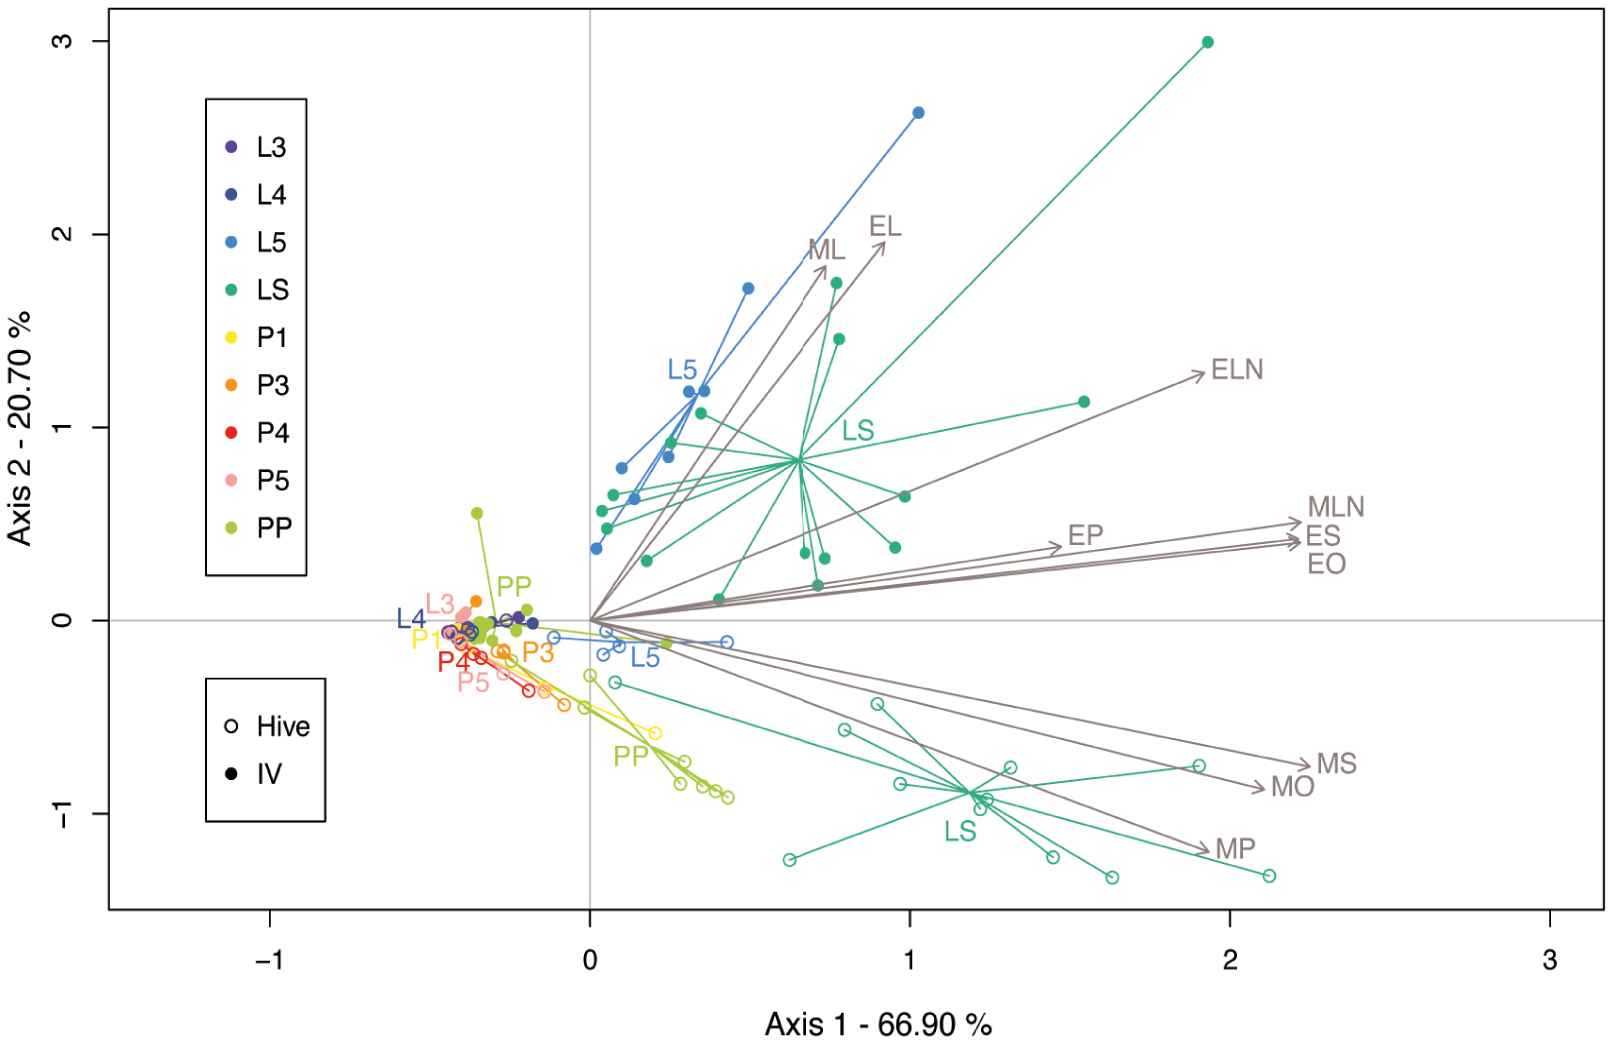
Comparison of total BEP productions according to stage and rearing environment showed significant differences in total BEP abundance (Fstage = 73.81, p < 2 × 10⁻¹⁶; ddl = 8, 113; Fenvironment = 73.82, p < 10−14; ddl = 1, 113; Finteraction = 7.25, p < 10−8; ddl = 8, 113; Figure 4A). In particular, BEP amounts were similar during the open brood stages (L3, L4 and L5). However, significant differences were identified for the sealed larval stage (LS), prepupae, and all pupal stages, with more production in vitro compared with the hive-reared group (Figure 4A). Interestingly, total BEP amounts dropped dramatically in (pre)-pupae reared naturally, whereas they remained significant in pupae reared in vitro. The ethyl/methyl ratio varied according to the stage (F8,113 = 7.21, p < 10−6) and the rearing environment (F1,113 = 9.83, p = 0.0023), but significant differences were only detected at the PP and P3 stages, where more ethyl was emitted by the hive group than by the in vitro reared group (Figure S2).
Stage and rearing environment variations of brood ester pheromone (BEP) compounds. (A) Total amount of BEP variations. (B) Heat map showing the variations in the components of the BEP according to the stage in the hive-reared group. (C) Heat map showing the variations of the components of the BEP according to the stage in the in vitro reared group 5⩽n⩽15 per stage and rearing condition. Different letters indicate significant differences between groups. MP, methyl palmitate; MS, methyl stearate; MO, methyl oleate; ML, methyl linoleate; MLN, methyl linolenate; EP, ethyl palmitate; ES, ethyl stearate; EO, ethyl oleate; EL, ethyl linoleate; ELN, ethyl linolenate.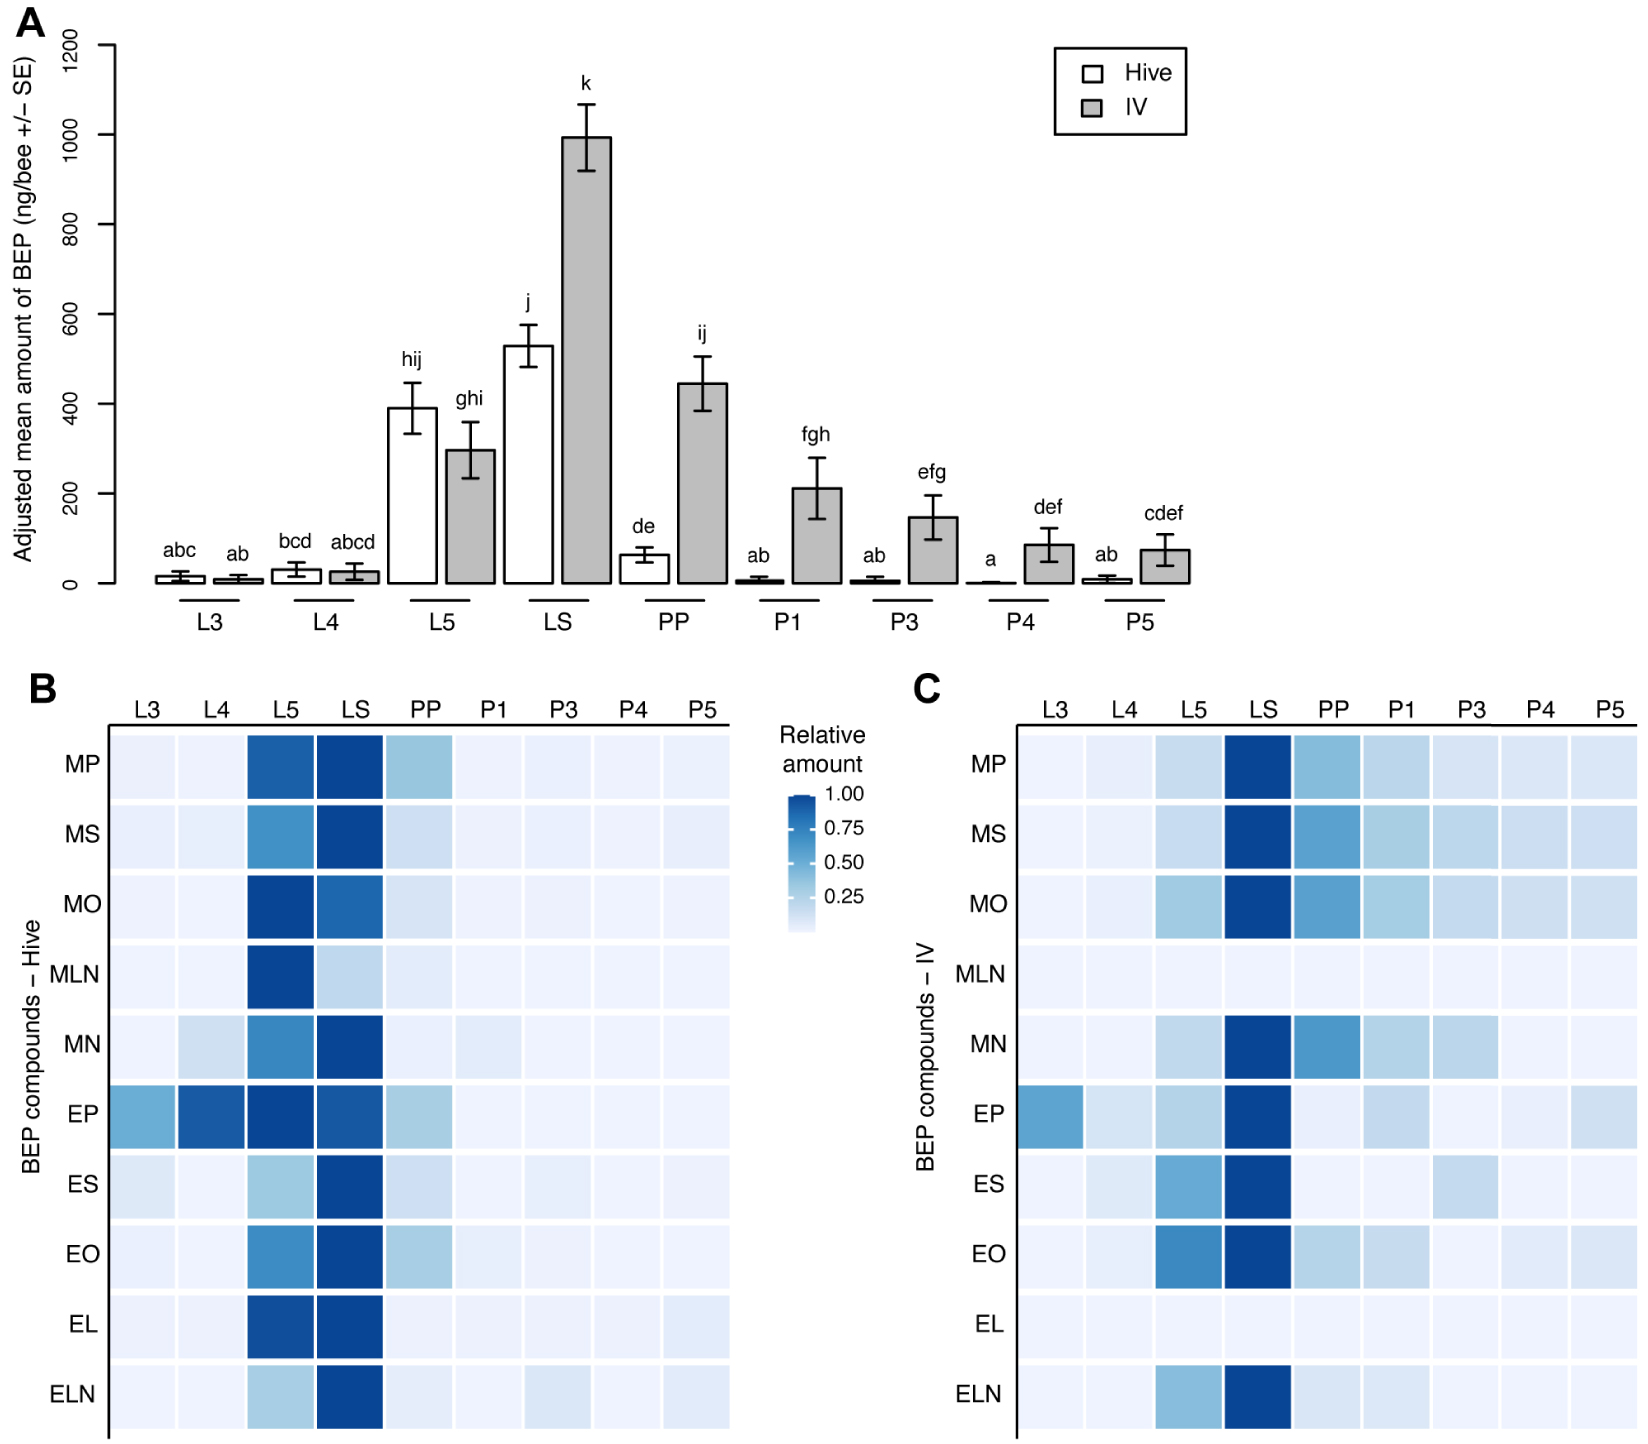
When looking at the evolution of each compound amount along development, the 10 BEP compounds showed overall similar variation patterns in both rearing environments, with low levels of production at the L3 and L4 stages, followed by drastic increases at the L5 and LS stages, before decreasing again to low levels during the pupal stage (Figure 4B, Figure S2, Table S2). However, in the hive group, two groups of BEP compounds could be distinguished. The first group, composed of MO, ML, and EP, reached their maximum at the L5 stage, whereas the second group (MP, MS, MLN, ES, EO, EL and ELN) peaked at the LS stage. All compounds had their most abundant amounts at the L5 and LS stages (Figure S2). Even though the overall patterns were highly similar in the in vitro reared group compared with the hive group, all compounds reached their maximum at the LS stage in the in vitro group, and ML and EL displayed overall low expression levels, which prevented the study of their developmental evolution pattern. The most abundant amounts were also quantified for the L5 and LS stages, similar to the hive group for the ethyl compounds; however, the most abundant amounts were observed for the LS and PP stages for the methyl compounds (Figure S2).
3. Discussion
This study investigated the ecophysiology of brood ester pheromone (BEP) production in honey bee brood. We highlight marked temporal differences in BEP produced by last instar larvae, with a peak at the end of the beekeeping season towards fall. In addition, comparison of BEP profiles during development and depending on the rearing conditions highlight important quantitative variations, with a peak of production in the last instar or sealed larvae. Larvae reared in vitro versus under natural conditions in their colonies displayed similar BEP profiles, whereas this was not the case at the pupal stage, where production was more abundant when bees were reared in vitro.
The developmental profile highlighted in this study corroborates previous findings. Trouiller et al. [22] also identified a peak in emission in 9-day-old larvae reared in the field, which corresponds to the last-instar larval stage (L5) described in the present study. Differences in the ethyl/methyl ratios of young (L3) versus old (L5) larvae have also been previously identified and are linked to the ability of adult honey bees to distinguish young from old larvae [9].
When comparing rearing environments, our results confirm that in vitro rearing methods seem suitable for studying the chemical ecology of honey larvae, especially the relationship between adults and the brood, as shown by highly similar BEP profiles in L3, L4, and L5 larvae reared in their hives or in vitro (the only differences were found for ES and MLN, and the L5 stage only). However, studying the chemical ecology of brood at the pre- and pupal stage under controlled conditions might require more caution. We observed a significant decrease in BEP production towards zero in (pre-)pupae when they were reared in the hive, which corresponds to earlier descriptions [22]. Surprisingly, despite their apparent normal and healthy morphological profiles, (pre-)pupae reared in vitro showed marked BEP production until the P5 stage (80 to 200 ng/bee on average). This marked production might be an indication of stress at this brood stage, as it has been suggested that sick pupae may also display significant amounts of BEP [18].
The influence of the season on chemical communication has been extensively investigated, both on the emission (pheromone production) and reception (behavioural and/or physiological response) sides. Many studies have identified seasonal differences in pheromone composition and/or quantity in various species, from plants to insects and birds [23, 24, 25, 26, 27, 28, 29, 30]. Such variations have been strongly linked with plant phenology and external environmental parameters, particularly temperature. In honey bee colonies, temperature inside the hive is a constant and tightly regulated feature, which therefore cannot explain changes in chemical compound production or emission. In social insects such as ants and termites, temporal changes have been highlighted, particularly for cuticular hydrocarbons [31, 32, 33, 34, 35]. However, these temporal changes were frequently linked to changes in the reproductive status and/or the social environment of the colonies. Seasonal variations (covering a period from spring to fall) have been described in Solenopsis invicta [32] and Formica tremcorum [31], but temporal and spatial factors were confounded in the latter case. Temporal changes in pheromone emissions during the active season have only been studied in bees for ethyl oleate (EO) in worker bees [36]. Interestingly, EO also increased at the end of the beekeeping season in worker bees in July and August. This trend was particularly strong in nectar foragers compared with nurses and pollen foragers [36]. The trend observed in larvae was similar overall for the 10 BEP compounds, but EO peaked in September in larvae and not in August. This could be due to environmental condition variability and/or caste differences between the brood and adults. Such an increase in fall may be linked to the special physiology of bees that are raised at this time of the year, when winter bees are produced. These bees have a longer life expectancy, with a distinct physiology [37], and such features might be initiated at the larval stage because different BEP emissions may trigger differences in brood care provided by adult bees [9].
These changes in production during the summer months may also reflect a different physiology at the colony level, as suggested by the influence of BEP on the regulation of labour among adults and its impact on colony growth rate [13]. Because BEP addition triggers an increase in pollen foragers and pollen load weights [13, 38, 39], such an increase in larvae may reflect a shortage in proteins in the colonies, as frequently reported by beekeepers at this time of the year. The bias in the ethyl/methyl ratio observed at the end of the season, especially in September (as reflected by the drastic increase in EO and the three other quantifiable ethyl esters), may also influence social regulation at the colony level. EO produced by adults delays the onset of foraging in worker bees [40]. Therefore, increased levels of EO in larvae may also produce the same effect and trigger a relative increase in nurse bees within the hive. This may be the result of larvae requiring higher care at this time of the year.
This descriptive study highlighted new features of the temporal chemical profile of honey bee brood. Changes according to the season (spring/summer/fall) and the rearing environment underline a knowledge gap in the understanding of the physiology of larvae and pupae and the link between stress and the chemical ecology profile of the brood. The next steps should involve more functional studies to assess the consequences of such changes in individual compounds or mixtures of several molecules on the behaviour and physiology of individuals within the colonies, using techniques such as electroantennography, similar to those described in [41]. The consequences of such changes in the brood ester pheromone profile at the colony level would be interesting to investigate. It would also provide new knowledge about how bees respond dynamically, both at the individual and colony levels, to changing environments.
Author contributions
FM, DB, and YLC designed the project. FM and MC performed in vitro rearing. FM and DB performed the chemical analyses. FM analysed the data and wrote the manuscript. YLC reviewed the manuscript.
Declaration of interests
The authors do not work for, advise, own shares in, or receive funds from any organization that could benefit from this article, and have declared no affiliations other than their research organizations.
Acknowledgments
We thank J. Senechal and D. Crauser for access to the honey bee colonies, and A. Noel for R tricks.