

Version abrégée
De nombreux processus industriels, comme la production de réactifs par catalyse, la valorisation des minerais par flottation ou la lutte contre la dégradation et la protection de notre environnement dans le cadre d'un développement durable exigent une meilleure compréhension à l'échelle locale (moléculaire ou sub-moléculaire) des phénomènes aux interfaces. L'exigence de connaissances nouvelles est donc tout particulièrement vitale dans le cas des systèmes qui dépendent des équilibres entre les solides et leur milieu ambiant. Il s'agit, sans doute, de l'une des voies les plus sûres qui permette, par une meilleure connaissance des processus élémentaires, de mieux prédire leur développement, afin de pouvoir, si nécessaire, mieux les contrôler ou les modifier avec efficacité, en vue d'améliorer ou de promouvoir de nouveaux procédés industriels. La connaissance des phases superficielles issues de la modification des propriétés d'un solide ou des phénomènes d'adsorption et d'échange nécessite la mise au point de techniques expérimentales appropriées, permettant, en particulier, l'acquisition des informations « in situ ». Pour cette raison, une méthode de spectroscopie infrarouge, la réflexion externe, a été développée. Elle permet l'obtention de manière univoque d'informations difficiles ou impossibles à atteindre avec les autres méthodes de spectroscopie infrarouge, telles la transmission, la réflexion diffuse, la réflexion totale atténuée ou la photo-acoustique. Cette méthode, couplée avec la simulation des phénomènes étudiés [1–23] permet d'obtenir des informations inédites sur les interactions minéral–solution aqueuse, telles que : (i) la nature des phases adsorbées ; (ii) les quantités d'adsorbat présentes à l'interface ; (iii) la distribution des produits sur la surface (couches adsorbées uniformes ou agrégats d'épaisseur variable) ; (iv) l'orientation des molécules adsorbées ; (v) l'organisation de la couche adsorbée ; (vi) – ce qu'il y a de très important – la cinétique, c'est-à-dire, dans ce cas particulier, le suivi en temps réel de l'évolution de la phase adsorbée en adsorption ou en désorption.
La technique développée permet, en outre, l'étude des phénomènes pour des systèmes formés de substrats hétérogènes et à plusieurs adsorbats. La variété, la précision et la fiabilité des informations fournies par cette technique sont meilleures que celles des résultats obtenus à l'aide des méthodes décrites ci-dessus. Les expériences sont rapides et non destructives. Sa haute sensibilité (à partir de 20 % d'une monocouche), sa capacité à acquérir les informations in situ dans un système multiphasé, même dans la région de forte absorption du substrat, font de cette technique un outil d'investigation unique et précieux. La complexité des spectres enregistrés, leur sensibilité à toutes les variations des propriétés optiques de toutes les phases du système et leur distribution spatiale sont, en fait, un atout majeur de cette méthode. Dans cette courte présentation seront détaillés des exemples relatifs à la collection de deux sulfures (chalcopyrite et chalcocite) par les xanthates de potassium et de l'apatite, la fluorine et de la calcite par l'oléate de sodium.
Les recherches entreprises sur le système chalcopyrite (CuFeS2)–xanthate de potassium (16, 18) montrent, sans les ambiguı̈tés habituelles, la formation, après 10 min de contact, de xanthate de cuivre (bande à 1200 cm−1) aux faibles valeurs du potentiel imposé (entre 180 et 290 mV) et la formation d'une couche mixte xanthate de cuivre–éthyldixanthogène (bande à 1268 cm−1) pour les valeurs de potentiel supérieures à 300 mV (Fig. 3). L'accroissement du temps de contact jusqu'à une heure provoque une forte augmentation de la quantité de xanthate de cuivre fixé sur la surface et la formation de l'éthyldixanthogène à une valeur de potentiel plus faible de 20 mV (Fig. 4). La formation de xanthate de cuivre n'est observée qu'à partir d'un potentiel de 210 mV ; la quantité adsorbée correspondante est alors voisine de la monocouche statistique (Fig. 4a).
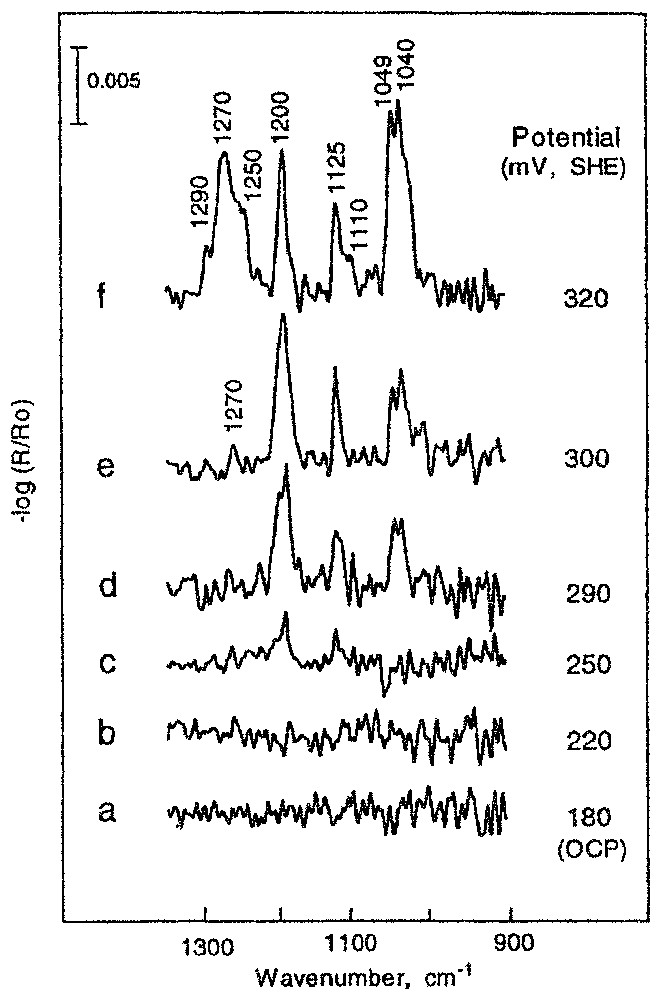
Reflection spectra of chalcopyrite contacted with ethyl xanthate solution of 2×10⁻⁴ M during 10 min, at various potentials.
Spectres en réflexion de la chalcopyrite après contact avec la solution de 2×10⁻⁴ M d'éthylxanthate pendant 10 min, à différents potentiels.
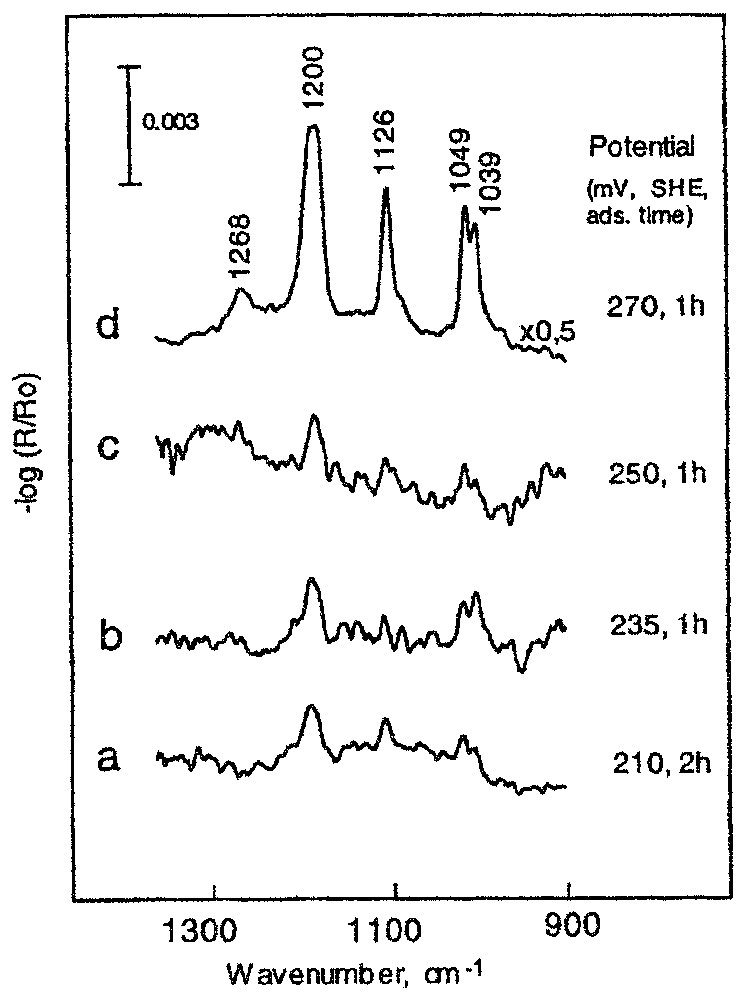
Reflection spectra of chalcopyrite contacted with ethyl xanthate solution of 2×10⁻⁴ M during prolonged times, at various potentials.
Spectres en réflexion de la chalcopyrite après contact avec la solution de 2×10⁻⁴ M d'éthylxanthate pendant un temps prolongé, à différents potentiels.
L'étude du système éthylxanthate de potassium–chalcocite (Cu2S) met en évidence les faits suivants : (i) les spectres obtenus à divers angles d'incidence et deux polarisations mettent en évidence la formation de xanthate de cuivre et d'une bande à 1225 cm−1, observable au voisinage de la monocouche statistique et caractéristique d'un produit superficiel non identifié, mais qui disparaı̂t après immersion dans l'eau ; (ii) il est possible, à partir des résultats obtenus, de proposer une position de la molécule de xanthate sur la surface (Fig. 6) ; (iii) le produit non identifié empêche la formation d'agrégats superficiels à structure bien organisée. Sa disparition provoque une réorganisation de la couche adsorbée et la formation de phases superficielles ordonnées ; (iv) dans ce système, l'observation in situ permet d'observer la formation du xanthate de cuivre sur la surface dès l'application d'un potentiel de 15 mV (SHE), alors que le dixanthogène n'apparaı̂t que pour des valeurs supérieures à 200 mV (Fig. 7) [16,18]. Le dixanthogène, produit fortement hydrophobe, est présent sous forme liquide dans la phase superficielle, ce qui favorise son étalement sur la surface et la flottation du minéral. Ce produit n'est pas stable lorsqu'il est retiré de la solution. Son étude n'est donc possible qu'avec des techniques d'observation in situ.
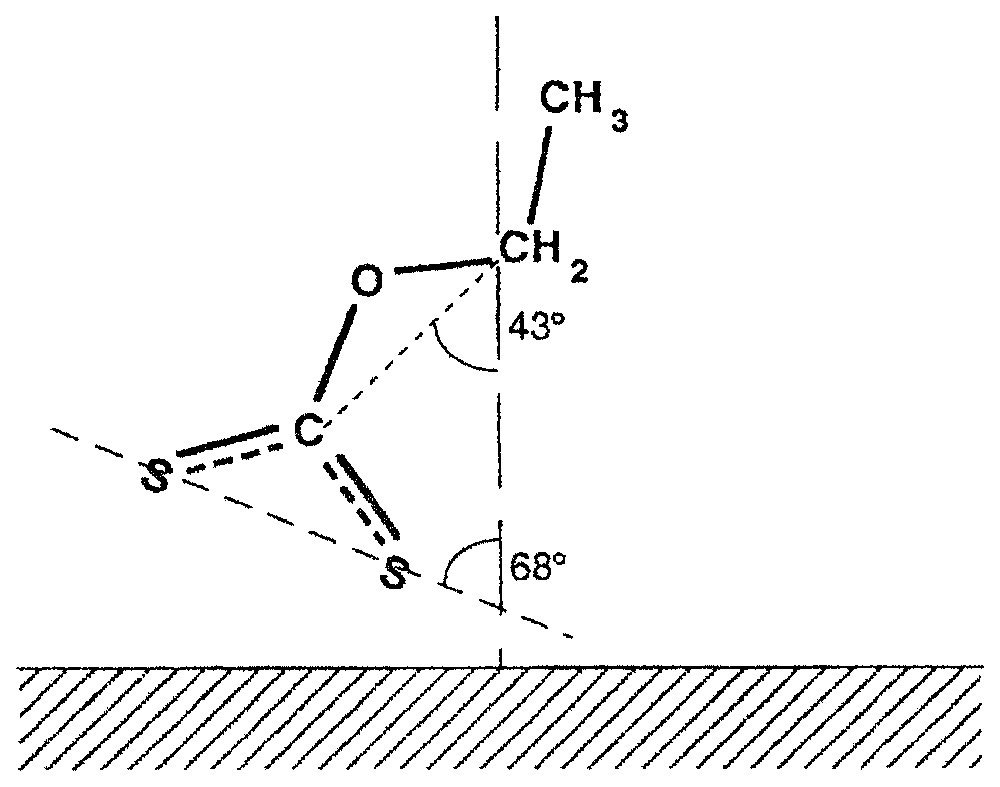
Molecular conformation of an ethyl xanthate molecule adsorbed on a chalcocite surface.
Conformation moléculaire de la molécule d'éthylxanthate adsorbée sur la surface de la chalcosite.
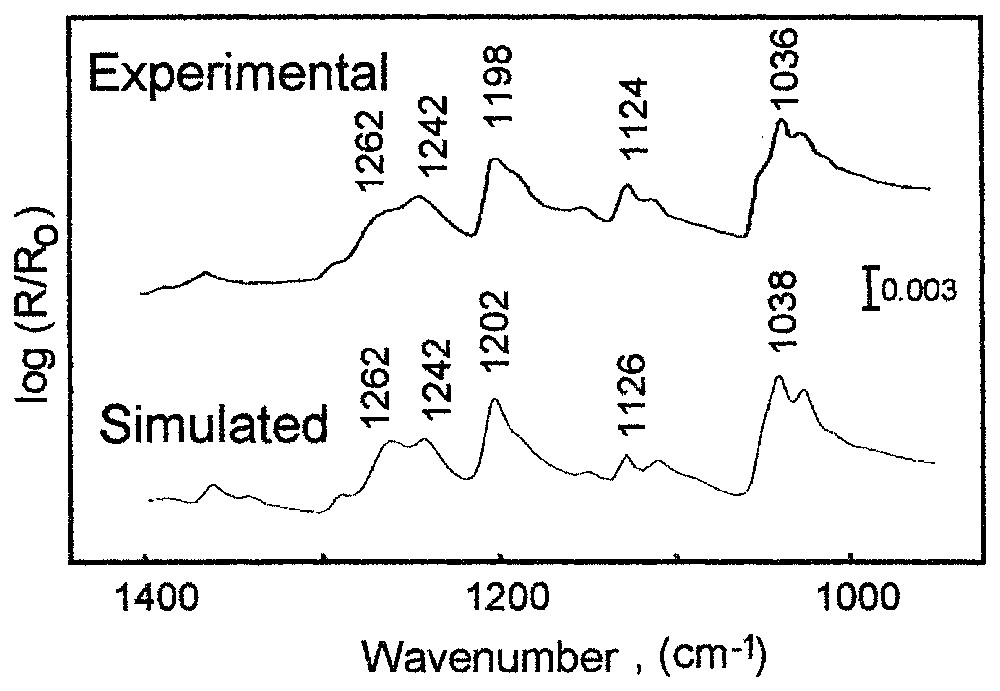
Reflection spectra for p-polarisation: experimental in situ spectrum of a chalcocite electrode in an ethyl xanthate solution (concentration: 1.6×10⁻⁴ M), at a potential of 370 mV; simulated spectrum of a 5.2 nm isotropic layer of cuprous ethyl xanthate and of a 6.9 nm layer of the liquid form of dixanthogen on chalcocite.
Spectres en réflexion mesurés en polarisation p : spectre expérimental mesuré in situ de l'électrode de chalcosite dans la solution d'éthylxanthate (concentration : 1,6×10⁻⁴ M) à un potentiel de 370 mV ; spectre simulé de la couche isotrope de l'éthylxanthate de cuivre d'épaisseur 5,2 mm et de la forme liquide du dixanthogène, d'épaisseur 6,9 mm sur la surface de la chalcosite.
Les recherches engagées en vue de préciser le mécanisme d'adsorption des sels d'acide gras sur l'apatite, la fluorine et la calcite ont permis de mettre en évidence de nombreux faits nouveaux.
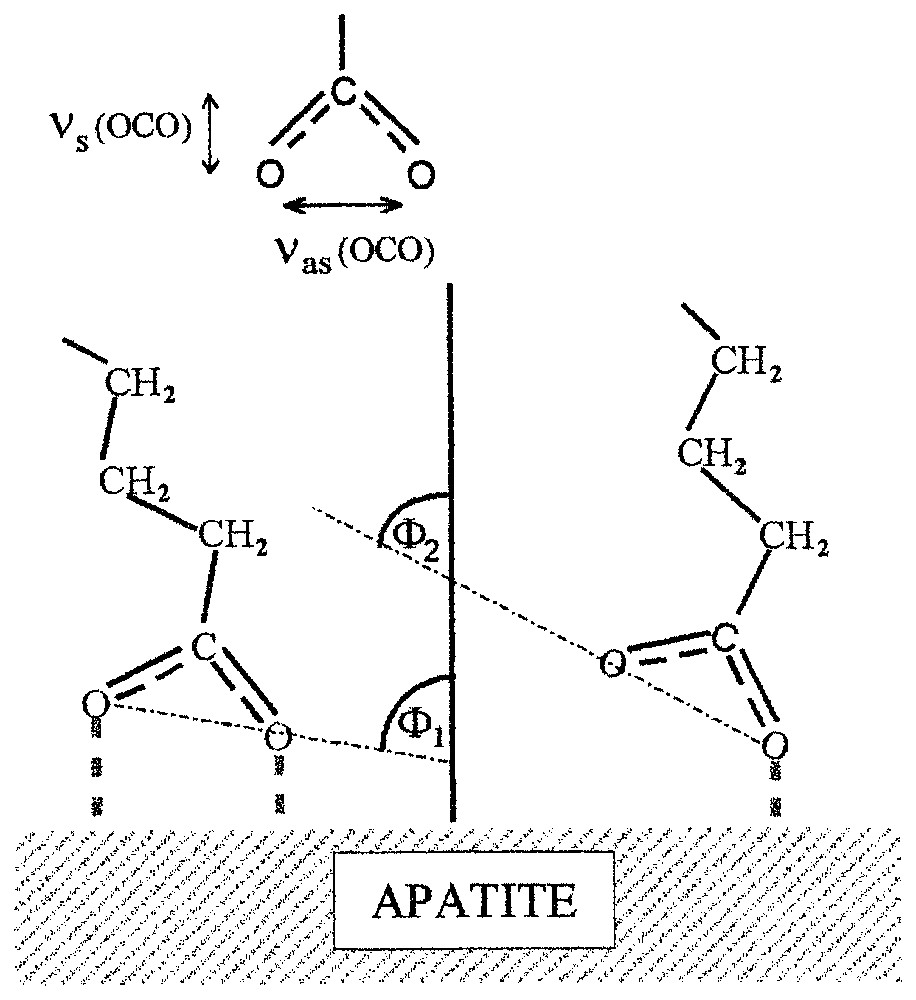
- (i) Les groupes carboxyliques présents sur ces surfaces [13,14,19,20] peuvent prendre deux types de conformations sur ces surfaces minérales, suivant l'accessibilité des ions calcium en premiers voisins, la forme bidentate, caractérisée par une bande d'absorption à 1539 cm−1, et la forme unidentate, caractérisée par une bande d'absorption à 1575 cm−1 (Fig. 9 ; respectivement angle Φ1 et Φ2).
- (ii) Sur les plans de clivage (111) de la fluorine, la forme bidentate est prédominante et diminue par la production de défauts structuraux ; la quantité de conformations unidentates est fonction du nombre de défauts superficiels.
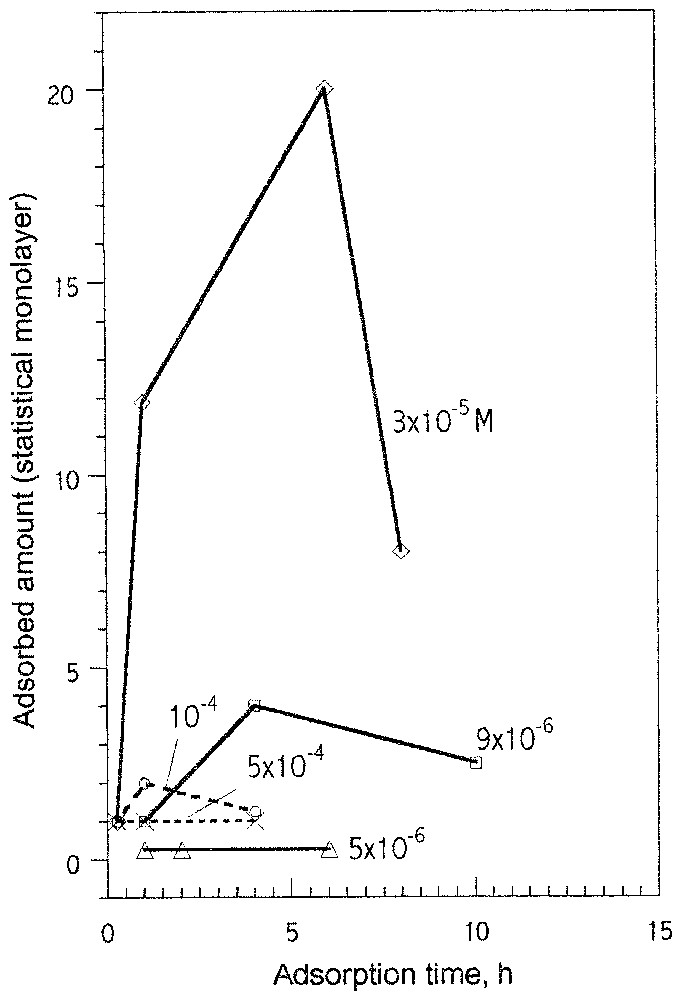
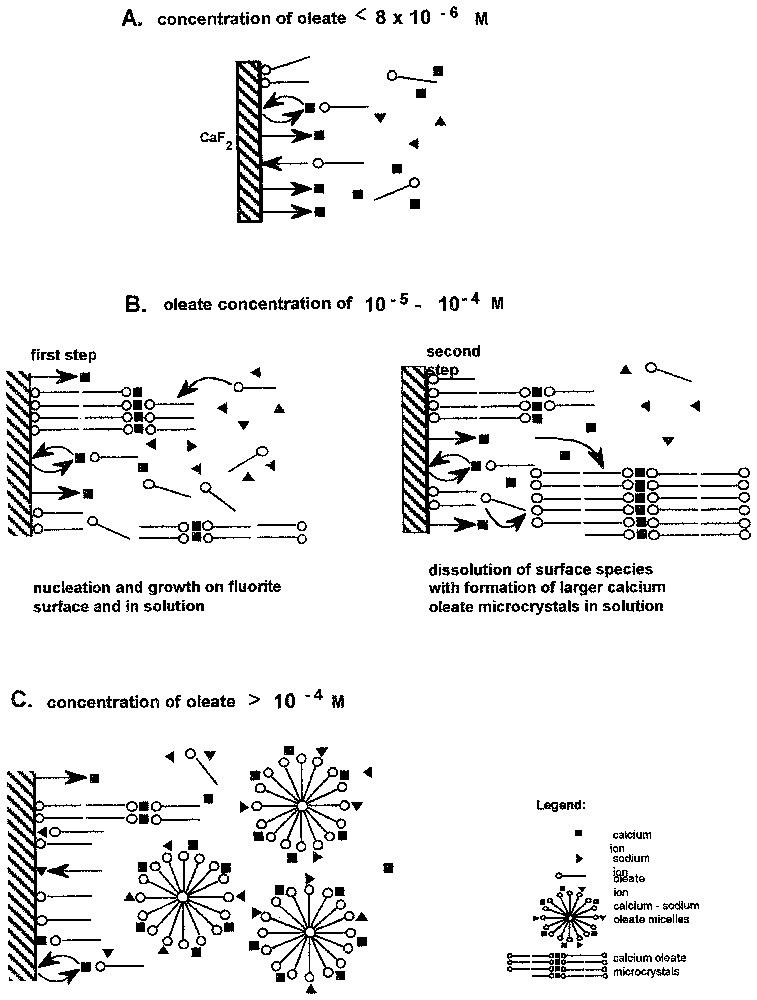
- (iii) Pour la première fois, la cinétique d'adsorption des ions oléate a pu être étudiée ; elle a mis en évidence les faits suivants : le domaine d'adsorption stricto senso est limité aux très faibles valeurs de concentration d'équilibre ; le tensioactif précipite très rapidement sur la surface pour donner des couches épaisses, qui diminuent d'épaisseur en fonction de la concentration en tensioactif et au cours du temps, à cause des conséquences du mûrissement d'Ostwald, qui permet le transfert des molécules de la surface vers la solution aqueuse, dans laquelle se forment des phases tridimensionnelles d'oléates de calcium mieux cristallisées que sur la surface. Ce transfert intervient d'autant plus vite que la concentration est élevée. Pour les plus fortes valeurs de la concentration, l'apparition de micelles dans la solution inhibe fortement la condensation tridimensionnelle sur support (Figs. 11 et 12).
Determined molecular arrangement of adsorbed oleate molecules.
Arrangement moléculaire des molécules d'oléate adsorbées.
Adsorbed amount of oleate on fluorite versus time at different initial oleate concentrations, revealed by spectroscopic study of the mineral surface.
Quantité d'oléate adsorbée sur la surface de la fluorine (déterminée par les études spectroscopiques de la surface de minéral) en fonction du temps d'adsorption, à partir de solutions de concentrations initiales différentes.
Mechanisms of interaction of fluorite with oleate solutions at pH 10.
Mécanismes d'interaction de la fluorine avec la solution d'oléate à pH 10.
Ces quelques exemples montrent sans ambiguı̈té l'intérêt de l'utilisation de la spectroscopie de réflexion externe pour la connaissance des phases adsorbées, notamment celles constituées de substances organiques, y compris dans le cas de solides absorbant fortement le rayonnement infrarouge (14).
1 Introduction
Monitoring and understanding surface phenomena, at molecular and atomic levels, at natural mineral interfaces in contact with aqueous solutions is the subject of the work presented here. Minerals are usually complex, multicomponent, heterogeneous systems, and cannot be described by a single value. They interact with aqueous solutions through complex dissolution/precipitation, adsorption/desorption processes, in which the nature and structure of the produced surface outermost layers play a crucial role. The understanding of the mechanisms of interaction of the first molecules with solid surfaces is the fundamental requirement for making possible the prediction, control and modification of the macroscopic phenomena taking place in nature and for designing efficient technologies.
Monitoring the formation of surface species at submonolayer and monolayer levels, and their structure requires application of the appropriate experimental techniques. Infrared spectroscopy is particularly well suited to determine surface composition at a molecular level. Infrared spectroscopy is functional group selective, so it is particularly well suited to detect small changes of the molecular microenvironmental properties as those emerging at the interfaces. Experiments can be performed in situ in both gas–mineral and aqueous solution–mineral interfaces. There is only very gentle interaction of the infrared beam (less than 0.3 eV) with the examined sample, which ensures its stability during the investigation processes. The recent instrumental development of infrared spectroscopy is contributing significantly to the increased emphasis being placed on molecular level surface characterisation. To perform the proper interpretation of reflection spectra for a more detailed picture of the interfacial structure, it is of the greatest importance to combine spectroscopic measurements with a spectral simulation of the predicted surface composition and structure. The importance of such combination is reinforced by the anticipated sensitivity of surface infrared absorbance, not only to surface concentration, but also to adsorbate structure, molecular orientation, surface distribution, lateral interaction, surface diffusion, molecular recognition, and to the so-called optical effects.
Several unique advantages of the developed infrared external reflection method are overviewed in this presentation. The different examples of mineral–aqueous solution systems are discussed, for which detailed qualitative and quantitative evaluations of the produced surface layers were performed.
2 Fundamentals and unique properties of the developed infrared reflection technique
A schematic diagram of the interaction of an electromagnetic wave with a simple three-phase system is presented in Fig. 1. For a polarisation perpendicular to the plane of the incident beam (s-polarisation) there is only one electric vector parallel to substrate plane E⊥Y for all incident angles. Hence, only molecular groups of the adsorbed species having a dipole transition moment parallel to the interface in the y direction can interact with the incident radiation and produce absorbance band A⊥Y. For parallel polarisation (p-polarisation), there are two electric vector components at the interface, one parallel EIIX and one perpendicular EIIZ to the substrate plane. Therefore, for the p-polarisation case, the molecular groups showing dipole transition moments parallel and vertical to interface in the x and z directions can produce absorbance bands. The intensities of the absorbance bands recorded for the two polarisations A⊥ and AII are characteristic of the nature of the vibration of particular molecular group, the amount of surface species, and depend strongly on angle of the incident beam and the orientation of molecules in the surface layer.
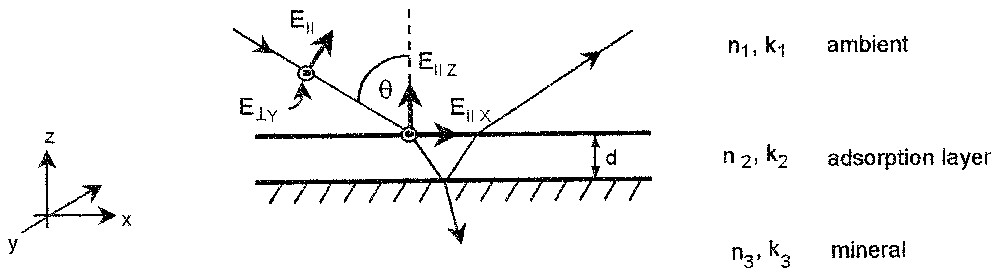
Schematic diagram of interaction of incident beam with the adsorption layer on a mineral surface.
Diagramme schématique de l'interaction entre le faisceau incident et la couche adsorbée sur la surface du minéral.
The infrared beam reflected from mineral surface carries all the information about surface composition and structure. The recorded reflection spectra of the investigated sample at different incident angles and polarisations of the incident beam are sufficient to describe qualitatively and quantitatively the surface phenomena taking place at mineral surfaces. Each recorded spectrum at different optical conditions carries specific spatial information about the composition and structure of the surface layer. With proper manipulation of the experimental conditions, i.e., incident angle and polarisation, it is sufficient to record two or three spectra that together give a three-dimensional ‘picture’ of the surface species present at the mineral interface. The technique is based on the comparison of the experimental spectra with the simulated spectra of the hypothetical surface layer with the assumed composition and structure, as is shown in following sections. Examples of optical considerations and spectra simulations for different multilayer stratified systems with non-metallic substrates can be found in several papers [1–3,5,7,9,20,22–24]. The reflection phenomena at metal surfaces were already described in the 1960s [4,6,8] and they are not the subject of this presentation.
An important advantage of the performed spectral simulation is the possibility to predict the best experimental optical conditions, which give the optimum of the experimental sensitivity and the maximum confidence in the interpretation of experimental results (see for example [15]). This significantly speeds up the experimental procedure.
The developed technique has very unique properties compared to other known infrared techniques as transmission, diffuse reflectance (DRIFT) or attenuated total reflection (ATR). It allows obtaining almost all the details about the mineral-aqueous solution interactions including:
- (i) the nature of the adsorbed products (by which a molecular group of the adsorbed molecule interacts with mineral surface and what surface sites are involved in this interaction);
- (ii) the orientation and organisation of the adsorbed molecules (through the orientation of particular molecular groups);
- (iii) the adsorbed quantities of different surface products (starting from 20% of monolayer);
- (iv) the surface distribution of the adsorbed species (uniform layer or patch-like structure with specific thickness);
- (v) dynamic phenomena such as kinetics of adsorption/desorption, stability of surface products and structures, mobility of the adsorbed species on mineral surfaces.
There is almost no limitation for system under investigation. Any type of mineral sample can be investigated, from the transparent to non-transparent for infrared radiation. The ability to perform good research in very complex systems is probably the most unique capability of the technique. Therefore, it is predicted that the most difficult cases of investigation of the complex natural geochemical and geo-bio-chemical systems could be successfully studied.
3 Examples of monitoring of molecular phenomena at mineral–aqueous solution interfaces
At first, the application of infrared external reflection spectroscopy to monitor surfaces of different sulphide minerals at controlled and open circuit potentials is discussed; examples of complex surface phenomena taking place at semi-soluble mineral surfaces at the molecular level will follow.
3.1 Experimental results and spectral simulations of nature and structure of the adsorbed species
3.1.1 Surfactant adsorption on chalcopyrite
The interpretation of the spectra of the adsorbed layer recorded by external reflection techniques at different polarisations and incident angles is not straightforward. The spectra are very different from the corresponding transmission spectra of the same species. They are very sensitive to recording conditions (optical effects) and nature and structure of the produced surface layer. These phenomena can be seen in Fig. 2, where experimental and simulated spectra of a cuprous ethyl xanthate isotropic layer on chacopyrite (CuFeS2) for two polarisations and three incident angles are presented. Ethyl xanthate (CH3CH2OCS2−) is a common reagent used for selective surface hydrophobisation and then separation of different sulphide minerals. The experimental spectra of the same sample are very different; they show ‘negative’ and ‘positive’ bands, with very different intensities. Their interpretation is not possible without a comparison with simulated spectra of assumed adsorbed layer with specific nature and structure. The presented simulated spectra (Fig. 2) were calculated for 3-nm thick isotropic cuprous ethyl xanthate layer. Details of the calculations can be found in previous works [9,13,18]. A very good agreement between the experimental and simulated spectra for all recorded conditions indicates that the adsorbed product and its structure are those of the assumed hypothetical layer. The small differences between the predicted and recorded spectra presented in Fig. 2 indicate an orientation of the adsorbed xanthate molecules on chalcopyrite [18].
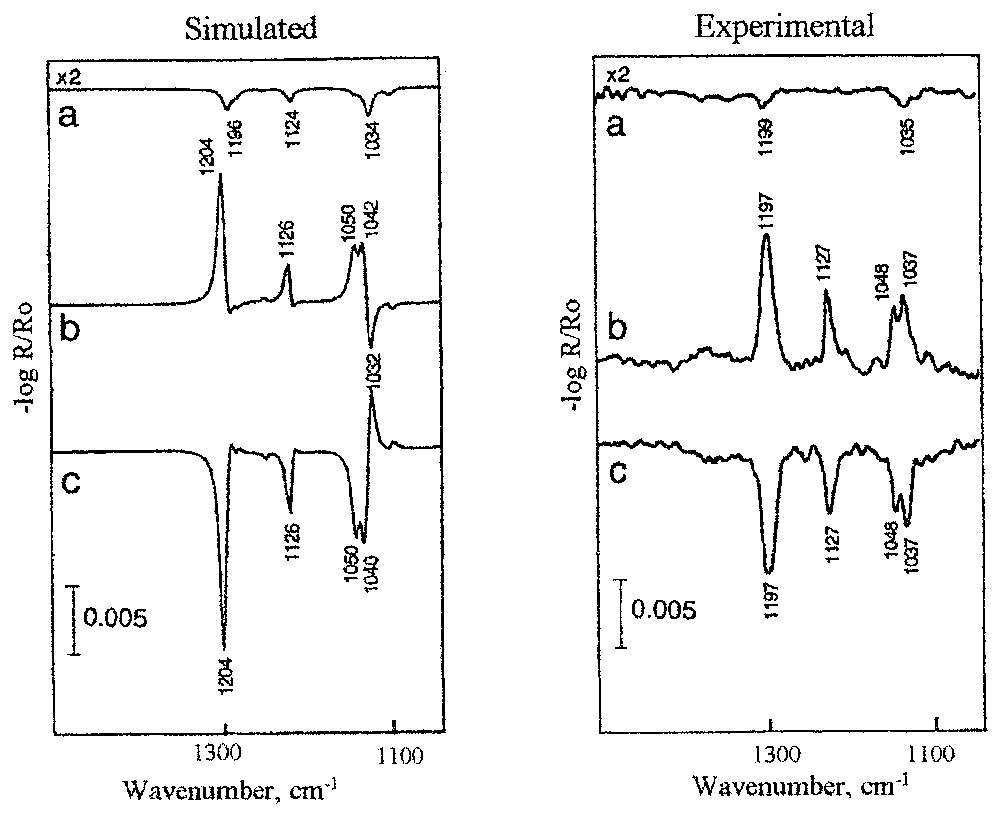
Simulated spectra of hypothetic 3-nm-thick isotropic layer of cuprous ethyl xanthate and experimental spectra of ethyl xanthate adsorbed layer on chalcopyrite. Spectra are calculated and recorded for different optical conditions: (a) 20° and s-polarisation, (b) 70° and p-polarisation, (c) 80° and p-polarisation.
Spectres simulés de l'hypothétique couche isotrope d'épaisseur 3 mm de l'éthylxanthate de cuivre et spectres expérimentaux de la couche d'éthylxanthate adsorbée sur la chalcopyrite. Les spectres ont été calculés et mesurés pour des conditions différentes : (a) 20° et s-polarisation, (b) 70° et p-polarisation, (c) 80° et p-polarisation.
Chalcopyrite is a semiconductor, as other sulphide minerals. Adsorption of xanthate on sulphides is a charge transfer reaction; therefore, it can be controlled by the application of an external potential. Results of spectroscopic studies of the surface composition of chalcopyrite that has been in contact with a xanthate solution for 10 min at various potentials [18] are presented in Fig. 3. These spectra were recorded at the optical conditions that ensure the best sensitivity for the system under investigation, i.e., p-polarisation and an incident angle of 70° (see explanation above). The lowest potential applied in these studies was the open circuit potential (OCP), i.e., 180 mV (SHE), and the highest potential value (320 mV) was in the region where the oxidation of chalcopyrite takes place. The spectra presented in Fig. 3a and 3b show no adsorption of ethyl xanthate at 180 mV. The absorption bands at about 1200 and 1125 cm−1 are visible at 250 mV (Fig. 3c), indicating the formation of the cuprous ethyl xanthate complex. All absorbance bands characteristic of cuprous ethyl xanthate, i.e., at 1200, 1125, 1049 and 1040 cm−1 are well visible at a somewhat higher potential (Fig. 3d). At a potential 10 mV higher (Fig. 3e), an additional band at 1270 cm−1 is observed, indicating the formation of a small amount of dixanthogen, (CH3CH2OCS2)2. A future small increase (20 mV) of potential up to a value of 320 mV (Fig. 3f) results in a very strong increase of the amount of ethyl dixanthogen produced at the mineral surface, while the amount of cuprous ethyl xanthate complex remains almost unchanged.
The above results show that the first ethyl xanthate adsorption product appears on chalcopyrite at a potential between 220 and 250 mV after a 10 min adsorption. The extension of the adsorption time up to 1 h significantly changes the surface composition (Fig. 4). At a potential of 270 mV (Fig. 4d), the amount of cuprous xanthate is about four times higher than that observed at 290 mV after 10 min of adsorption (Fig. 4d). A small band occurring at 1268 cm−1 indicates the formation of dixanthogen at a potential 30 mV lower if the extended adsorption time was applied. It is important to note that a lowering of the potential of only 20 mV down to a value of 250 mV results in a tremendous decrease in the amount of cuprous xanthate formation, and ethyl dixanthogen is not observed at this potential. An almost identical result was obtained at 235 mV (Fig. 4b). Two hours of contact with the xanthate solution is required to observe surface cuprous ethyl xanthate on chalcopyrite at a potential of 210 mV (Fig. 4a). At a potential of 200 mV, there was no indication of ethyl xanthate adsorption. Therefore, the value of 210 mV was assumed as a thermodynamical potential of ethyl xanthate adsorption on chalcopyrite. The amount adsorbed at this potential (Fig. 4a–c) was estimated close to monolayer coverage.
3.1.2 Ethyl xanthate interaction with chalcocite
Adsorption of ethyl xanthate on chalcocite (Cu2S) has been performed at open circuit potential (OPC) using solutions with different concentrations and pHs. The reflection spectra were recorded at different angles of incidence and two polarisations, which ensures the determination of all possible vibrations characteristic for the adsorbed molecules (Fig. 5). These experimental spectra were compared to results of the spectral simulation of the cuprous sulphide–adsorbed ethyl xanthate layer system. The details of optical consideration of xanthate–chalcocite system can be found in the recent papers [9,15].
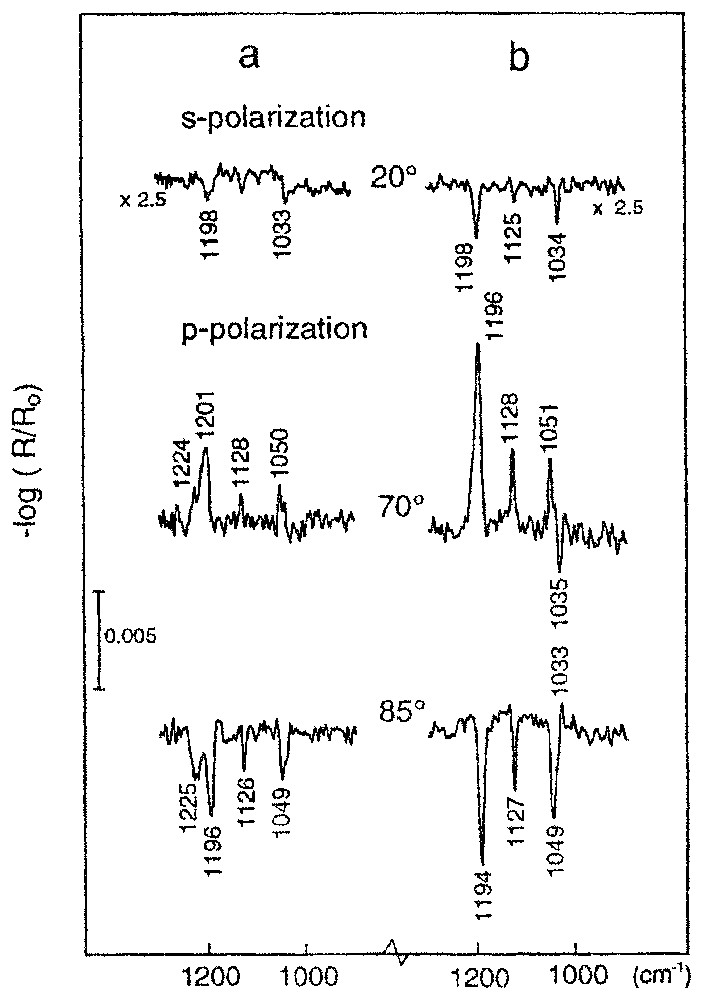
Reflection spectra of ethyl xanthate adsorbed on chalcocite: (a) spectra recorded immediately after 5 min of adsorption; (b) sample (a) after additional 30 min immersion in water.
Spectres en réflexion de l'éthylxanthate adsorbé sur la chalcosite : (a) spectres mesurés immédiatement après 5 min d'adsorption, (b) échantillon (a) après immersion dans l'eau pendant 30 min.
The spectroscopic results obtained for samples after xanthate adsorption show that cuprous ethyl xanthate is the surface product (absorbance bands at about 1200, 1130, 1050, and 1033 cm−1). Additionaly the band at 1225 cm−1 was also present. The reflection spectra show about monolayer coverage. The results obtained (Fig. 5a) clearly show that the band at about 1225 cm−1 is related to the formation of a surface product limited to submonolayer coverage. This band practically disappears from the reflection spectra at a multilayer coverage. Furthermore, because the band is observed at the incident angles of 70° and 85° for the p-polarisation and practically disappears for the s-polarisation (Fig. 5a), it is undoubtedly due to the fact that the molecular dipole moment is oriented almost parallel to the surface normal.
Very interesting changes in the structure and composition of the adsorbed layer were observed after holding the cuprous sulphide sample with the adsorbed xanthate layer in water over a period of about 30 min (Fig. 5b). It can be seen that the band at 1225 cm−1 disappeared. At the same time, the absorbance bands characteristic of the cuprous xanthate complex became sharp and more intensive, and the negative band at 1035 cm−1 is observed in the spectra recorded at 70° and for a p-polarisation. These observations indicate that the already adsorbed xanthate molecules undergo surface diffusion and reorganisation on the mineral surface, forming a well-ordered structure. The quantitative evaluation [15] enables the determination of the average positions of the molecular groups of the xanthate molecules, i.e., COC and SCS, in the adsorption layer. The results are presented in Fig. 6. The calculated average thickness of this adsorption layer is 2.0 nm, which represents about two oriented monolayers. A quantitative evaluation of the sample presented in Fig. 5a gives a value of about 1.8 nm. This good correlation between surface coverages rates found for the same sample, before and after immersion in water, supports the conclusion about surface diffusion of adsorbed xanthate molecules and their reorganisation in a well-organised structure. Simultaneously, the surface product with a band at 1225 cm−1 was removed. These results implies that the first step of the formation of the self-assembled cuprous xanthate layer is governed by a very high affinity between xanthate ions and cuprous sulphide and by the formation of the surface product with a band at 1225 cm−1. The latter species hamper the formation of the ordered surface layer. The surface product with the band at 1225 cm−1 can act as an impurity, which disturbs the formation of the organised surface structure. Removal of this product allows reorganisation of the adsorbed xanthate molecules to form a well-ordered structure. This surface rearrangement can be achieved by immersing the cuprous sulphide with adsorption layer in water or, even better, in a low-concentration xanthate solution.
3.2 Advantages of in-situ spectroelectrochemical studies
In situ measurements under potential control are more complicated than ex situ ones, but they are the only way of getting information about all of the produced surface species including those less stable after sample emersion from an aqueous solution. A special experimental cell has to be constructed with a transparent for an infrared beam window holding a layer of aqueous solution at a mineral interface [15]. A minimum five-phase system: air–window–solution layer–adsorption layer–mineral has to be considered. In fact, in the performed experiments, a two-component adsorption layer was determined, which increases the phase number to six.
It has already been demonstrated [15] that optical properties of window material and thickness of aqueous solutions have to be carefully chosen to obtain optimal experimental sensitivity and, equally as important, to reach the maximum of confidence in the interpretation of the experimental spectra. They are two major factors, which determine the optimal optical configuration of the designed in situ spectroelectrochemical cell.
The complex experimental in-situ spectroelectrochemical configuration, and the produced multicomponent surface coverage of mineral at controlled potential were successfully simulated [15]. An example of the results obtained are presented in Fig. 7, which shows the recorded in situ experimental spectrum of the adsorbed layer of ethyl xanthate on chalcocite and the simulated spectrum calculated for the experimental configuration with the assumed surface composition and surface structure. One observes a very good agreement between them. This allows concluding that there are two surface products, i.e., cuprous ethyl xanthate complex (band at 1198 cm−1) and dimmer–ethyl dixanthogen (doublet at 1242, 1262 cm−1) produced by ethyl xanthate ion oxidation. The dimmer is not very stable on the mineral surface after the removal of the mineral sample from solution, but its presence is crucial for increasing mineral hydrophobicity. The in situ studies allow determining accurately the electrochemical conditions of dixanthogen formation. The cuprous xanthate complex is formed directly on the mineral surface at a mineral potential above 15 mV, while the dixanthogen is produced at a potential higher than 200 mV, and is spread on the surface as the upper layer. The average thickness of cuprous amyl xanthate is 5.2 nm, while dixanthogen forms a 6.9 nm thick layer. It was determined that the produced dixanthogen is in its liquid form, which significantly enhances a lateral diffusion of this very hydrophobic product on the mineral surface.
3.3 Molecular recognition
This phenomenon is discussed based on experimental results obtained for oleate adsorption on different semi-soluble calcium minerals [13,19,20]. An adsorbed monolayer of oleate on apatite shows two conformations of carboxylate groups (the bands at 1575 and 1539 cm−1, Fig. 8) present in almost equal amount. This suggests that the oleate molecules in the first layer are adsorbed on two different calcium sites that are available on mineral surface in equal amounts. This agrees with the surface layer structure of the (100) plane of the used sample of apatite, where two types of calcium sites with either easy or more difficult access for oleate molecules are present [13]. The different availability of the two surface calcium sites could also explain the presence of the two conformations of the adsorbed oleate molecules. Hence, it could be suggested that molecular recognition of surface calcium sites are responsible for bidentate and unidentate conformations of the adsorbed oleate molecules (Fig. 9). The calculated orientation angles φ for these two conformations are 83° and 62°.
Experimental reflection spectra of self-assembled layer of oleate on apatite after adsorption from a 3.3×10⁻⁵ M oleate solution at pH 10 for 10 min: (a) 20°; (b) 20°; (c) 40°; (d) 70°.
Spectres expérimentaux en réflexion de la couche d'oléate sur l'apatite après adsorption de la solution d'oléate à la concentration de 3,3×10⁻⁵ M et pH 10 pendant 10 min : (a) 20° ; (b) 20° ; (c) 40° ; (d) 70°.
The molecular recognition effect of the adsorption of oleate on fluorite was investigated [19] on the mineral surface prepared by cleavage. In an ideal situation, the fluorite cleavage plane (111) has only one type of calcium atoms uniformly distributed with an equal interatomic distance of 0.386 nm. This suggests that in the case of perfect conditions for a well-organised monolayer, only one type of carboxylate group, i.e., the bidentate form with an absorbance band at about 1537 cm−1, should be observed. The experiments repeated for several cleaved fluorite samples show that the intensity ratio between the unidentate and bidentate conformation varied significantly from sample to sample, though the solution conditions are the same. The expected bidentate conformation, the band at 1537 cm−1 (Fig. 10), with an orientation angle of 80° is the dominating observed surface product below and at nearly monolayer coverage (for comparison see spectra in Fig. 8). This indicates that the molecular recognition effect of the surface calcium atoms of fluorite by adsorbed oleate molecules from solution takes place. Nevertheless, the unidentate conformation is also present. This is explained by the fact that the real surface of the cleaved fluorite on a microscopic scale is not perfect, showing local perturbations, presence of steps, dislocations, etc., although the X-ray diffraction shows an ideal (111) cleavage plane. It was found that the amount of the unidentate conformation is related to the amount of crystallographic defects on the real cleavage plane of the mineral sample [19].
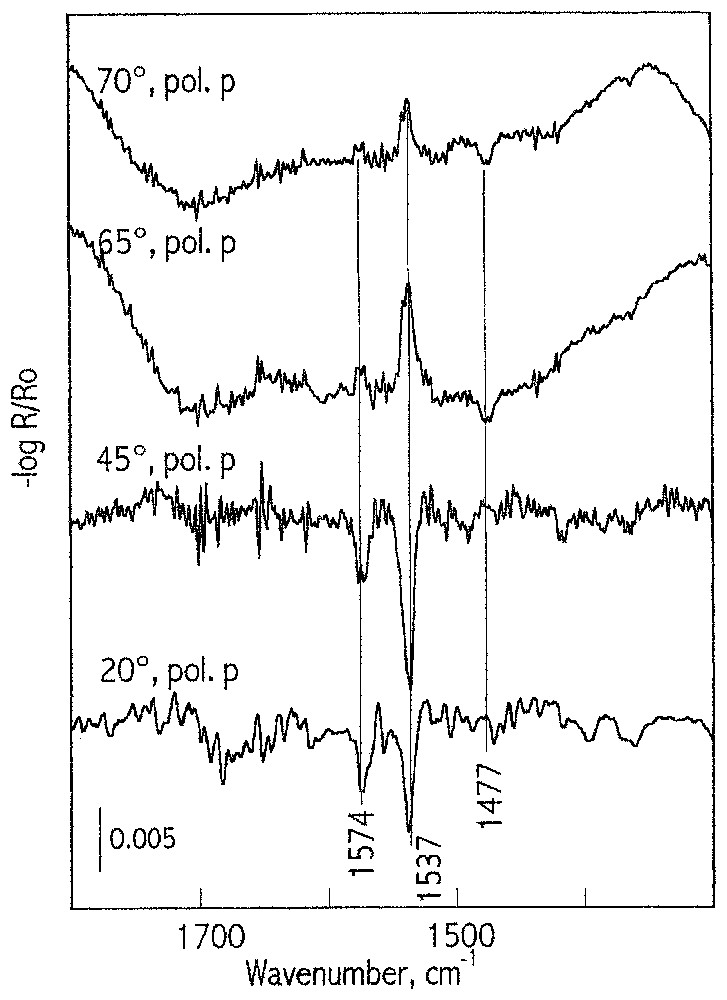
Reflection spectra (carboxylate vibration region) of the adsorbed layer of oleate on the cleavage plane (111) of fluorite after 2 min of adsorption. Spectra are recorded for p-polarisation and different angles of incidence.
Spectres en réflexion (dans la région des vibrations des carboxyles) de la couche adsorbée d'oléate sur le plan de clivage (111) de la fluorine après 2 min d'adsorption. Les spectres ont été mesurés en polarisation p à différents angles d'incidence.
3.4 Mechanism of interaction of fluorite with oleate solution
Kinetics of adsorption of oleate on fluorite at pH 10 shows very interesting features [20]. The maximum of the adsorbed oleate is observed at an initial concentration in solution of 3.3×10⁻⁵ M after 6 h of adsorption (Fig. 11). The amount adsorbed versus time shows also a maximum at other concentrations, as shown in Fig. 11. These findings indicate complex phenomena taking place at fluorite surface contacted with oleate aqueous solutions, such as: fluorite dissolution and interaction with water, ion exchanges, adsorption/desorption of oleate ions and other oleate aggregates from the solution. The surface composition and structure result from these competitive processes. Fluorite immersed in oleate basic solutions shows surface phenomena dependent on the initial oleate concentration if other solution conditions (pH, agitation, etc.) are constant. Three characteristic regions of adsorption related to oleate concentration can be distinguished (Fig. 12). In diluted solutions, below 10−5 M, a steady state is reached. The amount of surface calcium oleate surface species does not exceed 0.3 of a statistical monolayer (see also Fig. 11). At concentrations between 10−5 and 10−4 M, the most dynamic interactions between fluorite–oleate aqueous solutions were observed. The adsorbed amount shows a maximum. The level of the maximum (up to 20 statistical monolayers) and the adsorption kinetics are strongly related to initial oleate concentration. There are clear evidences that the thicker coverage is produced by a nucleation and growth mechanism. Dissolution of the produced surface calcium oleate with an increase of adsorption time is caused by the Ostwald ripening, which transfers the calcium oleate from fluorite surface to solution where fine particles of calcium oleate are produced. Above oleate concentration of 10−4 M, the total adsorbed amount of oleate does not exceed monolayer coverage after a long adsorption time. A steady state is reached; micelles are formed in solution, at concentration lower than cmc of sodium oleate, due to the adsorption of calcium ions on the micelles, lowering significantly calcium and oleate concentrations in solution. This prevents the formation of thick three-dimensional patches on fluorite surface. Adsorption kinetics is also very sensitive to other changes, as solution hydrodynamics (agitation), or addition of external calcium (ions or/and solid calcium oleate) to oleate solution [20].
The interactions of fluorite with oleate solution were already investigated by numerous authors, but only the application of the new developed infrared reflection techniques allows to monitor, describe and understand in all details the complex surface phenomena taking place in the system.
3.5 Adsorbed monolayers in a region of strong absorption of substrate
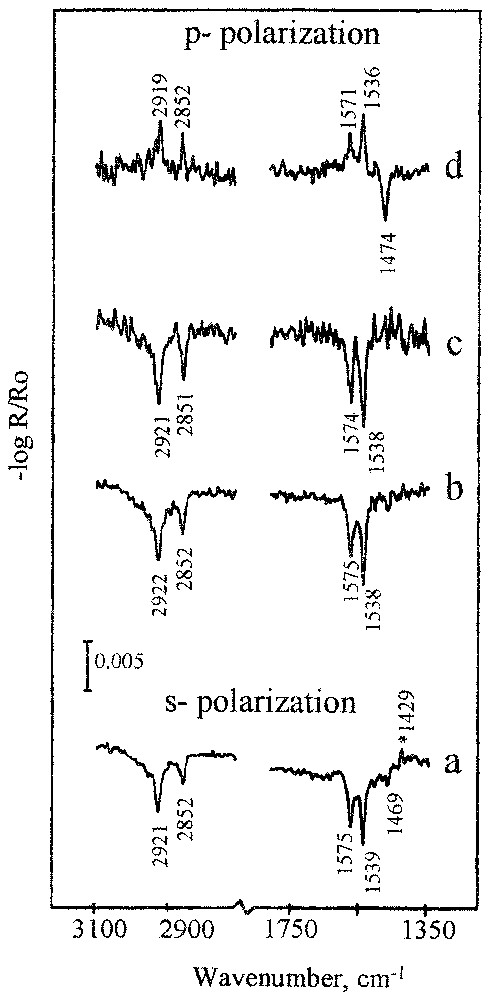
There are numerous systems in which minerals show strong absorption in the region of the characteristic vibration of the produced surface species. The very strong absorbance of substrate obscures low intensity absorbance bands from surface species, making the systems extremely difficult for spectroscopic study at monolayer coverage. This situation occurs for many natural minerals such as oxides, silicates, carbonates, phosphates, etc. Others are biochemical important systems with major biominerals of hard tissue, such as phosphates and carbonates. They show very strong absorbance in a relatively wide spectral region, in which vibration of carboxylate, CO, amide, or other most characteristic molecular groups of soft tissue take place. The system chosen as an example is calcite, with a very strong absorption between 1600–1400 cm−1 due to carbonate vibrations (14), and oleate, which forms a calcium oleate surface complex with characteristic carboxylate absorbance bands at about 1500 cm−1. It is shown that, in the spectral region of very strong substrate absorption, the experimental spectra of the adsorbed oleate species can be recorded successfully (Fig. 13). Moreover, the experimental spectra can be reproduced by spectral simulations (for details see [14]) giving detailed information about the surface composition and structure of the produced layers. Comparison of the experimental and simulated data shows very good agreement, except for the differences observed in the region of the strong absorbance band of calcite at about 1630 cm−1. This ‘substrate’ band is very sensitive (it can vary from negative to positive) to any changes in the optical conditions, such as the changes in the angle of incidence and the thickness of the adsorption layer. The adsorbed oleate forms surface calcium carboxylate species with two preferential conformations: unidentate (a band at 1537 cm−1) and bidentate (a band at 1575 cm−1). In the case of a multilayer coverage, the adsorbed layer forms a patch-like structure produced by a pillar growth mechanism (see next section).
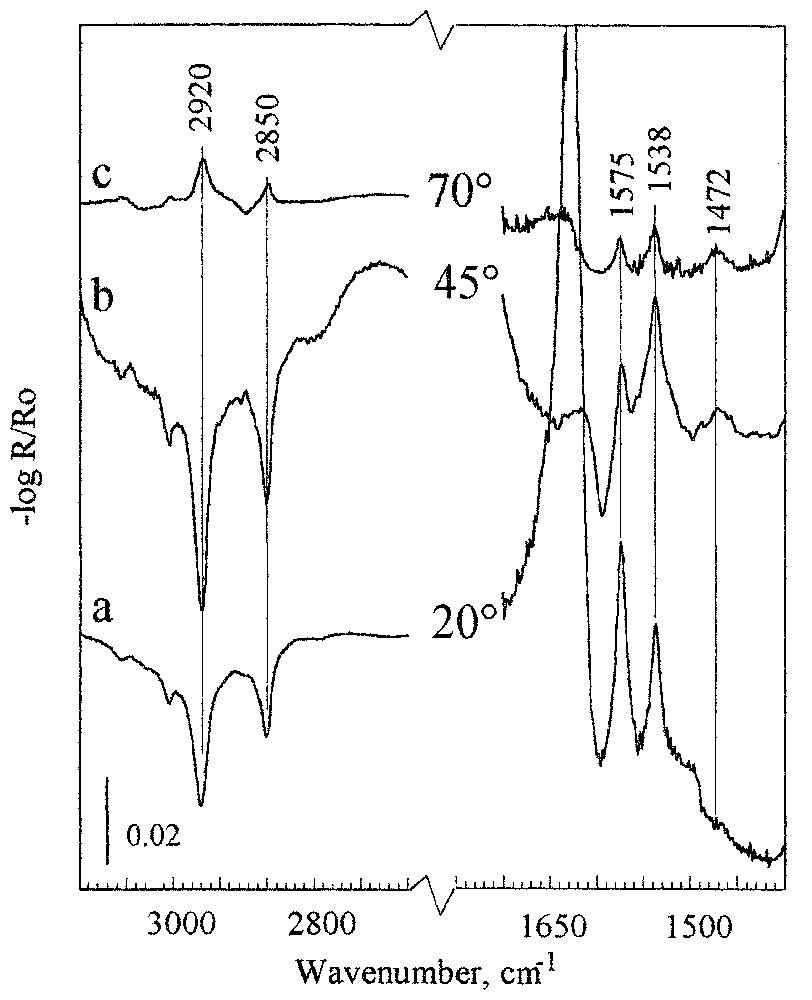
Reflection spectra of calcite after adsorption for 5 min in an oleate solution at concentration of 3.3×10⁻⁵ M, pH 10, recorded for p-polarisation at incident angles of 20°, 45°, and 70°.
Spectres en réflexion de la calcite après adsorption d'oléate pendant 5 min à partir d'une solution de concentration 3,3×10⁻⁵ M, pH 10, mesurés en p-polarisation, avec des angles d'incidence de 20°, 45° et 70°.
3.6 Lateral surface distribution of the adsorbed species
The adsorbed species can be uniformly distributed on substrate or they can form patches especially at higher coverage rates. If the produced patches are well established (more than 20 nm in height) the average height of patches and the fraction of the surface covered by them can be estimated by the means of the reflection methods. It was found that the intensity and the shape of the absorbance bands are not in a simple relation with the thickness of the probed adsorption layer [14].
Fig. 14 shows an example of spectra of a calcium oleate adsorption layer on calcite at different thicknesses of the adsorbed layer. For the thinner adsorption layer (up to about 20 nm), there is a simple relationship between the amount adsorbed and the observed intensity of the absorbance bands. Then they show very dramatic changes. Moreover, the recorded spectra could show negative and positive bands. The strong absorbance band induced by substrate (band around 1630 cm−1) is very sensitive to the thickness of the adsorbed layer. All the observed changes are related to the influence of the adsorbed layer thickness on the observed optical effect. The observations were applied [14] to estimate the surface distribution of the adsorbed species by comparison of the experimental spectra with the simulated ones for two surface domains, monolayer coverage and patches with a specific height. Verification of the calculated height of the patches performed by Atomic Force Microscope (AFM) shows a good precision of the spectroscopic experimental estimation. This is another very unique property of this reflection technique compared to other infrared techniques.

Simulated reflection spectra of an isotropic hypothetical layer of calcium oleate on calcite for p-polarisation at an incident angle of 70°, for different surface layer thicknesses.
Spectres en réflexion simulés de l'hypothétique couche isotrope de l'oléate de calcium, mesurés en polarisation p selon l'angle d'incidence de 70° pour différentes épaisseurs des couches adsorbées.
3.7 Application of the developed experimental technique
The experimental spectroscopic information obtained directly from mineral surfaces on the molecular level allows understanding in details the surface phenomena. There are two major areas in which the developed techniques have been exploited intensively: description of natural geochemical phenomena, and industrial applications.
Monitoring surface phenomena in natural system includes determination of key parameters that govern dissolution/precipitation of minerals and adsorption/desorption of metal ions and organic matter in typical natural conditions. Surface speciation, understanding of role of organic matter adsorption on minerals in transportation of metals (pollutant) in ground water, dynamics of semi-soluble minerals–aqueous solution interactions, role of diatoms nature and structure on regulation of metal uptakes in seas and lakes are the major subjects under investigation. Some of the results were already published [13,14,19,20].
For industrial applications, the spectroscopic investigations carried out on the laboratory scale provide detailed information for understanding the mechanisms and dynamics of surface reactions, which allows controlling industrial processes and predicting macroscopic properties necessary to design efficient technologies. Selective hydrophobisation and selective separation of raw minerals, and development of more environmentally acceptable technologies were the major subjects of our studies. Problems of selective separation of sulphide minerals include also electrochemically-controlled surface phenomena that were monitored spectroscopically in situ [11,12,15,16,18]. These extensive studies provide technological solution for a better separation of copper minerals from galena and sphalerite. The most spectacular achievement is the development of a technology of clean copper concentrate production [21] with a very limited amount of minor deleterious elements such as mercury, arsenic, and antimony (below 1000 ppm). This work on a full industrial scale technology is a good example of a successful application of the information obtained from molecular and atomic levels to mass production of copper concentrate (in hundred thousands tons annually, which requires dealing with hundred millions tons of mineral ore).
4 Conclusions
The developed infrared external reflection technique has a very unique ability to study interface phenomena at a molecular level for heterogeneous and multi-component substrates, such as natural minerals or biominerals. The variety, precision and reliability of the information about interface phenomena delivered by this technique are not comparable to what can be obtained with other ordinary techniques. The experiments are fast and non-destructive. High sensitivity (starting from 20% of monolayer) and in situ collecting of information in a multiphase system, even in the region of strong absorption of substrate, make this technique a very valuable experimental tool. The only disadvantage is that the interpretation of the recorded spectra is not straightforward. They cannot be directly compared with known infrared standards recorded by transmission or by other common infrared techniques. The interpretation requires a spectral simulation, which is the necessary procedure for distinguishing the observed spectral changes caused by optical effects from those provoked by surface-induced alternations on the adsorbed molecules. As was demonstrated in this overview, the complexity of the recorded reflection spectra, their sensitivity to any variation of the optical properties of all investigated phases in the system as well as their spatial distribution are, in fact, the major strength of the technique. Its ability to perform good research in very complex systems is probably the most unique capability of the technique.
The obtained results of this fundamental and applied work show clearly that it is difficult to find another surface characterisation technique that would be able to provide so much detailed information about surface phenomena, in order to help us to predict, control and modify surface properties in a complex system by controlling a few key parameters of the solution. After years of intensive experimentation, we still see other fascinating applications of the technique that could be developed with proper elaboration. Numerous complex natural and technologically interesting processes could be investigated. We believe that the most difficult and complex natural geochemical and geo-biochemical systems could be successfully investigated.
Acknowledgements
The authors are grateful to J.-M. Cases for his critical reading of the manuscript. The presented work was supported by the European Union (BRITE-URAM projects: MA2M-CT9260062, BRE2-CT94-0606, BRPR-CT95-0012, BRPR-CT98-0619) and CEFIPRA (Project 1315-1).