

Version abrégée
La compréhension des phénomènes d'adsorption à l'interface solide–liquide nécessite à la fois de caractériser l'adsorbant et de déterminer le mécanisme de formation de la phase adsorbée. La caractérisation de l'adsorbant inclut la texture (aire spécifique, morphologie, répartition des pores) et la nature chimique des sites superficiels. Pour déterminer le mécanisme de formation de la phase adsorbée, il est nécessaire de disposer de méthodes capables de suivre le phénomène d'adsorption sur le plan cinétique, thermodynamique ou structural. Parmi ces méthodes, deux seront plus particulièrement décrites : la microcalorimétrie et l'ellipsométrie.
La microcalorimétrie est une technique presque universelle, car la plupart des phénomènes physiques sont accompagnés d'un échange caractéristique de chaleur entre le système et le milieu ambiant. De mise en œuvre délicate dans l'étude des phénomènes superficiels, car une faible quantité de matière est en général concernée par la transformation étudiée, elle permet de travailler dans des conditions (de turbidité, d'agitation, de taille d'échantillon) non accessibles à la plupart des autres méthodes. Des méthodes calorimétriques ont donc été développées, à la fois pour la caractérisation des solides divisés par adsorption et pour l'étude directe de l'adsorption. Sur les Figs. 1–3 sont présentés les principaux types de montage utilisés pour déterminer les enthalpies d'adsorption à partir d'une phase liquide. Le phénomène d'adsorption s'accompagne en général d'un phénomène de dilution dont il faut tenir compte dans l'exploitation thermodynamique des résultats, en choisissant notamment l'état de référence approprié (Fig. 4). La connaissance des enthalpies d'adsorption en fonction de la quantité adsorbée permet de mettre en évidence les étapes de construction de la phase adsorbée et d'apporter des informations sur son état par comparaison avec des phases de référence (par exemple, dans le cas des tensioactifs, les micelles en solution). Les Figs. 5 et 6 illustrent ce type d'application dans le cas d'adsorption de tensioactifs non ioniques.

Experimental set-up for immersion calorimetry.
Montage utilisé pour la détermination des énergies d'immersion.
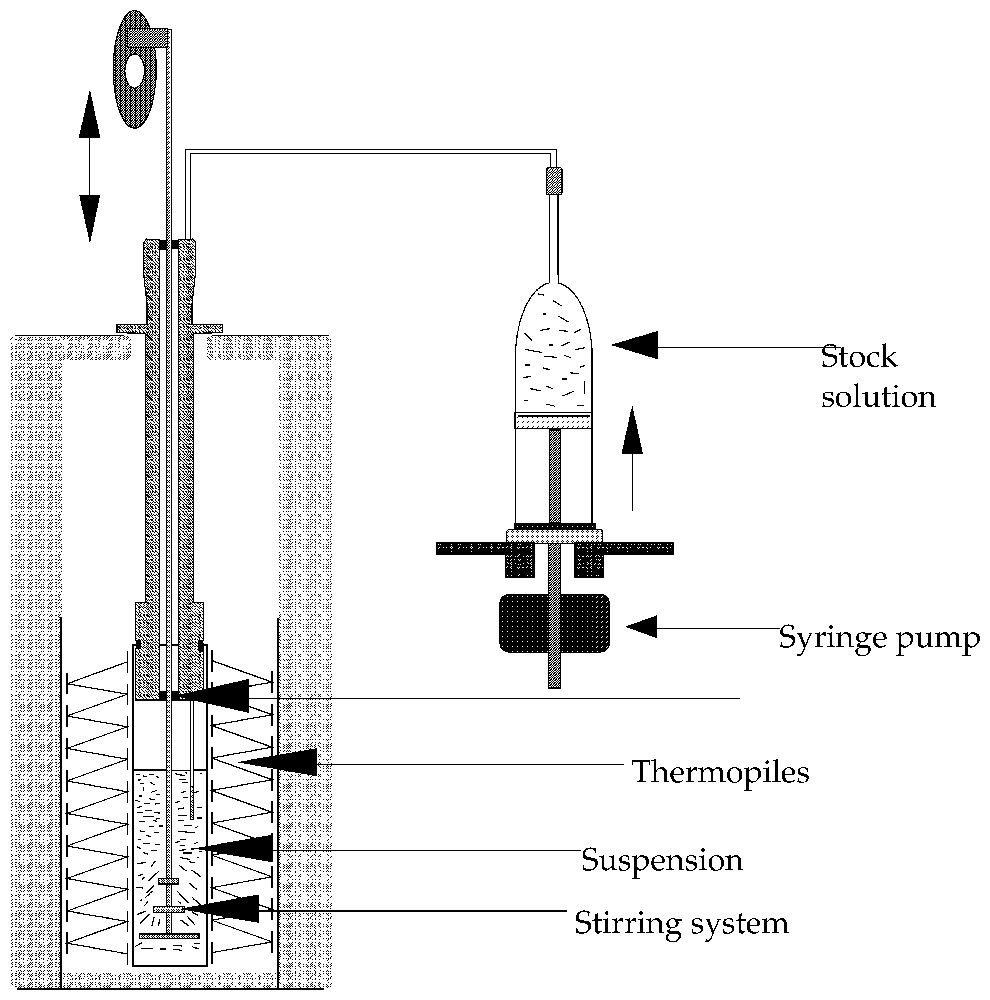
Schematic representation of an experimental set-up used to carry out titration experiments. Several types of stirring systems can be used, including magnet driven propellers.
Type de montage utilisé pour réaliser des expériences de calorimétrie d'adsorption par une méthode de titrage. Différents types d'agitateur peuvent être utilisés, notamment des systèmes à transmission magnétique.
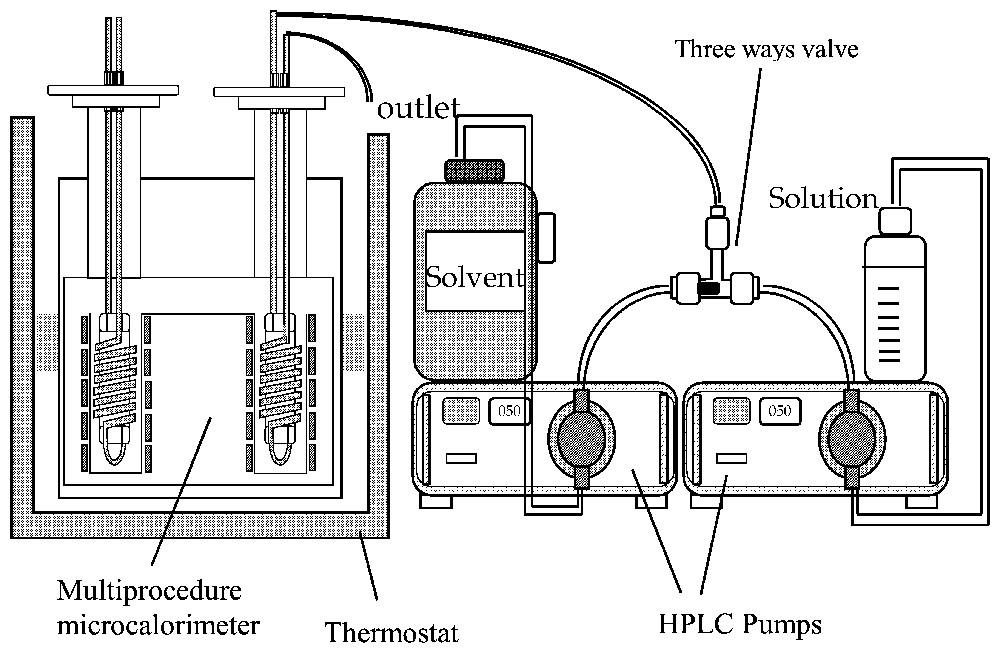
Typical liquid-flow calorimetry experiment. Two HPLC pumps are used to prepare variable concentrations by changing their flow rate ratio at total constant flow rate.
Type de montage utilisé pour les expériences de calorimétrie à flux de liquide. Deux pompes HPLC permettent de préparer des solutions de concentrations variables.
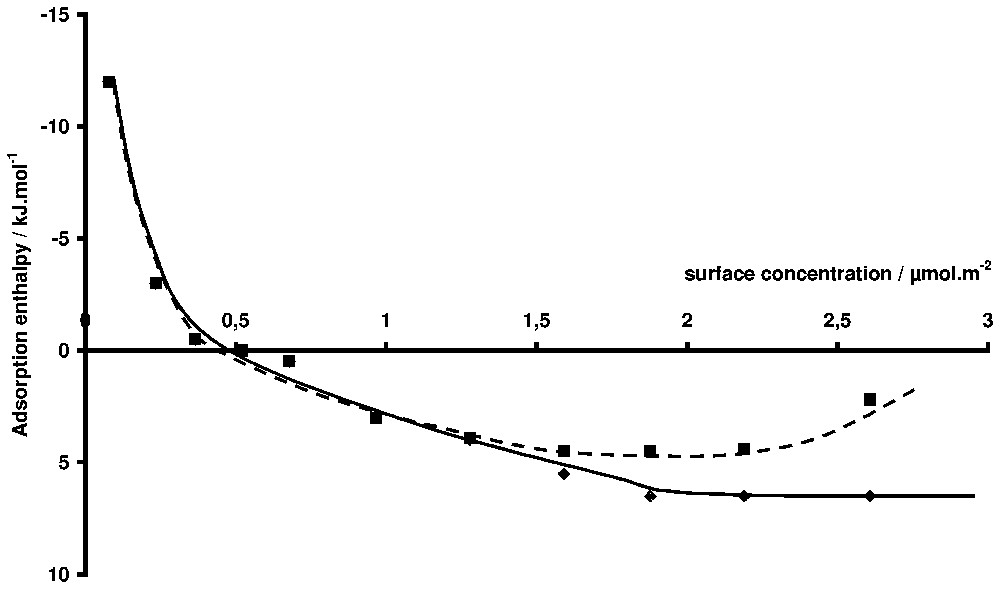
Pseudo-differential adsorption enthalpies of a non-ionic surfactant on silica (TX100, [14]). Squares: the reference state is the solution at equilibrium. Diamonds: the reference state is the infinite dilution.
Enthalpies pseudo-différentielles d'adsorption d'un tensioactif non ionique sur une silice [15]. Carrés : l'état de référence est la solution à l'équilibre. Losange : l'état de référence est la solution infiniment diluée.

Adsorption isotherm of TX100 on silica [18] (right-hand axis). Dilution enthalpy of a micellar solution of TX100 (left-hand axis). The critical micelle concentration is .
Isothermes d'adsorption du TX100 sur une silice [15] (axe de droite). Enthalpie de dilution d'une solution micellaire de TX100 (axe de gauche). La concentration micellaire critique est .
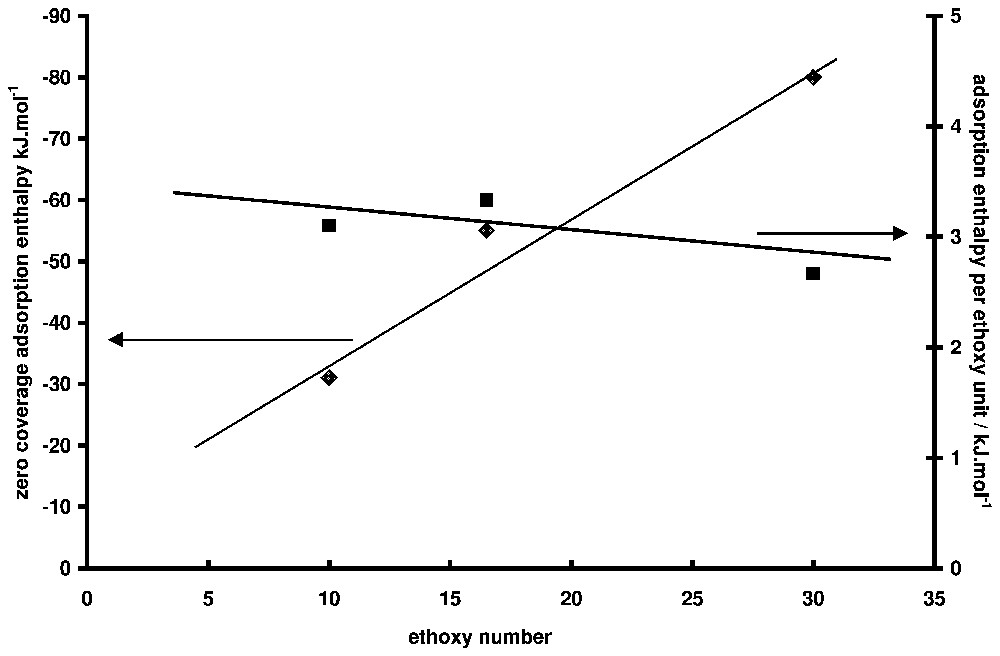
Adsorption enthalpy at zero coverage as a function of ethoxy number for non-ionic surfactants (data from [18]). On the right-hand axis, the values are divided by the ethoxy number.
Enthalpies d'adsorption à taux de recouvrement nul en fonction du nombre de maillons éthoxy du tensioactif non ionique (à partir des données de la référence [15]). Sur l'axe de droite, les valeurs ont été divisées par le nombre de maillon éthoxy par chaı̂ne.
L'ellipsométrie est une méthode optique qui nécessite l'utilisation de surfaces réfléchissantes très bien définies. Elle donne accès à l'épaisseur et à l'indice de réfraction de couches déposées sur un substrat. En général, elle est utilisée à l'interface gaz–solide. On la rencontre à l'interface solide–liquide en électrochimie, pour le suivi des réactions d'oxydo-réduction aux électrodes. Moins fréquemment, car les gradients d'indice de réfraction entre le solvant et la phase adsorbée sont souvent faibles, elle est utilisée pour suivre l'adsorption à partir d'une solution. Elle permet alors de déterminer des isothermes d'adsorption, de suivre la cinétique d'adsorption (ce qui est difficile dans le cas de l'adsorption sur des poudres) et d'obtenir des informations structurales grâce à la mesure de l'épaisseur de la phase adsorbée. Nous présentons sur la Fig. 7 le schéma de principe d'un ellipsomètre de zéro. Les exemples choisis montrent (i) l'intérêt de cette technique pour suivre l'influence d'un paramètre sur la concentration superficielle ou l'épaisseur de couche adsorbée (par exemple le pH, Fig. 8), (ii) la pertinence des informations obtenues par rapport à ce qui est obtenu plus classiquement sur des poudres (Fig. 9) ou enfin (iii) la possibilité de travailler dans des domaines complexes du diagramme de phase de la solution à l'équilibre (Fig. 10).

Schematic representation of a null ellipsometric set-up for adsorption from solution studies. The cell is equipped with magnetic stirrer, pH-meter and temperature controller.
Représentation schématique d'un ellipsomètre de zéro adapté à l'étude de l'adsorption à partir d'une phase liquide. La cellule trapézoı̈dale est régulée en température et équipée d'un système d'agitation ; le pH peut être mesuré.

Adsorption of tetradecyltrimethylammonium bromide on titania [54] at 25 °C. Diamonds, surface concentration at the plateau (left-hand axis) and squares, adsorbed layer thickness.
Adsorption du bromure de tétradécylammonium sur dioxyde de titane [49] à 25 °C. Les losanges correspondent à la concentration superficielle au plateau de l'isotherme d'adsorption et les carrés à l'épaisseur de la couche adsorbée.
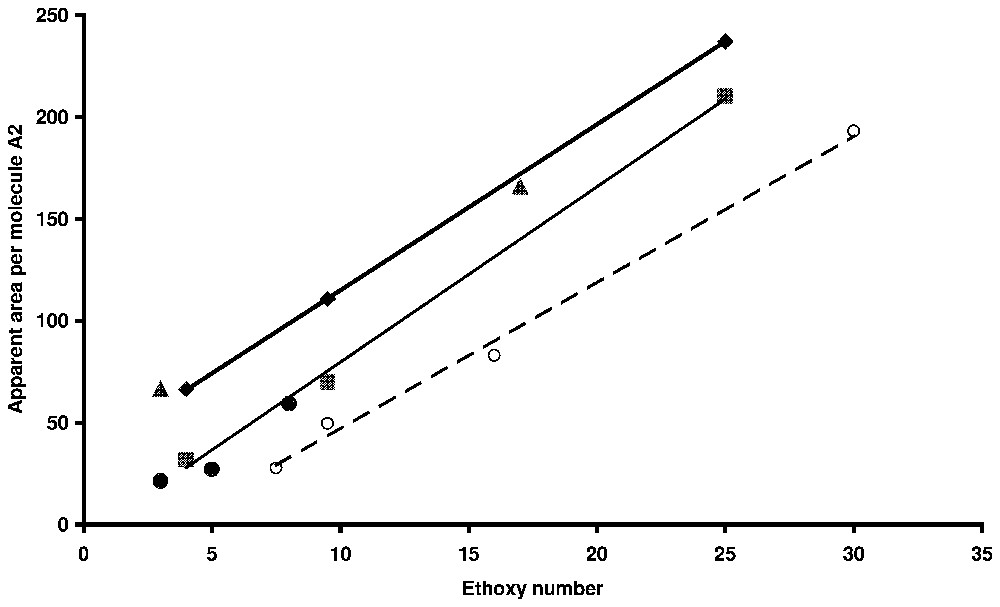
Average area per molecule as a function of ethoxy chain length for non-ionic surfactants and ethoxy-anionic surfactant. Circles: alkylphenolpolyethoxyethylene on silica by ellipsometry [54]; dots: alkylphenolpolyethoxsulphonate on alumina (powder) [66]; triangles: alkylpolyethoxysulphate on alumina (powder) [67]; squares: nonylphenolpolyethoxysulphate on alumina (powder) [60]; diamonds: nonylphenolpolyethoxysulphate on titania (ellipsometry) [54].
Aire apparente par molécule en fonction de la longueur de la chaı̂ne oxyéthylénique pour des tensioactifs non ioniques et des tensioactifs du type éthoxy-anionique. Cercles : alkylphénolpolyéthoxyde d'éthylène sur silice par ellipsométrie [48] ; disques : alkylphénolpolyéthoxy sulfonate de sodium sur alumine en poudre [71] ; triangles : alkylpolyéthoxysulfate de sodium sur alumine en poudre [21] ; carrés : nonylphénolpolyéthoxysulfate de sodium sur dioxyde de titane (ellipsométie) [49].
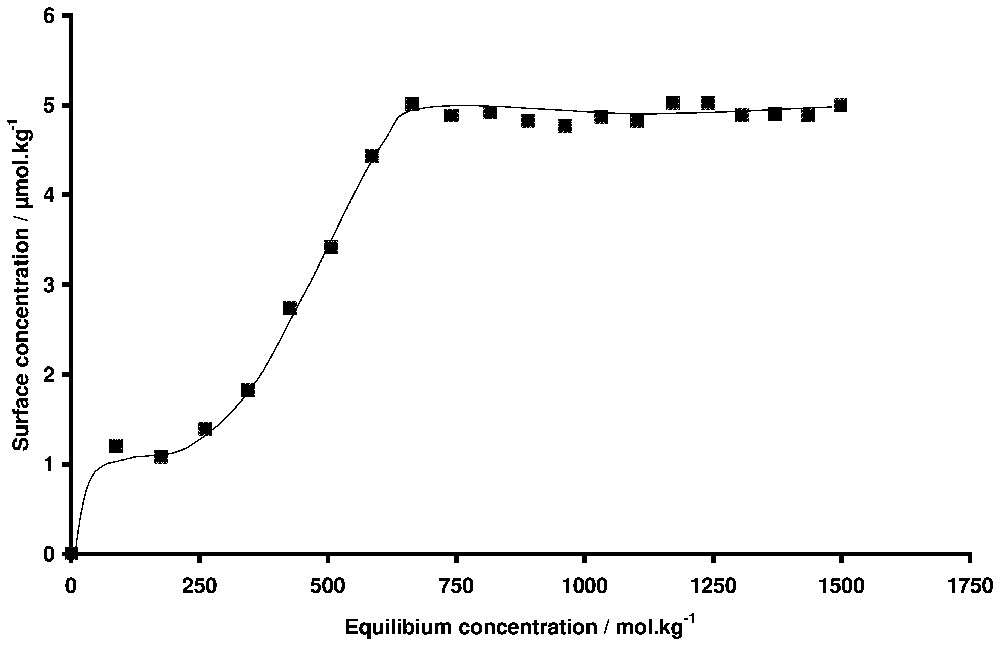
Adsorption isotherm of hexadecyltrimethylammonium bromide onto silica. T=19 °C. The Kraft temperature is 26 °C.
Isotherme d'adsorption du bromure d'hexadécyltriméthylammonium sur silice déterminée par ellipsométrie. T=19 °C. La température de Kraft est 26 °C.
1 Introduction
Adsorption at the solid–liquid interface is a complex phenomenon that requires, for a full understanding, experimental methods able to characterise the solid surface in terms of surface area, porosity, nature and energy of adsorbing sites as well as in-situ methods able to follow the adsorption process. In order to assess the adsorption mechanism, there is a need for methods able to follow the adsorption at the kinetic, thermodynamic or structural level. A part of the complexity comes from its competitive character: in the simplest situation, there is at least the solvent and one solute but most of practical situations involve more compounds. For example, the adsorption of a solute at the solid/aqueous solution interface is a competition between the solute, the water molecules, H+, OH− and, in many cases, other ions either yielded by the dissolution of the solid or used to buffer the ionic strength. Another characteristic of the solid–liquid interface, when studied with powders, is its heterogeneous nature, which makes many experimental methods difficult to carry out because of the conditions of stirring, turbidity or sample size. This is the reason why a number of methods were developed around microcalorimetry, which is a ‘universal’ technique because most physical phenomena are accompanied by a heat effect. Carrying out adsorption experiments by microcalorimetry is particularly difficult because the amount of material exchanged during the process is very small. Nevertheless, by carefully choosing the experimental conditions, it is possible to isolate the adsorption process and to measure the variation of a state function (for example, enthalpy) that is a characteristic of the studied phenomenon. In the first part of this paper, the usual experimental procedures to determine the adsorption enthalpies at the solid–liquid interface are presented and are illustrated by examples in the field of surfactant adsorption. Notably it will be shown how information on both adsorbed phase nature and molecule conformation can be deduced from the measured data. In the second part of this paper, another in situ technique will be described, ellipsometry. At the opposite of calorimetry, which is well suited for highly divided systems like powders, ellipsometry is an optical technique that needs the use of a well-defined flat surface. It gives access to the refractive index and the thickness of layers deposited on a surface. Generally performed at the gas/solid interface, its use at the solid/liquid interface is mainly encountered in electrochemistry to follow reactions at the electrodes. Less frequently it is used to follow adsorption at the solid/liquid interface, but this is probably the most difficult case because of the small gradients of refractive index between the liquid and the adsorbed phase. Nevertheless, it allows (i) the determination of adsorption isotherms, (ii) to follow the kinetic of adsorption and (iii) to get structural information on the adsorption phase when conditions are good enough to determine the adsorbed layer thickness. Like for calorimetry, the experimental approach will be described and illustrated by examples in the field of surfactant adsorption.
2 Microcalorimetry
The result of any adsorption calorimetry experiment will be informative only if the measured quantities can be reported to the adsorbed amount. It means that prior to any calorimetric experiment, it is necessary to determine the corresponding adsorption isotherm. In the field of adsorption from solution, the literature is very rich in discussions on the measurement of adsorbed amount and the presentation of corresponding data [11,22,38,61,62]. In the case of surfactant adsorption, the solution is generally very dilute with the consequence that the reduced surface excess, the surface excess assuming that the volume of liquid is unchanged by adsorption and the real amount of solute at the interface can be considered as equal. The adsorption isotherms are then easily determined by the solution depletion method or by front chromatography [61]. Adsorption can be considered as the displacement of one molecule by the other in the vicinity of the solid surface. This notion of displacement must be kept in mind even if the word ‘adsorption energy’ is more frequently used. The simplest way to formalise the displacement is to write adsorption from solution like a chemical reaction involving the displacement of r molecule(s) of component A by one molecule of component B:
3 Experimentals
Adsorption calorimetry can be carried out in two different ways:
- • immersion calorimetry of the dry solid in a solution;
- • direct determination of adsorption enthalpies (or more precisely displacement as indicated earlier) by titration microcalorimetry or liquid flow microcalorimetry.
Generally, isothermal calorimeters are used but studies with isoperibolic calorimeters can also be encountered in the literature. The more accurate method to carry out immersion experiments is to prepare ampoules with a brittle end, as illustrated in Fig. 1 [24,59]. The sample is put inside an ampoule that is sealed after a heat treatment under vacuum. Two experiments are needed to get the adsorption enthalpy: one with the pure solvent, another one with the solution. It only gives one equilibrium point, which makes the determination of the adsorption enthalpies at several surface concentrations a time-consuming work. Moreover, if the composition is strongly modified by adsorption, the final state cannot be safely defined without stirring the powder and the liquid. Added to the ampoule breaking and vaporisation terms, this constraint leads to a significant loss of accuracy. Nevertheless, it has been shown that the method based on immersion calorimetry gives reasonable results in the case of mixtures where the liquid composition is not too much modified by adsorption [36].
The second way (liquid flow or titration calorimetry) is the recommended one, because it can be easily computerised and gives in reasonable time the adsorption enthalpies at all coverage rates. The two methods, both liquid flow and titration calorimetry, have been developed at a high level of sensitivity in order to fulfil the requirements of surfactant adsorption in the field of enhanced oil recovery where systems with both weak interactions and low surface areas were used [12,60]. It has been often necessary to analyse weak signals at the level of the microvolt, corresponding to a few microwatts full-scale [9,12].
In titration calorimetry, a suspension of the adsorbent is stirred inside the calorimetric cell (Fig. 2). A stock solution is added continuously or step by step inside the cell. Syringe pumps or any volumetric accurate pump can be used. At each step, a calorimetric peak is recorded and transformed into heat by using a calibration constant (usually, the Joule effect is used for calibration). The heat measured can be transformed into the adsorption enthalpy after correction for the dilution enthalpy of the stock solution. In liquid flow calorimetry, the adsorbent is placed inside a small column, which is set within the calorimetric cell (Fig. 3). After the column, the liquid flows into a tube coiled around the column inside the thermopiles in order to make the heat exchange as efficient as possible. Other systems with single point temperature detection have been also proposed [30]. In a typical experiment, the solvent is flowed through the sample until the thermal equilibrium is reached. HPLC pumps can be used (Fig. 3). Then solutions of increasing concentrations are successively flown through the system. Desorption steps can also be performed. A calorimetric peak is recorded for each concentration variation. The advantages of liquid flow calorimetry are the same as that of the frontal chromatography method for determining adsorption isotherms, i.e., the chemical potentials are fixed by the liquid flowing through the system. If the two methods are coupled, for example by connecting the outlet of the calorimetric cell to a concentration detector (UV-spectrometer, refractometer), both the adsorption isotherm and enthalpy are determined on the same sample. Usually, this type of calorimeter ought to be immersed in a thermoregulated bath in order to provide not only a high-temperature stability (around 10−4 K) but also a high heat content allowing the continuous introduction of a liquid without modifying the bath temperature. The heat measured during the liquid flow experiment includes contributions from dilution and adsorption. An exact calculation of the dilution contribution is rather difficult and would need a complete integration along the composition curve recorded during a concentration step [14,47]. Fortunately, by using sufficiently close concentration steps, the dilution contribution is most often negligible. A comparison between liquid flow and titration method can be found in the literature [13]. The main limitation of the liquid flow method is the particle size that has to be wide enough to limit the pressure drop in the system. The titration method will be well adapted in 90% of the cases, excepted if the desorption study is needed.
The more useful representation is the adsorption enthalpy as a function of surface concentration. Either integral or differential adsorption enthalpies can be determined [14]. The integral enthalpy corresponds to the adsorption from zero coverage to a given coverage. The differential enthalpy corresponds to the transfer of one mole of adsorbate from the bulk to the surface at a given coverage rate. Strictly, the experimentally determined differential adsorption enthalpy should be called ‘pseudo-differential’, because the actual experiment consists in discrete steps of surface concentration. In each case, the reference state can be the equilibrium solution or the infinite diluted state. This latter is convenient when the properties of the solution are strongly changing with concentration, which is the case with surfactant molecules. For example, in Fig. 4, the adsorption enthalpies for the adsorption of a non-ionic surfactant on silica [15] are plotted versus surface concentration. The curve (1) is obtained by using the equilibrium solution as a reference state whereas the curve (2) is referred to infinite dilution. The observed difference is due to the fact that the dilution enthalpy of the stock solution varies steeply close to the critical micelle concentration, as shown in Fig. 5, where the corresponding adsorption isotherm is also presented.
4 Applications
Adsorption from solution calorimetry has been used in the past to study many systems: adsorption of liquid mixtures [39,40], polymers (from aqueous [7,69] or organic solutions [37]), and surfactants [15,41,55,60,73]. The case of surfactant adsorption will be mainly highlighted here. The literature is abundant about the mechanism of surfactant adsorption at the solid/liquid interface and several reviews can be found [5,6,42]. It is generally accepted that two, more or less separated, steps can describe the formation of the adsorption layer along the adsorption isotherm. In the case of minerals, adsorption at low equilibrium concentration is generally due to the interaction between the polar head of the amphiphile molecule and some specific sites of the surface (H-bonds, electrostatic forces, etc.). At higher concentrations, aggregates are formed at the interface as a result of lateral interactions between hydrophobic chains. This aggregation is due to the same forces as those responsible for bulk micelle formation. The concentration at which aggregates appear on the surface, their lateral extent and their thickness depend on (i) the normal interaction (between the polar head and the surface), (ii) the lateral interaction (between hydrophobic chains), and (iii) the spatial and energetic distribution of adsorbing sites. The porosity of the sample may also have an influence. The adsorption enthalpy is sensitive to all these parameters and its knowledge as a function of coverage can (i) help in separating the steps of the adsorption mechanism and (ii) bring information on the conformation of the adsorbed molecules. For example, one of the main advances brought by calorimetry in the field of surfactant adsorption was to show the similarity between superficial aggregation and micellisation [12], before it was clearly shown by techniques like fluorescence decay [44] or atomic force microscopy [53]. The similarity is such that, in the case of non-ionic surfactants, the aggregation enthalpy at the interface and the micellisation enthalpy are nearly equal [15]. In the case of ionic surfactants, the situation is more complex, probably due to the difference of counter-ion binding of surface aggregates and bulk micelles. In Fig. 4, the adsorption enthalpy of a non-ionic surfactant of the alkylphenol polyethoxy type (TX100, which has 10 ethoxy units on the average) on a silica sample is presented [14]. The corresponding adsorption isotherms is S-shaped (Fig. 5). The initial slope increases with the ethoxy chain length [15,46]. This curve is typical of what is generally observed with surfactant. A first domain, where the enthalpy varies a lot with surface concentration, is followed by a second one, where the enthalpy is more or less constant. The same behaviour is encountered with ionic surfactants, but the sign and the values of the enthalpies vary from a system to the other. The case of cationic surfactants is particularly complicated with, sometimes [70,72], a double change of sign between the first and the second domain. The first domain is characteristic of the interaction of the surfactant molecule with the surface, whereas the second one is generally the signature of the adsorption process. Notably, the variations of adsorption enthalpy in this second domain with temperature or ionic strength parallel that of micellisation enthalpy [55]. Concerning the first domain for non-ionic surfactant, the question is to know whether the observed decrease is due to surface heterogeneity or to conformation change of the molecule. In a paper about the adsorption of polyethylene oxide on silica, it was shown that the energy of adsorption per ethoxy unit was and was independent of the coverage rate [69]. The high values obtained at low coverage may then indicate that several ethoxy units are in contact with the surface. Moreover, if the enthalpy interpolated at zero coverage is divided by the average number of ethoxy units (Fig. 6), the same value () is obtained, which is in favour of a flat conformation of the ethoxy chain at zero coverage, as observed for polymer adsorption [69]. The steep decrease of adsorption enthalpies is then mainly due to a change of the conformation of the adsorbed molecules that stand up as the coverage increases, to finally build the surface aggregates for which the aggregation enthalpy is endothermal and nearly equal to the micellisation enthalpy. The same behaviour is observed for alkylpolyethoxy anionic surfactants (sulphate or sulphonate type), provided the ethoxy chain is long enough. The endothermal character is generally attributed to the partial dehydration of the ethoxy chain when aggregates are forming.
The role of the porosity on the adsorption mechanism of surfactants can also be evidenced by microcalorimetry. Porosity may have an influence on the adsorption of the monomers or on the formation of aggregates. The effect of porosity depends on the relative value of the molecule size and the pore width. For example, there is a strong effect of the micropores (they range between 0 and 2 nm, following the IUPAC definition [61]) on the adsorption of monomers when their width is close to the size of the molecule. For example, activated charcoals adsorb non-ionic surfactants with a high affinity, which is mainly due the enthalpy part of the interaction that may be found to be twice that on a non-porous surface [23,27,66]. If the pore size is not large enough, the aggregates cannot be formed on the surface. Indeed, if these aggregates are micelle-like, pores larger than 4 nm are needed to accommodate them. In a systematic study of surfactant adsorption on a set of porous silica, Giordano et al. [26] showed how the pore size distribution influences the surface concentration of monomers and aggregates. It was also shown that the notion of adsorption potential enhancement could be applied to the aggregates when they are in pores of similar size.
Another interest of measuring adsorption enthalpies is to test models. For example, the micellisation properties of surfactant mixtures (critical micelle concentration versus surfactant composition) were often modelled through the regular solution theory [31]. To validate this model, it can be useful to carry out directly the measurement of the mixing enthalpy of the pure micelles (for example, by mixing concentrated surfactant solutions [33]). The same approach can be followed at the interface. The aggregation enthalpies of surfactant mixtures (non-ionic/anionic or non-ionic/cationic) at the interface (silica) and in solution were determined as a function of the surfactant composition [16,25]. It was shown that non-symmetrical curves were obtained for the calculated mixing enthalpy as a function of aggregate composition, indicating that the regular solution theory is too simple to describe such systems.
5 Ellipsometry
Ellipsometry is an optical technique where the changes of the polarisation state of the light before and after reflection are measured and related to the state of the reflecting surface [2]. This is a routine method in the electronic industry or for research studies at the vacuum or air–solid interface. As underlined in the introduction, applications at the solid liquid interface are less usual, mainly because the gradient of refractive index between the substrate, the solvent and the deposited layers is small. It is used in electrochemistry for following the film growth produced by the chemical reactions of electrodes [28,58]. Most of the applications at the solid–liquid interface concern the adsorption of large molecules like proteins, polymers or surfactants [3,19,20,63]. The adsorption of mixtures of small molecules was also investigated, but with a wetting behaviour point of view. In the field of surfactant, protein or polymer adsorption, most of the published studies where carried out by null ellipsometry, but a few studies can be found that use either spectroscopic ellipsometry or multiple angle procedures [4]. Modulation ellipsometry can be used to get very short time constant [3,19].
In null ellipsometry, one looks for conditions where an elliptically polarised light is made linearly polarised after reflection. The transformation of one polarisation into the other, independently of what happens physically at the interface, is obtained by introducing a change in both amplitude and phase of the two components of light on two perpendicular axes that are conventionally chosen parallel to the incidence plane and perpendicular to this plane. This change is expressed in the definition of ellipsicity, which can be related to both the ratio of overall reflection coefficients Rp (in plane) and Rs (out of plane) and the measurable angles Δ and Ψ [2]:
In Fig. 7, a schematic representation of a null ellipsometer is proposed as it is used in many laboratories [20,43,48,52]. This ellipsometer is set at a fixed angle with the arrangement polariser, compensator, sample, analyser and photomultiplier. Step motors are placed on the different optical elements in order to automatically search (the experiment is computerised) the analyser, polariser and compensator angle values that make the light intensity equal to zero at the detector level. The reflecting surface is generally introduced in a trapezoidal cell, but circular cells are also used [3,19]. The temperature of the liquid has to be controlled. With a simple Peltier module between the cell and a heat exchanger (in which tap water is flowing), it is possible to regulate the cell temperature within 0.1 °C in the range 10–50 °C.
The quality of the reflecting surface is very important, especially at the level of the roughness. This is why many studies were carried out with silicon wafers (for which the roughness is at the angstrom level) on which either a silica layer is thermally grown or other oxides are deposited. This kind of surface also offers a better optical contrast than that of a pure oxide sample. These latter samples are well suited for reflectometry [17], where the reflection of a linearly polarised light is followed at an incident angle close to the Brewster angle. In a typical ellipsometric experiment, the properties of the reflecting surface are first analysed in the presence of the solvent. The properties of the sample are thus controlled (for example, the thickness and refractive index of the silica layer of the silicon wafer). It has been shown that a better accuracy for the sample characteristics can be achieved by using several pure liquids [43]. Also the so-called four-zone method is used to get a better accuracy on the measured values. In the case of surfactant adsorption from aqueous solution, after the determination of and Ψ in the solvent (water at the chosen pH and ionic strength), a surfactant stock solution is then injected step by step. At each step, the adsorption kinetic can be followed by recording the optical parameters as a function of time: either the reflected intensity or directly the and Ψ values if the polariser and the analyser are continuously monitored in order to have always zero intensity at the detector level. After equilibrium, the optical parameters are again determined. In order to save time, the measurements, after each step, are only done in one zone and a correction is apply to get the four-zone value. Assuming the adsorbed phase to be homogeneous and isotropic, its thickness and refractive index can be calculated. Fortran programmes were built to make the calculations in various situations. For example, to study the adsorption of surfactants on the silica layer (20 to 40 nm thick) of a silicon wafer, a two-layer model is needed. To study the adsorption on the titania layer that was deposited on a silicon wafer that has its native silica layer (around 2 nm), a three-layer model is needed. The surface concentration can calculated by the de Feijter equation [10], provided the refractive index increment is known:
One of the main difficulties of ellipsometry is the preparation of the sample and of the solution. Because the sample represents a very small surface area, it can be very easily polluted. Efficient and reproducible methods of sample cleaning have to be used. The preparation of solutions needs very pure solvent and solute compounds. In the case of surfactant, the adsorption isotherms show a maximum close to the CMC if hydrophobic impurities are present. Several recrystallisation of the surfactant may be needed. The reproducibility and accuracy of experiments are good, concerning the determination of surface concentration, whereas the determination of an accurate surface layer thickness is more delicate.
Ellipsometry has been systematically used in the field of surfactant adsorption since 15 years now. This is mainly due to the fact that surfactants are well suited to determinations of adsorbed layer thickness. In numerous cases, they indeed form at the interface self-assembly structures, at least at the plateau of adsorption isotherms, which are homogeneous in a direction perpendicular to the surface. This homogeneity can even appear in the direction parallel to the surface, when this latter is covered by micelle-like aggregates, which generally have a small size as compared to the light wavelength.
It is possible, by ellipsometry, to study adsorption from three points of view: kinetic, thermodynamic and structural. This is indeed a particularly well-suited technique to follow the adsorption process in real time. Many applications of surfactant adsorption are concerned with powders for which the kinetics of adsorption is very difficult to follow at the early stage of adsorption, because it is necessary to separate the liquid from the solid to determine the surface concentration by the solution depletion method. By ellipsometry, it is possible to follow the adsorption process from the first second, which allows to model the adsorption kinetic and to discriminate between various adsorption mechanisms [67].
Secondly, it is possible by ellipsometry to determine the adsorption isotherms for many systems (silica, titania, alumina) that are relevant for applications. The agreement between results obtained with powders by the solution depletion method and those obtained by ellipsometry on flat surfaces is often very good, despite the different surface chemistry between powdered samples and flat surfaces. For example the density of OH groups of silica is probably smaller on silicon wafers than on precipitated silica. Another advantage of the method is that it is possible to vary many parameters (pH, temperature) and to study successively the adsorption of several molecules without changing the sample (but with rinse of the surface). For example, the adsorption of three surfactants on a titania surface was followed as a function of pH [49]. An isoelectric point was evidenced from the evolution of surface concentration with pH of three surfactants. As the pH increases from 2 to 9, the anionic surfactant surface concentration decreases steeply around this isoelectric point (ca pH 6, in agreement with results for titania powders), that of the cationic surfactant one increases and the non-ionic surfactant one shows a maximum.
Thirdly, the determination of the adsorbed layer thickness is very informative on its structure. In many cases, ellipsometry has suggested that the surfactant adsorbed phase is made of surface micelles or of discrete aggregates [48,68]. This is deduced from the comparison of the measured surface concentration with that theoretically calculated for a compact bilayer. The former is generally much smaller than the latter, although the thickness of the adsorbed layer is close to that of two extended chains. For example, in Fig. 8, the results of an experiment showing how it is possible to follow the influence of pH on the adsorption of a surfactant molecule are shown. This experiment is carried out by introducing inside the cell, equipped with a pH electrode, a cationic surfactant solution at a concentration higher than the critical micelle concentration, in order to get the plateau surface concentration [49]. The pH is then modified by addition of acid or base. After each addition, the optical parameters are determined and both the layer thickness and the surface concentration are determined. They are plotted in Fig. 8 as a function of pH. The sample is a silicon wafer on which a titania layer was deposited by sputtering [49]. The surfactant is the tetradecyltrimethylammonium bromide. As the pH increases, the surface concentration of negatively charge sites increases allowing the adsorption of more cationic molecules. The thickness of the adsorbed layer, in the range of pH where it is safely measurable, is independent of pH. The value of 5.5±1 nm is rather indicative of a bilayer, but, as can be seen, the surface concentration is smaller than that of a bilayer at all pH values. This latter may be estimated to 8.8 μmol m−2, if a radius of 0.347 nm is used for the cationic head radius [35]. The adsorbed phase is then probably built of surface micelles as it is observed by AFM [53].
In the case of non-ionic or polyethoxy anionic surfactants, the similarity between surface aggregates and micelles can also be deduced from the evolution of the apparent area per molecule at the plateau of adsorption isotherms with the ethoxy number [48]. As can be seen in Fig. 9 where results for powders or flat surfaces are reported on the same graph, linear laws are obtained [48,50]. It shows a reverse relation between the surface aggregation number and the ethoxy number, as it is observed for bulk micelle [45].
Another interesting problem in adsorption studies to which ellipsometry is well suited is the behaviour of systems in conditions where phase changes are occurring in solution. For example, this technique was used to study the adsorption behaviour in the case of binary liquid mixtures, including non-ionic surfactant-water mixtures, that present a solubility limit with either a lower or a higher critical temperature [32,65]. Wetting transitions leading to the formation of thick films can be observed when the limit of solubility is reached. In the same way, by working with surfactant solutions close to their solubility limit (for example the Kraft temperature in the case of ionic surfactants), one can expect a change of the adsorption behaviour. The adsorbed phase is often a nucleation point for the formation of the second phase and the three-dimensional condensation of the surfactant at the interface could occur when the Kraft temperature is reached [5]. In the case of studies with powders, it is difficult to distinguish between bulk precipitation and three-dimensional condensation on the surface, because during the separation of the liquid and the solid, both the powder and the crystals yielded by precipitation are eliminated. By ellipsometry, the signal is sensitive only to the surface properties, provided bulk precipitation does not produce too many crystals that can absorb the light. This is illustrated in Fig. 10, where the adsorption isotherm of hexadecyltrimethylammonium bromide onto silica is plotted at 19 °C. The Kraft temperature of this surfactant is 26 °C. The amount adsorbed at saturation indicates the presence of small aggregates rather than a bilayer. It can be observed that the shape of the adsorption isotherm is the same below and above the Kraft temperature [1]. The equilibrium concentration above the CMC at 19 °C is only an apparent concentration, because the surfactant concentration cannot exceed the solubility limit, which is equal to the CMC at the Kraft temperature. The important result is that there is no three-dimensional condensation for this surfactant at the interface below the Kraft temperature. The same behaviour has been observed in the case of surfactant/mineral systems where the precipitation of the surfactant with the ions constitutive of the mineral is possible [56,57]. The three-dimensional condensation is only temporary observed, because the superficial phases are less crystallised than the phases that precipitate in the bulk solution.
6 Conclusion and applications
As shown in the preceding paragraphs, microcalorimetry and ellipsometry have been successfully applied in the past to characterise the adsorbing properties of minerals towards surfactants. Many of the studied systems where chosen in connection with enhanced oil recovery applications (low interaction energy systems [5]) or ore flotation (high interaction energy systems [5]). Investigations in the field of enhanced oil recovery are not very intensive nowadays, but the situation may change in the future. As already underlined, microcalorimetry has been used in the past to study many other systems: adsorption of liquid mixtures [39,40], polymers (from aqueous [7,69] or organic solutions [37]), and pollutants... For example, the conformation of a polymer can be assessed by determining the number of anchorage points of the chain on the surface by microcalorimetry. This has implications on the flocculation behaviour of suspensions. The study of the interaction of pollutants with solid surfaces is interesting at several levels. Firstly, one can be interested by the elimination of pollutants by adsorption on high surface area adsorbents like activated charcoals [27]. Calorimetry helps in selecting the most efficient pore size distribution or surface chemistry [8,27]. Secondly, in the difficult problem of the interaction of pollutants with soil components, the determination of adsorption enthalpies can help in distinguishing the pollutant–clay interaction from the pollutant–humic acid interaction [18]. In fact, the value of the adsorption enthalpy is not often used directly in an application, but it always improves the understanding of the phenomenon under study. If needed, it can be used to predict adsorption isotherms at other temperatures than that experimentally determined. Ellipsometry was also used for other types of detergency application (for example, displacement of polymer or proteins by surfactants).
New technological challenges are now to be faced, to which these techniques can bring useful data. For example, a problem that parallels enhanced oil recovery, is the soil remediation where pollutants have to be removed. One of the proposed solutions is to displace them by other molecules like surfactants or various complexing agents [29,54]. Both thermodynamics and kinetics information are needed to develop efficient processes. For biotechnological applications where biodegradable molecules are needed, new classes of surfactant are now under study. They are called ‘natural surfactant’ (for example, sugar surfactant) [34,64]. They can be yielded by biotechnological processes or by direct chemical synthesis (which seems the less expensive method). Most of the properties of this new class of molecule are still to be studied both in solution and at interfaces. We can expect that the in situ techniques presented in this paper will be useful to understand the properties of these new molecules, including their behaviour in contact with soil components.