

Version française abrégée
1 Introduction
L'objet de cette étude réside dans la détermination de la cinétique de diffusion des TR légères, afin de connaı̂tre les lois qui régissent les teneurs et la répartition de ces éléments dans l'apatite. La comparaison de nos résultats avec ceux des études antérieures [2,3,5,19] permet une meilleure connaissance des paramètres physico-chimiques responsables de la concentration et de la migration des TR dans l'apatite.
2 Procédure expérimentale
Les cristaux d'apatite proviennent de la région de Durango ; leur composition est donnée par Young et al. [20]. Les cristaux sont orientés, sciés et polis. Les sections obtenues sont introduites dans des chlorures de TR (La, Ce, Nd et Eu) et portées dans un four à des températures comprises entre 900 et 1150 °C, pour une durée maximale de 35 jours. Après, les cristaux sont enrobés par la résine, polis et passés à l'analyse. Les analyses sont effectuées dans les deux directions cristallographiques (a et c), à l'aide d'une microsonde électronique type CAMECA SX 50.
3 Résultats
Dans toutes les expériences, à l'interface sel fondu–apatite, les résultats montrent la cristallisation d'une mince couche, composée d'un mélange de chlorures de TR et d'apatite. La source de diffusion des TR est considérée comme plane et infinie. Selon la direction cristallographique a, les distances de diffusion sont faibles et les écarts entre les TR diffusantes négligeables. Pour la direction c, elles sont beaucoup plus grandes et les écarts entre les TR plus importants. Cependant, le même mécanisme d'échange opère dans les deux directions : (exemple du Nd, Fig. 1). À la surface de l'apatite, les profils de diffusion montrent une concentration maximale en TR correspondant à 2 atomes par formule (Fig. 2).
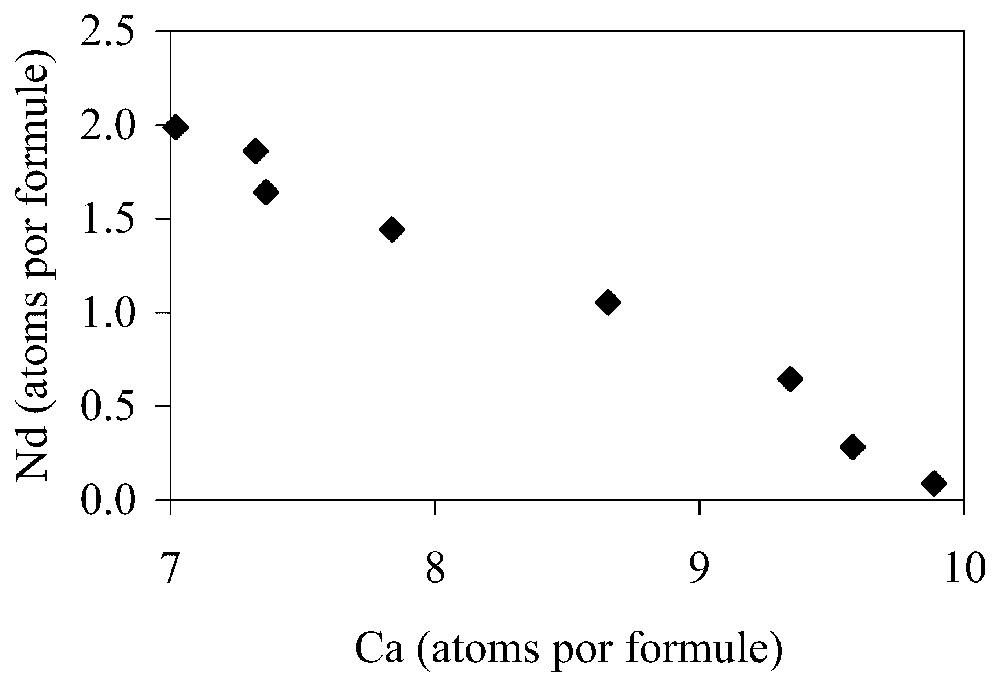
Nd and Ca content of apatite experiment at 1100 °C, showing the ratio exchange Nd/Ca=0.64.
Teneurs de Nd et Ca dans l'apatite à 1100 °C montrant le rapport d'échange Nd/Ca=0,64.
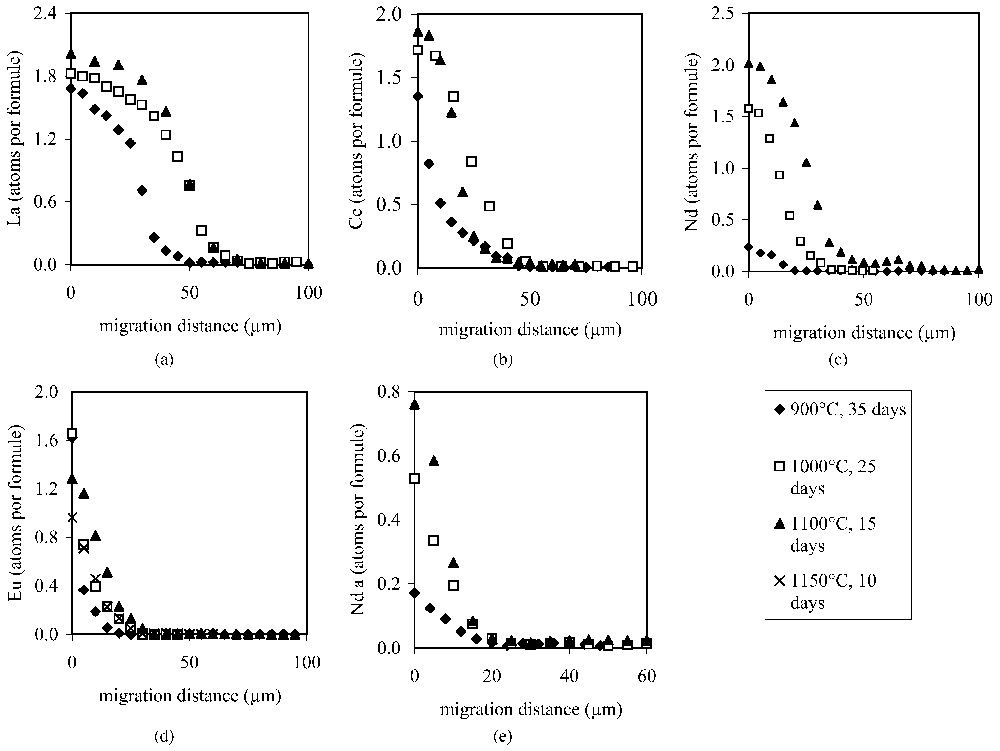
Concentration profiles for the REEs of the experiments in the c and a crystallographic directions at different temperatures: (a)–(d) diffusion profiles for La, Ce, Nd and Eu in the c crystallographic direction; (e) diffusion profile for Nd in the a crystallographic direction.
Profils de concentrations des TR à différentes températures selon les directions cristallographiques c et a; (a)–(d) profils de diffusion du La, Ce, Nd et Eu selon la direction cristallographique c; (e) profil de diffusion du Nd selon la direction cristallographique a.
4 Discussion
Les profils de diffusion montrent un processus complexe de diffusion. La concentration initiale de TR à la surface de l'apatite augmente avec la diffusion. Ceci provoque un changement de la forme des profils qui, initialement concave à faible concentration, devient convexe quand cette concentration avoisine le taux maximum de 2 atomes de TR (Fig. 3). L'échange TR/Ca s'effectue selon la réaction : , avec un taux maximum de lacunes de 10 % des sites cationiques. C'est le même taux observé dans des apatites synthétiques [14]. La structure de l'apatite semble se déstabiliser au-delà de ce seuil de lacunes, ce qui s'opposerait à une substitution totale du Ca par les TR et limiterait leur concentration à la surface du cristal à 2. Dans l'apatite, Ca occupe deux types de sites : CaI et CaII. Autour de CaII, le diamètre des tunnels coı̈ncidant avec l'axe sénaire étant plus important : entre 3 et 4,5 Å [12,13,15–17], l'échange TR/Ca s'effectue plutôt dans les sites CaII. Cette préférence pour ce type de sites a déjà été observée dans de nombreuses investigations naturelles et expérimentales [7–11] où les concentrations élevées en TR observées selon la direction c. L'existence de tunnels le long de l'axe c explique également la diffusion plus rapide des TR selon cette direction.

Schematic representation of the different shapes of diffusion concentration curves for the apatites in the experiments. (a), (b) Situation of the unsaturated state for the apatite crystals with respect to the chloride salt source (a: situation at low temperature; b: situation at higher temperature or longer period of diffusion). (c) Situation when the maximum concentration of the diffusing ion (2 REEs per 10 Ca sites) is attained. (d) Situation when saturation has been attained and diffusion has continued to progress into the apatite crystal.
Représentation schématique des différentes formes de courbes de concentration obtenues dans les expériences de diffusion dans l'apatite. (a), (b) Stade de sous-saturation entre le cristal d'apatite et le sel fondu (a : situation à faible température ; b : situation à haute température et une longue durée). (c) Situation où la concentration maximale de l'ion diffusant est atteinte (2 TR pour 10 sites de Ca). (d) Situation où l'état de saturation est atteint et où la diffusion continue de progresser dans le cristal de l'apatite.
Les distances de diffusion sont calculées à partir des profils de diffusion qui présentent deux parties distinctes : la zone de diffusion dont la concentration en TR est supérieure à la concentration initiale dans l'apatite ; la deuxième zone correspond à celle où la concentration reste inchangée. Des droites de régression permettent de limiter clairement les deux zones (Fig. 4) et de calculer les distances de diffusion (Tableau 1). Selon l'axe a, les distances de diffusion des TR sont proches et les écarts faibles.
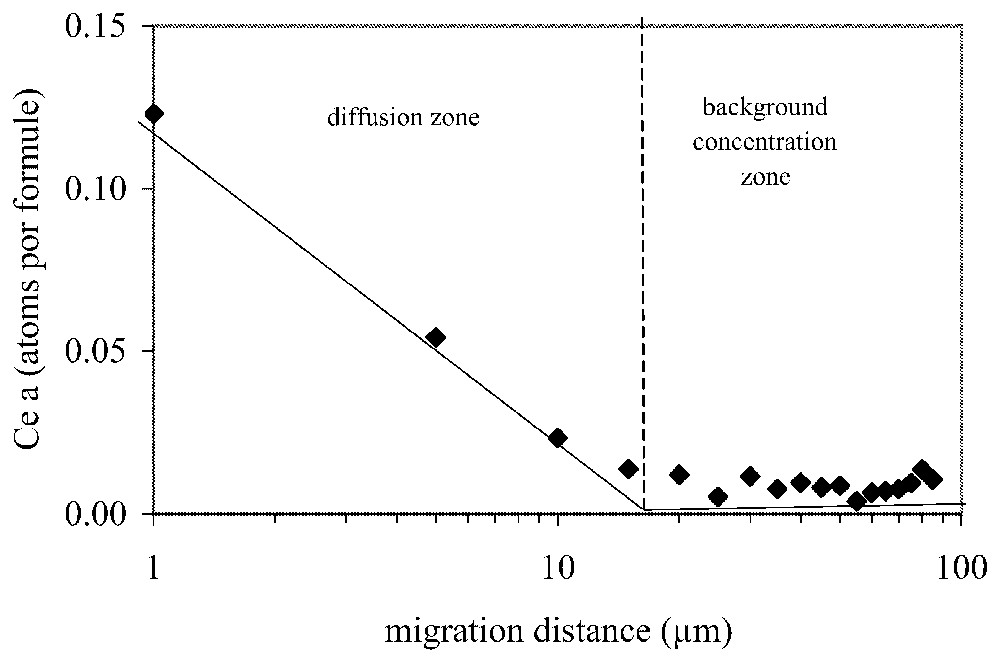
Example of method used to estimate the maximum diffusion distance in the apatite crystals. Linear regression is made for the two sectors of the composition–concentration curve of each diffusing element. Ce-diffusion example at 900 °C; concentration according to the a crystallographic direction as a function of the log distance.
Exemple de méthode d'estimation des distances maximales de diffusion dans l'apatite. Les droites de régression linéaire délimitent deux zones de composition de l'élément diffusant pour chaque profil de concentration. Exemple de diffusion du Ce à 900 °C selon la direction cristallographique a ; concentrations en fonction du log de la distance.
Summary of run information, diffusion distances and diffusivity measurements. d: Maximum diffusion distance (in μm); D: diffusivity (); a and c: crystallographic directions
Récapitulatif des conditions opératoires, distances de diffusion et valeurs des diffusivités. d : distance maximale de diffusion (en microns); D: diffusivités (); a et c: directions cristallographiques
| REE | 900 °C, 35 days | 1000 °C, 25 days | 1100 °C, 15 days | 1150 °C, 10 days | ||||
| La | 20 | 1.32 | 20 | 1.85 | 25 | 4.82 | – | – |
| Ce | 15 | 0.74 | 20 | 1.85 | 25 | 4.82 | – | – |
| Nd | 15 | 0.74 | 20 | 1.85 | 20 | 3.09 | – | – |
| Eu | 15 | 0.74 | 20 | 1.85 | 20 | 3.09 | – | – |
| La | 50 | 8.27 | 60 | 16.66 | 60 | 27.91 | – | – |
| Ce | 40 | 5.29 | 50 | 9.61 | 50 | 19.37 | – | – |
| Nd | 30 | 2.98 | 35 | 5.67 | 40 | 12.4 | 40 | 18.5 |
| Eu | 20 | 1.32 | 30 | 4.16 | 30 | 6.97 | 30 | 10.4 |
Selon l'axe c, les distances de diffusion augmentent avec le rayon ionique des TR, ce qui est en contradiction avec les observations faites sur les verres et les milieux isotropes où ce sont les ions les plus petits qui diffusent le plus loin [1,8]. La Fig. 5 montre de bonnes corrélations entre les masses atomiques des TR et les distances de diffusion. L'existence de tunnels le long de l'axe c favorise la diffusion rapide des TR selon cette direction. Leur diamètre étant supérieur à celui des TR, l'effet de la taille semble ne plus affecter la diffusion, et ce sont, selon toute logique, les cations les moins lourds qui migrent le plus loin. Il est évident que, dans ce cas, les coefficients de diffusion ne sont pas constants. Cependant, nous utiliserons la relation de base pour le calcul des diffusivités (Tableau 1). Les énergies d'activation sont calculées à partir de la relation [4]. Les relations d'Arrhenius obtenues selon l'axe c (Fig. 6) sont :

Plot of REE atomic masses against the diffusivity for the different temperatures.
Projection de la masse atomique des TR en fonction des diffusivités pour les différentes températures.
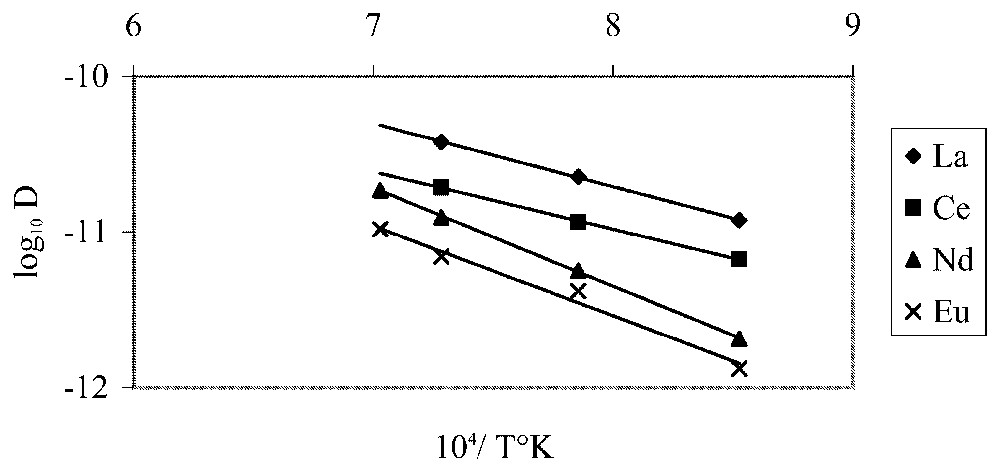
Arrhenius diagram for La, Ce, Nd and Eu diffusion parallel to the c crystallographic direction.
Diagramme d'Arrhenius de la diffusion de La, Ce, Nd et Eu parallèlement à la direction cristallographique c.
La comparaison de nos résultats avec ceux des études antérieures [2,3,18,19] fait apparaı̂tre des diffusivités plus grandes et des énergies d'activation plus faibles dans notre cas. Les modes opératoires n'étant pas les mêmes, il est logique que les résultats soient différents. En effet, la concentration initiale et le type de cations (couplés aux TR et impliqués dans l'échange TR/Ca) contrôlent le mode de substitution et affectent le processus et les paramètres de la diffusion.
5 Conclusion
À hautes températures, la diffusion des TR dans l'apatite est régie par l'existence d'un contrôle structural responsable de la non-uniformité des processus de diffusion et par la concentration initiale des cations diffusants. Le type de substitution impliqué dans l'échange TR/Ca est aussi un facteur dominant pouvant affecter le processus et les paramètres de la diffusion.
1 Introduction
The movement of ions in solids due to chemical gradients is of interest in geology, because it is a kinetic process that can be followed by using modern methods of analysis (electron microprobe, ion microprobe, etc.). As geology is a science essentially concerned with time, the kinetic aspect of chemical equilibrium is then at the heart of much of chemical geology where thermodynamic instability is the rule. Geologic conditions are frequently those of constantly changing temperature. Approach to equilibrium is then governed by temperature and time, which are in their turn the main variables in the quest for an understanding of the history of the Earth.
Movement of constituent ions in solids usually leaves a trace detected as a chemical concentration zoning or gradient in a crystal. Although previous studies have been made on diffusion in apatite [2,3,5,19], we attempt here to discover some of the major factors that are responsible for unusual types of cation migration in apatite.
2 Experimental method
Diffusion of REEs into and out of apatite crystals was effected in the following manner.
Segments of apatite single crystal specimens were prepared by diamond wheel cutting of 2 cm long slabs from single prismatic apatite crystals which came from Durango (Cerro de Mercado, New Mexico [20]). The average cation content is Ca=9.93, Na=0.08, P=5.95 and anions F=1.92, Cl=0.10 for a negative charge of 44. Slabs of the gem quality crystals were cut perpendicular to the c crystallographic axis of the prism and then polished using 1-μm grain diamond paste. Crystal diameters were 10 mm and the segment thickness was 2 mm. The segments of apatite were immersed in a molten chloride with the cation of interest (La, Ce, Nd and Eu) for periods of 35 days at 900 °C, 25 days at 1000 °C, 15 days at 1100 °C and 10 days at 1150 °C. Temperature of the muffle furnace was controlled by a chromel–alumel thermocouple to within 5 °C of that desired. A control thermocouple was placed in the position of the sample holder to verify the temperature during the experiments. The furnace was thermally insulated, but open to atmospheric gases and hence considered to have maintained a strongly oxidizing environment throughout the experiment.
At the end of the experiment the crystal slabs were cut along both the c and a crystallographic axes, polished with diamond paste and traverses were made using a CAMECA SX50 electron microprobe machine at spacing of 2 to 10 μm. Accelerating voltage of the microprobe was 15 kV, current intensity 10 to 40 nA, counting time 30 s per element. Based upon counting statistics, the errors were considered to be P±0.05, F±0.07, Cl±0.02, Ce±0.01, Nd±0.01, La±0.01 and Eu±0.015 atoms per apatite formula.
The edges of the apatite crystals, those in contact with the molten REE chloride salts during the experiment, showed the formation of mixed REE chlorides and apatite layer. The thickness of this rim was generally observed to be near 2–3 μm wide, attaining at times 5 μm at maximum.
The initial configuration of the experiment can be assimilated to that of an infinite plane source of elements diffusing into a crystal. No solid–solid interface problems would hinder such diffusion. However, the existence of a thin layer of mixed REE chlorides and apatite in all REE experiments indicates some dissolution of the apatite crystals during the course of the experiment, which was expected, as the apatite and the molten salt are not in equilibrium. The physical configuration of the experiments can be assumed to be two-dimensional when viewed in a cross section. An electron microprobe traverse perpendicular to the crystal edge gives a one-dimensional view of the diffusion.
3 Experimental results
3.1 Exchange mechanism
Experiments in the a crystallographic directions showed little diffusion and almost no detectable difference for the different diffusing species at different temperatures. Therefore, only results for the c crystallographic direction are reported here.
The exchange of light REEs for calcium in the apatites is clearly shown in Fig. 1, where the REE diffusing ion Nd contents are plotted against Ca for one experiment at 1100 °C.
It is easily seen that the replacement, and hence diffusion, of trivalent REE cations into apatite scrupulously respects electronic balance, where (slope of 0.64 for the Nd/Ca relations). Electronic balance is maintained then in the crystal structure at the concentration level investigated. The important point is that the introduction of trivalent REE elements into apatite in this study is accomplished by a two-ion-plus vacancy for three-ion substitution. This means that not only there is inter-diffusion, Ca for REE, one entering and the other one leaving the crystal, but also that there is a difference in site occupancy, leaving a vacancy in the structure after diffusion has been accomplished. There are more Ca ions leaving the crystal than REE ions entering.
3.2 Experimental profiles
The profiles of the exchanged elements in the apatite crystals are given in Fig. 2.
The concentration profiles of light REEs observed in the apatites after the experiments indicate that there is continuous exchange of REEs for Ca up to a certain limit of ionic concentration. The upper limit of substitution seems to be near two REE-substituted ions for the ten possible Ca ions in apatite. In the experiments where a high amount of exchange was effectuated, the profiles show a decided maximum value, which is similar for different ionic species. This maximum value is seen to penetrate into the crystal.
4 Discussion of results
4.1 Analysis of diffusion profile shapes
The diffusion profiles in Fig. 2 show that the diffusion process is complex. The shapes of the curves are different under different conditions of time and temperature, depending upon the diffusing ion. Analysis of the curves shows that two points are very important to note initially. The first is that the initial concentration of diffusing ion into the apatite changes as diffusion increases. This is clearly seen for Nd in Fig. 2c. The initial maximum, exterior face value is 0.2, increasing to 2. This is not the classic situation for diffusion. Normally, the outside face is initially and continually in equilibrium with the outside-diffusing medium concentration.
A second very important observation is that the shape of the profiles changes after a maximum concentration of two ions is reached. The initial, low concentration profile is convex downward for diffusing ions (Eu for example, Fig. 2d) and convex upward near the crystal edge when more exchange has taken place (La for example, Fig. 2a). High exchange produces a reversed S-shaped concentration profile. Nd and Ce show both types of profile in the experiments conducted here (Figs. 2b and c): one at low temperature, one at high temperature. When this value of two ions is reached, a diffusion front is established which advances into the crystal. The concentration vs. distance curve has a plateau.
As a result, one finds convex and concave concentration profiles of light REEs in the apatite experiments depending upon the amount of exchange that has occurred. Profiles with a high amount of exchange tend to show an abrupt decrease in diffusing ion concentration with a steep diffusion front. Diffusion in the a crystallographic direction gives only C-shaped profiles (Nd for example, Fig. 2e), indicating slower and more incomplete diffusion for the temperature-time conditions of the experiments compared to the c crystallographic direction. The maximum penetration depth of the diffusing ion in the a direction is half to one third that of the c direction in the same experiment. We will therefore limit our discussion to the c crystallographic direction. We will now consider the diffusion profiles according to their shape.
4.1.1 C shaped, convex downward profile
The profiles presented for Eu at 900 and 1000 °C, Nd and Ce at 900 °C are of this sort. For the same element, Eu, the lower the temperature, the lower the penetration depth. For these elements, the order of increasing penetration depth at 900 °C is Ce>Nd>Eu. This represents the initial stages of diffusion of the REEs into apatite crystals.
4.1.2 S shaped curves
For concentration profiles with a double curvature, forming a reversed or mirror image S shape, the concentration of the diffusing ion at the edge of the crystal approaches or is at the maximum value of two diffusing ions. Once the maximum concentration is reached at the crystal edge, the profile, in our interpretation, is due to the movement from the edge of a plane of concentration Cmax, moving inside the apatite. As an analogy, one can consider a moving plane emitting heat in a conductive medium, which gives a flat plateau value behind it. At a constant emitting temperature in front of the moving plane, there occurs a classical concave upward diffusion profile. We obtain the same kind of profiles in our data, with a transition zone between the steady-concentration zone and the concave upward one. The penetration depth increases with temperature for a given element. At a given temperature, the depth increases in the order La>Ce>Nd>Eu.
The hierarchy of penetration depth in the C-shaped profiles fit well with this order in the S shaped profiles. Fig. 3 shows the evolution of the diffusion curves diagrammatically where the maximum amount of diffusing ions is indicated as a saturation value.
4.2 Diffusion mechanism
The diffusion profile, once it attains a maximum saturation value advances into the crystal with time, showing a more and more abrupt profile as the process advances.
In order to discuss REE diffusion mechanism in apatite crystals, first of all, the apparent maximum of REE substitution in the apatite crystal of two in ten possible exchange sites indicates that there is a structural limitation to the diffusion. The maximum rate of vacancies created by the substitution: corresponds to 10% of cationic sites. That is to say a vacancy on the ten occupied atoms initially by the Ca. It is the same order of concentration observed in the synthetic apatites [14]. The structure of the apatite seems to destabilise itself beyond this level of vacancies, which oppose a total substitution of the Ca by REE and would limit the maximum concentration at the surface of the apatite crystal to 2.
In the apatite crystal, one can find two types of co-ordination sites for the calcium ions, where four sites have nine nearest oxygen neighbours (CaI) and six have seven (CaII). The seven fold coordinated calcium ions are situated around helical ‘tunnels’ or void spaces in the apatite, where the (OH), Cl and F cationic groups are found. Around CaI sites, the ternary axes have a diameter of 2.5 Å. The senary axes that surround CaII sites have a more important diameter: between 3 and 4.5 Å [12,13,15–17]. Given that one could imagine that the REEs diffuse quickly in the largest channels and will substitute easily in CaII sites. This appears to be the case in various experimental studies as well as found in observations of natural minerals [6,7,9–11].
4.3 Estimation of maximum distance of diffusion in crystals
One can note that all of the low concentration parts of the curves for diffusing ion concentration approach the zero concentration level in an asymptotic manner. In order to estimate the greatest distance of cation exchange in the crystal, we found that a plot of this low concentration portion of the curve as the log of the distance against concentration scale was efficient for estimating the position of zero concentration, and hence maximum diffusion distance in the crystal. The intersection of these curves with background values was used to estimate the point of maximum diffusion distance (Fig. 4).
These values of maximum diffusion distance determined in this manner are listed in Table 1.
The precise total distance of ionic migration cannot be determined accurately, because there was a small amount of apatite dissolution during the experiment as indicated by the 2–5-μm-thick outer mixed REE chlorides and apatite zone. This zone indicates phosphate reaction with the molten salt and hence some dissolution of apatite into the salt solution. If significant apatite were lost, the distance of ionic migration would not be accurately estimated by a simple measurement of the concentrations in the remaining apatite crystal. We assume that the dissolution of apatite was not great, the mixed REE chlorides and apatite zone is of the order of the 2–5-μm thick and hence much less than the differences in distance of ionic migration noted for the different light REE elements in the different experiments. At any rate, the apatites will have dissolved at about the same rate for all of the experiments done at the same temperature and time span and hence the differences in migration of each REE at a given temperature will have significance for differential migration rates.
The parameters that we can derive then from the experiments are the variables of the experiment: time, temperature and the maximum distance of migration of the elements from a high-concentration zone in the chloride solution into the essentially light REE-free apatite.
4.4 Diffusion and chemistry
In the range of REE ionic radii studied, one sees that the larger elements diffuse more rapidly in the apatite crystals. The relation of increasing diffusion distance in the c crystallographic direction with an increase of ionic radius is in apparent contradiction with diffusion of ions in equant or isotropic media where it has generally been observed that the smallest ion of a given charge will diffuse the fastest or furthest in a given amount of time [1,8]. By contrast, the lighter the element, the faster it diffuses. This relation is clearly shown in Fig. 5, where one observes good interrelationships between the REE atomic masses and distances of diffusion. This relation is true in all ranges of temperatures.
It appears therefore that along tunnels whose diameter (3–4.5 Å) extensively exceeds that of the REEs (1.06 to 1.16 Å), the effect of the atomic mass on the diffusion dominates that of the ionic radius, which becomes negligible.
In order to explain the relations between diffusion distances of the different ions in the experiments, it is necessary to rank these distances as a function of the physical forces acting upon them. Ln distance squared is used because the relationship of is the basic relation between distance and time. D relates these variables to temperature as [4]. The relation between temperature and distance are those used to establish the activation energy of diffusion, the essential parameter in chemical diffusion.
Fig. 6 shows the maximum diffusion distances and temperature related as a function of distance squared and reciprocal temperature. It is evident that there is a regular relationship.
The following Arrhenius relation was determined:
4.5 Previous studies of REE diffusion in apatite
In previous studies of diffusion in apatite [2,3,18,19], diffusing elements moving into the apatite crystals are at low concentrations in the surrounding medium, about two orders of magnitude lower than those in our experiments. The penetration depth observed in the apatite is roughly ten times smaller than ours, for the same experimental conditions of time and temperature. The concentration profiles in these studies have a concave downward profile for the most part. A tendency to form an S-shaped curve can be noted in only certain experiments. Watson and Green [19] calculate a diffusion constant of the order of for La at 1120 °C, assuming C-shaped profiles where the outside concentration in the crystal is assumed to be in equilibrium with the surrounding medium, a silicate melt. They assume that the edge concentration of the diffusing element in the apatite is constant during the whole experiment. However, it is most likely not constant; their edge concentration at the end of the experiment is most likely lower than the equilibrium value between apatite and the surrounding medium. Thus the calculation method used is not valid if their system behaves as that observed in the experiments reported here. If one assumes that the edge concentration changes linearly with time, one will calculate a diffusion constant five times larger. However, this variation law is hypothetical and has to be checked by experiments.
In any event, the overall diffusion coefficients that could be calculated using our experiments (maximum diffusion distance) would in any event differ from the ones from [2,3,19] by a minimum of one order of magnitude. Further, these authors do not distinguish between c and a crystallographic directions in their apatite crystals, which we have observed to give very different results. The values which they reported are of the order magnitude of the ones that one would obtain along the a crystallographic directions using the data from our experiments. The observed variations are likely a consequence of differences in the exchange mechanism operating in our and previous studies. Diffusion would be rate-limited by REE and REE cation decoupling.
5 Summary
From the data presented above, it is evident that the diffusion of light REE elements into apatite at high temperatures are governed by a complex sequence of diffusion mechanisms that complicate the task of estimating the thermodynamic values of diffusion. Nevertheless, the maximum diffusion distances into the crystals indicate regular diffusion behaviour based upon chemical characteristics of the diffusing ions. If one considers that the apatite crystals present open channels in the structure that are parallel to the c crystallographic direction, and that the diffusion distance is greatest in this direction, one can easily conclude that the structure of apatite is fundamental in determining the diffusion in the crystal. The shape of the developed diffusion profiles (inverted S-shape) is caused by the substitution of two REEs per ten Ca ions observed in these profiles and by the concentration edge of vacancies created by this substitution. The diffusion is greater for larger ions than for smaller ones. This system indicates that the crystal structure is the dominant factor in diffusion and that the chemistry of the ionic substitutions is the determining factor for diffusion distance.