

Version française abrégée
1 Introduction
Il est important de comprendre la thermodynamique des cavités souterraines dans des applications comme le stockage de déchets [12] ou la préservation des grottes ornées [5]. L'état thermique d'un milieu souterrain est contrôlé par le flux géothermique [8], la diffusion de la température de surface à travers la roche, les circulations d'eau, les échanges d'air avec l'extérieur [3], ainsi que par la présence éventuelle de sources de chaleur, par exemple une personne, qui dégage une puissance entre 100 et 140 W [4,13]. L'air y est en général saturé en eau, et celle-ci a une influence majeure sur la réponse du milieu [7,10,11,14].
Dans cet article sont présentées les variations de température enregistrées depuis près d'un an et demi dans la carrière de Vincennes, ainsi qu'une estimation de l'effet de perturbations artificielles sur ces variations.
2 Dispositif expérimental
La carrière souterraine de calcaire de Vincennes (près de Paris) fut exploitée entre 1715 et 1860. Elle est située à 18 m de profondeur et s'étend sur près de 32 000 m2 [6]. Son atmosphère est saturée en eau et la température varie entre 12,5 et 12,7 °C. La ventilation naturelle de la carrière se fait principalement par le puits d'accès [11].
Pour suivre l'évolution thermique à long terme de la carrière, une salle, située à 120 m environ du puits d'accès, fut instrumentée en juin 2001. Sa surface est d'environ 23×9 m2 pour une hauteur d'environ 2 m (Figs. 1 et 2). Trois dispositifs verticaux de dix thermistances (AI, AII et AIII) permettent de mesurer les variations de température dans l'air de la salle. En novembre 2001, un quatrième dispositif (S) fut installé pour avoir accès aux variations de température dans la roche. Les thermistances ont été intercalibrées en laboratoire, avec une erreur relative entre thermistances d'environ 4×10⁻³ °C [Perrier et al., soumis à Geophys. J. Int.].
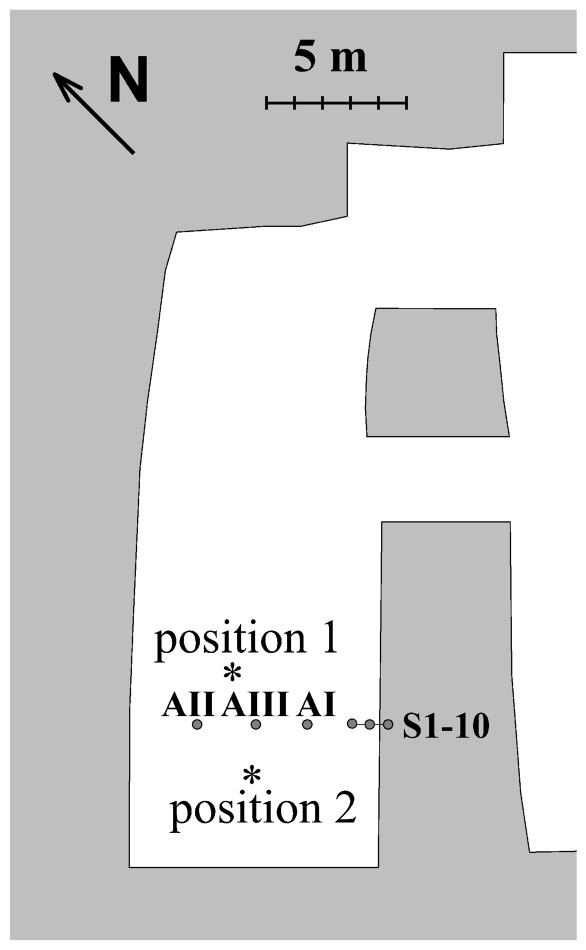
Sketch of the instrumented room in the Vincennes quarry. AI, AII and AIII indicate the location of the vertical set-ups measuring the temperature in the atmosphere, and S corresponds to the set-up installed in the rock. Positions of the sources during the heating experiments are also indicated.
Schéma de la salle instrumentée dans la carrière de Vincennes. AI, AII et AIII indiquent les emplacements des dispositifs mesurant la température de l'air, et S correspond au dispositif situé dans la roche. Les positions des sources lors des expériences de chauffage sont également indiquées.
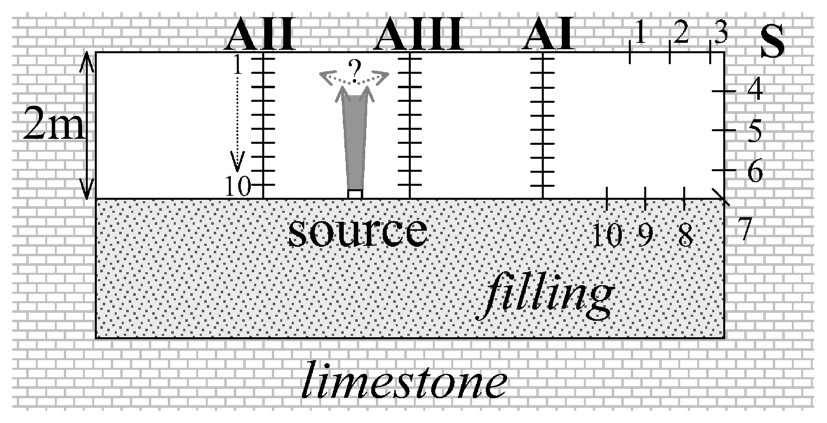
Cross-section of the instrumented room in the Vincennes quarry. A supposed shape for the plume is also depicted.
Coupe de la salle instrumentée dans la carrière de Vincennes. La forme supposée du panache créé par la source est également dessinée.
3 Variations de la température sur le long terme
3.1 Profils verticaux de température
À la profondeur de la carrière (−18 m), le flux de chaleur, vraisemblablement dominé par le flux géothermique, en raison de l'absence d'infiltrations d'eau notables, est ascendant tout au long de l'année. Si ce flux est transporté dans l'air par convection thermique pure, le gradient vertical de température y est le gradient adiabatique :
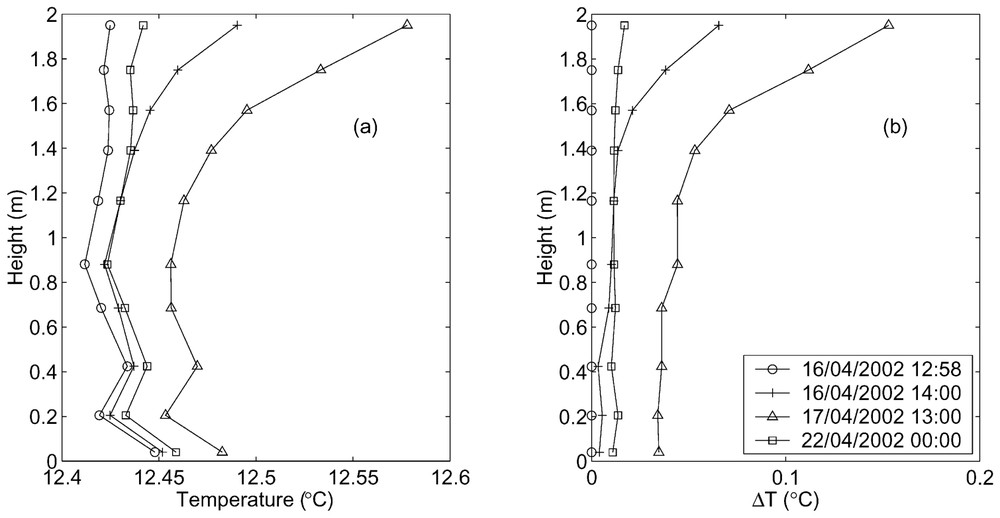
Quatre profils verticaux de température mesurés dans l'air de la salle à différentes périodes sont présentés sur la Fig. 3. Ils montrent que le gradient est faiblement positif, mais proche de la résolution du dispositif. Cependant, il semble que, tout au long de l'année, la salle soit divisée en deux couches : dans la moitié supérieure, le gradient est positif ((10±5)×10−3 °C) et dans la moitié inférieure, il est légèrement plus faible et négatif ((−6±5)×10−3 °C). Le flux de chaleur n'est sans doute pas uniquement transporté par convection thermique. Des transferts radiatifs ou des processus de convection compositionnelle doivent intervenir.
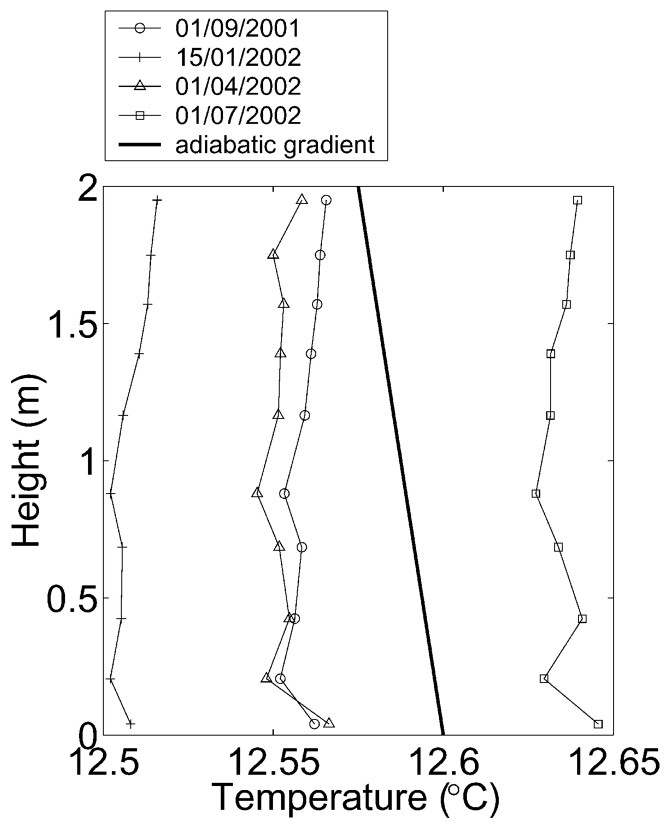
Vertical temperature profiles in the atmosphere (average of set-ups AI, AII and AIII) at four different times of the year (data recorded at 0:00 AM). The calculated adiabatic gradient is also represented.
Profils verticaux de température dans l'atmosphère (moyenne des dispositifs AI, AII et AIII) à quatre périodes différentes de l'année (points mesurés à 0 h 00). Le gradient adiabatique calculé est également représenté.
3.2 Variations annuelles de la température
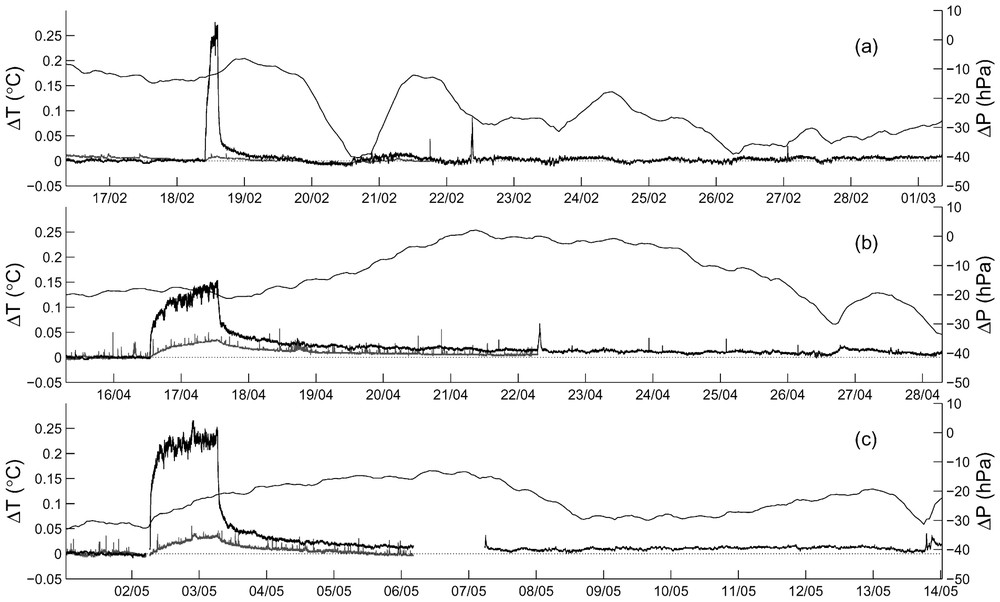
Les températures enregistrées dans la carrière entre juin 2001 et novembre 2002 sont présentées sur la Fig. 4. L'amplitude des variations est d'environ 0,16 °C dans l'atmosphère (Fig. 4b) et 0,2 °C dans la roche (Fig. 4c). Les variations de courtes périodes dans l'atmosphère sont dues à des variations de la pression atmosphérique [10]. À long terme, l'évolution de la température montre que le cycle annuel est constitué d'une succession de phases approximativement linéaires. Ces variations sont dominées par la ventilation naturelle par le puits d'accès, comme le montre la chute de température aux mois de décembre 2001 et janvier 2002 (Fig. 4b).
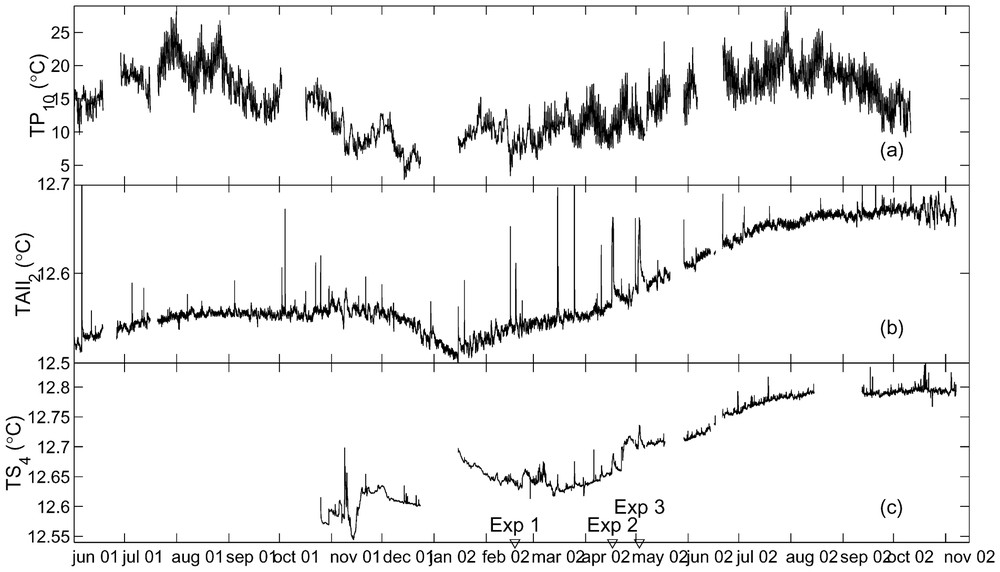
Long-term temperature variations measured at the top of the access pit (a), in the quarry in the atmosphere (set-up AII thermistor 2) (b) and in the rock (set-up S thermistor 4) (c). The dates of the three heating experiments are indicated, and other perturbations, due to human presence, are also visible. In (b), during experiment 3, data of set-up AII, interrupted at that time, have been replaced by set-up AIII.
Variations à long terme de la température, mesurées en haut du puits d'accès (a), dans l'air de la carrière (dispositif AII thermistance 2) (b) et dans la roche (dispositif S thermistance 4) (c). Les dates des trois expériences de chauffage sont indiquées ; d'autres perturbations, liées à des visites, sont également visibles. Sur la figure (b), pendant l'expérience 3, les données de AII, qui ne fonctionnait pas, sont remplacées par celles de AIII.
En outre, un réchauffement de près de 0,1 °C par an est observé (Fig. 4b), largement supérieur aux dérives instrumentales possibles. S'il se confirme sur de plus longues périodes d'observation, il pourrait être attribué au réchauffement climatique global [2] ou à un réchauffement plus local lié à l'activité anthropique de surface ; mais il pourrait être aussi dû aux multiples passages dans la carrière. La puissance émise par une personne étant d'environ 100 W, trois expériences effectuées à l'aide de sources de 100 W peuvent être utilisées pour évaluer les effets des visites sur ce réchauffement.
4 Expériences de chauffage
Les travaux de Morton [9] montrent qu'une source de chaleur crée un panache turbulent (Fig. 2), qui entraı̂ne une partie du fluide environnant vers le haut. Dans un espace confiné, il se forme ainsi un front chaud, qui descend et remplit progressivement le milieu [1]. Ce modèle peut être étendu au cas d'un milieu ventilé [4], mais n'est probablement pas valable tel quel pour un milieu non adiabatique et en présence de changements de phase d'eau.
Dans la salle instrumentée, trois expériences de chauffage ont été réalisées avec deux types de sources, placées en différentes positions (Fig. 1), de telle sorte que les thermistances soient situées en dehors du panache créé par la source. Pour la première expérience, la durée du chauffage a été plus courte (4 h 30) que pour les deux suivantes (24 h).
La température augmente simultanément sur tous les capteurs dès l'instant où la source est allumée, ce qui indique que si un front descendant existe, il doit se déplacer très rapidement. Cette augmentation de température initiale pourrait aussi être due au rayonnement de la source.
Sur la Fig. 5 sont représentées les variations de température dans l'atmosphère et dans la roche au cours des trois expériences. Le chauffage se déroule en deux phases : la première, rapide, correspond au temps que met la source à atteindre sa température maximale ; lors de la seconde phase, la température augmente plus lentement. L'amplitude des variations de température dépend de façon non linéaire de la forme et de la position de la source. Les modèles exposés précédemment ne suffisent donc pas à décrire le système. De la même façon que pour le chauffage, la première phase de refroidissement correspond à l'inertie de la source. La température décroı̂t ensuite de façon quasi exponentielle, avec un temps de relaxation d'autant plus long que la durée du chauffage est grande et le capteur plus près du sol. Ce temps est deux à quatre fois plus élevé dans la roche que dans l'atmosphère.
Temperature variations recorded in the atmosphere (set-up AIII thermistor 1 – black line) and in the rock (set-up S thermistor 4 – grey line) during the three heating experiments. An initial temperature determined one hour before heating has been subtracted from the raw data. Atmospheric pressure variations were recorded in the instrumented room with a sampling time of one hour. Data in the rock are shown only up to a few days after the end of heating because of additional effects, such as sudden shifts, probably due to operator visits.
Variations de température enregistrées dans l'air (dispositif AIII thermistance 1 – en noir) et dans la roche (dispositif S thermistance 4 – en gris) au cours des trois expériences de chauffage. La température initiale, une heure avant le chauffage, est soustraite aux données brutes. Les variations de la pression atmosphérique sont enregistrées dans la salle, avec un pas d'échantillonnage d'une heure. Les températures dans la roche ne sont représentées que quelques jours après la fin du chauffage, en raison de parasites probablement dus au passage des opérateurs.
La Fig. 6a montre les profils de température mesurés dans l'air au cours de la seconde expérience à quatre instants différents. Les profils de variation de température correspondants, obtenus en retranchant la température initiale (une minute avant le chauffage) sont présentés sur la Fig. 6b. Une stratification horizontale apparaı̂t dès la première heure de chauffage, et est encore plus marquée après 24 h : dans les 50 cm près du toit, le gradient est fort (environ 0,2 °C) ; il est plus faible (environ 0,04 °C), mais toujours positif, dans la partie inférieure de la salle. Cette stratification pourrait être la manifestation d'échanges horizontaux turbulents entre le panache et l'air environnant ou de transferts radiatifs.
Vertical profiles of temperature (a) and temperature excess (b) in the atmosphere (set-up AIII) during the second experiment at four different times, corresponding to the minute before heating, 1 h and 24 hours after the heating has begun, and 5 days after the end of the heating.
Profils verticaux de température (a) et de variations de température (b) dans l'air (dispositif AIII) au cours de la seconde expérience à quatre instants différents, correspondant à la minute précédant le chauffage, 1 h et 24 h après le début du chauffage, et 5 j après sa fin.
Cinq jours après la fin du chauffage, le gradient est presque revenu à sa valeur initiale (Fig. 6b), mais la température a augmenté d'environ 12×10−3 °C, valeur supérieure de 7,8×10⁻³ °C à celle attendue en tenant compte de la tendance à long terme (Fig. 4b). Cette élévation apparaı̂t aussi sur la Fig. 5b et c : lorsque le chauffage dure 24 h, la température n'est pas revenue à sa valeur initiale plus de 10 jours après la fin du chauffage.
5 Discussion et perspectives
Les expériences, outre leur intérêt pour la physique des panaches turbulents, montrent que 24 h de chauffage induisent des modifications à long terme, voire irréversibles, dans la carrière. Le réchauffement observé peut ainsi être dû aux visites, et aux expériences elles-mêmes à partir d'avril 2002. Pour enregistrer les variations climatiques en milieu souterrain, il est donc nécessaire de contrôler les effets des contributions artificielles.
Dans une grotte, les visites induisent des perturbations thermiques pouvant être la cause de dommages irréversibles sur la flore, la faune [3] ou les peintures préhistoriques [5]. Ces expériences montrent que plusieurs courtes visites seraient sans doute préférables à une seule de longue durée. Les perturbations pourraient également être moins importantes si les visites se déroulaient en régime de ventilation naturelle.
Une cavité souterraine peut tolérer des perturbations si celles-ci sont restreintes à un espace défini de paramètres, qu'on peut appeler le domaine de résilience de la cavité. Des études théoriques et expérimentales sont nécessaires pour définir ce domaine, dont la connaissance pourrait être importante pour des applications industrielles telles que le stockage des déchets.
1 Introduction
Understanding the thermodynamics of underground cavities is important for many applications, such as underground waste disposal [12] or the preservation of painted caves [5]. The thermal state of underground cavities, characterized by a water saturated air phase in contact with a partially saturated porous rock, is controlled by several factors: the geothermal flux [8], thermal diffusion from the surface [Perrier et al., submitted to Geophys. J. Int.], water circulation and air exchange with the outside atmosphere [3]. In addition, human presence, equivalent to a heat source of about 140 W [13], is a significant factor that can affect the thermal equilibrium of a cavity [5]. The effect of these various factors is still poorly known. However, the role of water, because of its high vaporization latent heat, appears to be fundamental.
For example, the annual temperature cycle of a limestone quarry in Mériel (France) was found to be associated with an annual variation of rock resistivity, which reflects an annual variation of rock water content [7]. Pressure induced temperature variations in the atmosphere of another limestone quarry in Vincennes were found to be controlled by the thermal inertia of the wall and the phase changes of water as well [10]. Water exchange is also associated with natural ventilation [14] and this effect, for example, contributes in the access pit of the Vincennes quarry, where cold avalanches induce an evaporative feedback response from the wall [11].
In this paper, we present first data on the long-term thermal variations in the Vincennes quarry, and we estimate how these variations can be affected by artificial perturbations.
2 Experimental set-up
The underground Lutetian limestone quarry of Vincennes (near Paris), exploited between 1715 and 1860, is now abandoned. It is located at a mean depth of 18 m, and spreads over a surface of about 32,000 m2 [6]. The quarry is made of rooms, with heights varying from 1.5 to 7 m, separated by pillars of about 4×6 m2 section. The measured relative humidity is close to saturation, a fact confirmed by moist walls. The average temperature is 12.6 °C with yearly variations within 0.2 °C. The main access pit has a diameter of about 4.5 m and is the main opening for natural ventilation [11].
To study the long-term evolution of the quarry, thermistors have been installed in a room located in the west side of the quarry, about 120 m from the access pit. Its surface area is 23×9 m2, for an average height of about 2 m (Figs. 1 and 2). The ceiling and the walls show that the encasing formation is made of an alternation of tabular limestone beds with thin clay levels [6]. The floor consists of 2-m-thick filling of quarry waste. Air exchange with the rest of the quarry takes place by two openings with section of about 3×2 m2 each (2 m height from floor to ceiling) (Fig. 1).
In order to be able to observe possible stratification effects in the atmosphere of the room, three vertical set-ups (AI, AII and AIII) of ten thermistors have been installed in June 2001 (Fig. 2). A forth set-up has been added in the rock in November 2001, with thermistors at 1.5-cm depth, sampling the interface between the rock and the atmosphere (S). The thermistors have a sensitivity of about °C−1 at 12.8 °C. Their absolute calibration is not better than 0.1 °C, but they have been intercalibrated in the laboratory in a thermally controlled bath. This method permits to obtain a thermistor-to-thermistor relative error of about 4×10⁻³ °C (95% C.L.) [Perrier et al., submitted to Geophys. J. Int.]. The long-term stability is expected to be better than 10×10−3 °C yr−1. Atmospheric pressure variations have also been measured between November 2001 and May 2002 with a sensor located in the experimental room.
3 Long-term temperature variations
3.1 Vertical temperature profiles
The mechanism of heat transport in the cavity can be elucidated from the vertical temperature gradient. In the room, a positive vertical heat flow is expected. Indeed, at the depth of the quarry (−18 m), seasonal variations of the heat flux amount to less than (assuming a heat conductivity of ), which is smaller than the geothermal heat flux (). Given the lack of significant infiltration, water transport from surface does not contribute to thermal exchanges. In the case of purely thermal convection, the temperature gradient in the atmosphere is given by the adiabatic gradient:
Four vertical profiles of temperature measured in the atmosphere at different dates are presented in Fig. 3. Although the average temperature varies with time, the vertical gradient remains approximately constant all over the year. This gradient is close to the resolution of the method of inter-calibration, but the room appears to be divided into two layers of 1-m thickness: the upper layer where the gradient tends to be positive ((10±5)×10−3 °C) and the lower layer, where the gradient tends to be negative ((−6±5)×10−3 °C). This suggests that the heat flux is not transported by thermal convection only, but that radiative transfer or compositional convection must contribute, for example, by evaporation of water from the floor and walls, and condensation on the roof.
3.2 Annual variations of the temperature
Temperature variations measured between June 2001 and November 2002 are presented in Fig. 4. The peak-to-peak amplitude amounts to about 0.16 °C in the atmosphere (sensor AII2, Fig. 4b) and to about 0.20 °C in the rock (sensor S4, Fig. 4c). Short-period variations (periods smaller than one day) are dominated by atmospheric pressure variations [10]. The evolution of temperature during the year shows a succession of more-or-less linear phases. Diffusion of surface temperature, which shows a peak-to-peak 15 °C annual wave (Fig. 4a), through the rock could contribute to this evolution, but no quantitative estimate of the amplitude or phase of the annual wave in the rock above the cave ceiling can be made, due to a poor knowledge of its thermal conductivity. However, the shape of the temperature variation in the room (Fig. 4b) is not sinusoidal, as would be the case if thermal diffusion was predominant, which suggests that the temperature variations in the room are dominated by ventilation regimes. Indeed, radon monitoring indicates an observable ventilation rate (volumetric flow rate per unit volume) of 2.4×10⁻⁶ s−1 in winter [Perrier et al., in press in J. Environmental Radioactivity], which must be a consequence of cold avalanches occurring in the access pit during winter [11]. This process must be at the origin of the decrease of temperature in the quarry atmosphere between the beginning of December 2001 and 15 January 2002. In the rock, temperature variations are probably affected by both phenomena (diffusion and ventilation), with the possible addition of noises of unknown origin.
In addition, an overall long-term positive trend corresponding to an average temperature increase of 0.1 °C per year is observed in the atmosphere, larger than possible instrumental drifts. This trend is difficult to interpret at this stage. It could result from global warming [2], an increase of anthropogenic activity at the surface, but also from repeated visits in the quarry. Indeed, one person corresponds to a power of 100 [4] to 140 W [13], and groups of more than five persons working during several hours (such as on 16 March 2002, see Fig. 4b and c) might significantly modify, in an irreversible manner, the unperturbed equilibrium temperatures, the vertical temperature gradient, and thus the heat transport phenomena in the quarry. In order to estimate this effect, several heating experiments, performed in the instrumented room to study the thermal reaction of the system, can be used.
4 Heating experiments
If a localized heat source is introduced in the quarry, it is expected that a thermal turbulent plume will be initiated above the source, with a narrow opening angle of about 11° [9] (Fig. 2). In a filling-box model [1], the plume will develop into a steady state feeding a horizontal layer of hot air near the roof, with a front going down, slowly invading the whole room. This model can be extended in the presence of ventilation [4], but may not be valid with non-adiabatic walls and phase changes of water.
Three heating experiments have been performed, with two different heaters: one hot plate with dimensions 19×15 cm2 and one smaller resistor with dimensions 5×7 cm2. The positions of the sources were chosen so that the measuring set-ups in the atmosphere are located outside the plume (Fig. 2). Experiment 1 was performed with the hot plate located at position 1 (Fig. 1) during 4.5 h, experiment 2 with the hot plate at position 2 (Fig. 1) during 24 h; and experiment 3 with the resistor at position 2 (Fig. 1) during 24 h. The hot plate was installed on the floor, whereas the resistor was installed at a height of 58 cm, so that the plume virtual origin corresponds to the floor level [9]. Both heaters, which have an intrinsic thermal inertia, have been studied in the laboratory. The maximum temperature of the plate is reached about half an hour after the beginning of the heating, and the temperature decreases to its initial value in about 1 h. The resistor has a smaller inertia: its maximum temperature is reached after less than 15 min and the temperature decreases in about 50 min. During the experiments, temperature was recorded with a sampling interval of 1 min for the first experiment, and 15 s for the second and the third.
At the beginning of heating, no descending front was observed, but the temperature is increasing simultaneously on all sensors as soon as the heater is turned on. This does not necessarily mean that the front does not exist, but the filling time in this case would need to be smaller than the sampling time. Alternatively, the initial simultaneous temperature increase could be due to radiative contribution from the source. More work is needed to draw further conclusions.
Temperature variations measured by sensor 1 of set-up AIII (near the ceiling) and sensor 4 of set-up S (in the rock) during the three experiments are shown as a function of time in Fig. 5. For the three experiments, the heating takes place in two phases. The first phase is fast and corresponds to the time that the source takes to reach its maximum temperature. During the second phase, the increase is slower, with coherent fluctuations that remain poorly constrained at this stage. The maximum temperature is smaller in the second experiment (Fig. 5b) than in the first one (Fig. 5a), although the source is closer to the set-up (Fig. 1). In the third experiment (Fig. 5c), a larger amplitude is produced, although the second heater has the same power. Thus, the shape of the source and its position in the room are important parameters and models beyond a simple filling box are needed. Compared with the atmosphere, the temperature increase in the rock has a smaller amplitude (maximum 30×10−3 °C), with a possibly different time structure.
Fig. 6a shows the vertical temperature profiles in the atmosphere (set-up AIII) during the second experiment at four different times. Fig. 6b shows the corresponding vertical profiles of temperature excess associated with the heating, obtained by subtracting the initial temperature profile determined one minute before heating. After 1 h of heating, the source has reached its maximum temperature. The vertical pattern of temperature increase is similar on the three set-ups, indicating that, during heating, a horizontal stratification of the room atmosphere is established. Temperature has increased on the whole height of the room, but more near the ceiling (Fig. 6a). This stratification is even stronger after 24 h of heating: the gradient is about 0.2 °C in the upper part of the room (50 cm from ceiling) and 0.04 °C in the lower part. Radiative transfers or turbulent exchanges between the plume above the heater and the surrounding air must be at the origin of this stratification.
Three cooling phases can also be distinguished in Fig. 5. The first phase corresponds to the inertia of the heater (about 1 h). The second phase corresponds to an approximately exponential relaxation of the system, with a relaxation time that amounts to a few hours in the atmosphere for experiment 1 and varies from 7 to 10 h for experiments 2 and 3, with values tending to be larger for sensors near the floor. In the rock, the relaxation times tend to be longer by a factor 2 to 4, depending on the sensor considered and on the particular experiment. A third phase of longer duration will be described below.
Five days after the end of the heating, the gradient is close to its initial value (Fig. 6b), but a temperature excess of about 12×10−3 °C remains on all sensors. This temperature excess is larger than expected from the long-term trend discussed above. Indeed, during the week preceding the experiment, the corresponding increase amounts to 0.7×10⁻³ °C per day; thus, the observed temperature after 6 days is 7.8×10⁻³ °C above the expected value. This is confirmed in Fig. 5, which shows that the original temperature is not restored after 10 days in experiments 2 and 3, by contrast to experiment 1. This fact is not easy to interpret, but in the presence of water, small perturbations can induce non-linear and hysteresis effects, such as evaporation/condensation phenomena at the rock–atmosphere interface. The possibly irreversible response of the cavity to heating could thus contribute to the long-term temperature increase observed in the quarry. In any case, thermal relaxation of the atmosphere with long-time scales must be controlled by heat exchanges with the walls and their thermal response.
5 Discussion and outlook
In this paper, we present indications that 24 h of low power heating produce long lasting, possibly irreversible, changes in an underground cavity. The observed long-term temperature increase might therefore be attributed to repeated visits in the quarry, and to the heating experiments themselves after April 2002. A similar long-term temperature increase has been observed in Japan [Perrier et al., submitted to Geophys. J. Int.], in a subsurface cavity unfortunately also affected by numerous visits. In either case, an interpretation of the temperature increase in terms of global warming thus cannot be safely proposed at the moment. In order to be able to monitor long-term temperature changes in underground observatories, perturbations due to visits or other artificial contributions have to be avoided or carefully monitored.
These experiments, in addition of providing accurate data on unknown aspects of the physic of turbulent plumes, also provide guidelines for the preservation of painted caves. Indeed, presence of visitors (tourist groups or research teams) induces heating in the cavity [13]. Accumulation of thermal effects could lead, in the long run, to significant damage to the flora, fauna [3] and to the archaeological remains, including, first of all, the wall paintings [5]. Our experiments support the idea that successive sets of short duration periods (4 h per day, for example) are safer than one single long duration of 24 h. In the presence of thermally active natural ventilation, as for example observed in December 2001–January 2002 in Vincennes (Section 3.2), the thermal effect of visits may be reduced.
A complex system such as an underground cavity may be able to tolerate perturbations (such as visits or artificial modifications of the natural ventilation), if they are restricted to a definite domain of parameters, which could be referred to as the resilience domain of the cavity. Theoretical and experimental work is needed to explore the various dynamical regimes of underground cavities and their sensitivity to external perturbations. This may be important also in industrial applications, such as underground waste disposals. In any case, the resilience domain of each individual cavity would need to be established carefully by dedicated experiments.
Acknowledgements
The authors thank Michel Roesch, Dimitri Spoliansky and Michel Laroche from the ‘Inspection générale des carrières’, city of Paris, France, for the access to the Vincennes quarry, and Xavier Lalanne, for assistance during the experiments. This paper is IPGP contribution No. 1895.