

amplitude of signals at depth |z|
A(0)amplitude of the input signal
C ovelocity of light (m s−1)
Cvelocity of an electromagnetic wave (m s−1)
C svolumetric heat capacity of the solid fraction (J m3 K−1)
C vvolumetric heat capacity of medium (J m3 K−1)
C wvolumetric heat capacity of water (J m3 K−1)
D hhydraulic diffusivity (m s−1)
D ththermal diffusivity (m2 s−1)
ETrreal evapotranspiration
ksaturated hydraulic conductivity (m s−1)
k nthermal conductivity of an unsaturated medium (W m−1 K−1)
k sthermal conductivity of the solid fraction (W m−1 K−1)
k effeffective hydraulic conductivity (m s−1)
k rwrelative water permeability
K*complex dielectric constant
K′real part of the dielectric constant
K″imaginary part of the dielectric constant
P bbubling pressure (Pa)
P ccapillary pressure (Pa)
Peffeffective rainfall
Rcoefficient of spatial representativity of measurements
t hphase lag of hydric transfer from the modelling (s)
hydric phase lag observed (s)
t thphase lag of thermal transfer from the modelling (s)
thermal phase lag observed (s)
Tadesaturation rate (% days−1)
Trsaturation rate (% days−1)
S ethe normalized saturation
S wwater saturation
S wirrirreductible water saturation
βhmodelled amplitude damping of hydraulic transfer
observed hydraulic amplitude damping
βthmodelled amplitude damping of thermal transfer
observed thermal amplitude damping
τperiod of the signal
ϕporosity (%)
θvolumetric water content (%)
σdclow frequency conductivity (S m−1)
λa fit parameter
ωangular frequency (s−1)
ɛofree-space permittivity (≈ (36π)−1 10−9 F m−1)
j(−1)1/2
1 Introduction
Many agricultural, environmental and engineering practices require the knowledge of the saturated hydraulic conductivity of the vadose zone. This knowledge is required, for example, in the design of agricultural drainage systems to lower seasonally high water tables and in the determination of the mounting of the water table under retention ponds or drainage areas of septic systems. The study of the temporal and spatial evolution of the water content and the thermal signal in porous materials as rainwater passes through the vadose zone is of scientific interest [3,18]. In fact, the water flow and contaminant transport through the vadose zone show an increased attention, for instance in waste disposal in porous medium, for the retention of pollutants within the pore space of rock masses in the near surface. It is also important in characterizing and predicting hydrological processes in the unsaturated zone.
On the other hand, many authors use temperature monitoring in order to evaluate the recharge in unsaturated soils [6,15,16]. Vertical water seepage in the vadose zone results in a convective heat transport that modifies the temperature profile and its variations with time. These authors have obtained some results using the temperature measurements in the determination of the vertical water seepage.
The purpose of this paper is to report on an experimental study of the volumetric water content evolution and the thermal transfer conducted over three hydrological cycles between August 2001 and November 2004 in an abandoned underground quarry (Saint-Germain-La-Rivière, France) located in a carbonate vadose zone. Then, a flow and heat transfer model was built, using the hydraulic and thermal properties of the carbonate vadose zone and their sinusoidal fluctuations, and its results were compared with experimental data obtained in situ.
2 Hydrological setting
The site is an underground quarry exploited by the “rooms and pillars” method. The cross-sections of pillars vary from 6.6 m2 to 69.9 m2 (Fig. 1). Their height varies from 2.1 m to 4.4 m. These quarries have an overlying rock thickness of 3 to 7.2 m with a static stress ranging between 0.2 and 0.5 MPa. The experiments were focused on the spatial distribution and evolution with time and depth of the water content and temperature in the limestone of the quarry. The effective rainfall (Peff) was considered to be the source of water in the vadose zone and was used as the entrance signal of the system. The effective rainfall is defined as the difference between the precipitation water (P) and the real evapotranspiration (ETr) Peff = P − ETr (Fig. 2 and 3). The local topography is essentially flat and horizontal. Hence, runoff is not taken into account. The water flows mainly from the surface to the underlying aquifer through the porous pillars (Fig. 2).
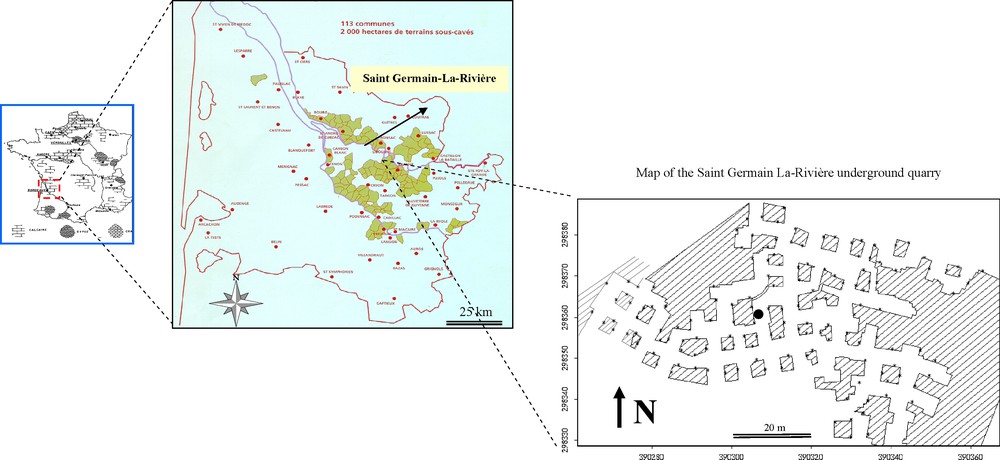
Location of the underground quarry; location of time domain reflectometry (TDR) measurement points (*) of water content and temperature (●) inside the Saint-Germain-La-Rivière underground quarry.
Fig. 1. Localisation de la carrière souterraine étudiée ; localisation des points de mesure de teneur en eau par réflectométrie en domaine temporel (TDR) (*) et de température (●) à l’intérieur de la carrière souterraine de Saint-Germain-La-Rivière.
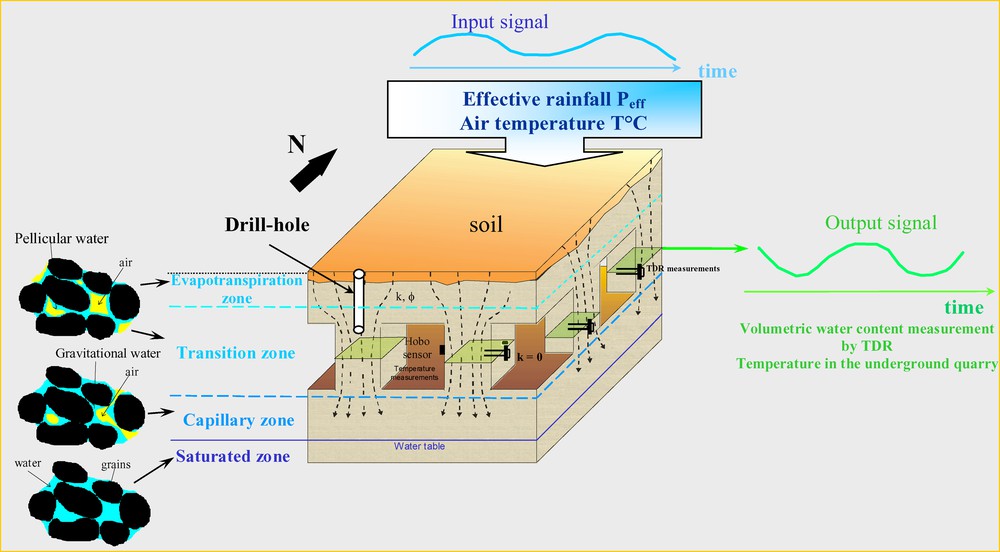
Location of the underground quarry in the hydrological system (vadose zone) and methods of study.
Fig. 2. Localisation de la carrière souterraine étudiée dans le système hydrologique (zone vadose) et les méthodes d’étude.
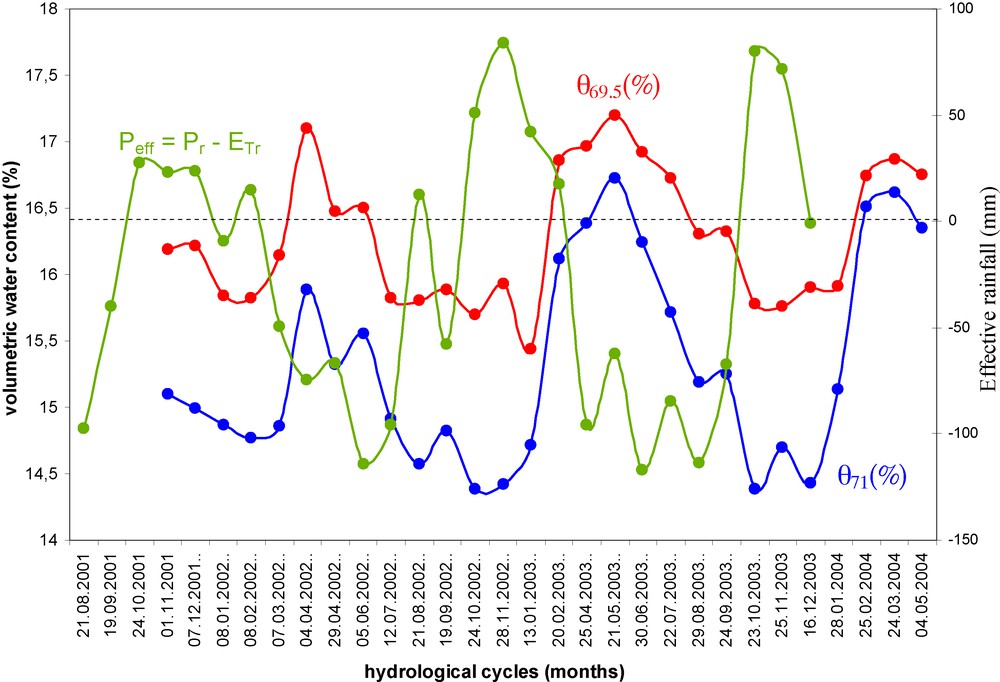
Time series of time domain reflectometry (TDR) volumetric water content measurements at the 69.5 m and 71 m (NGF) depth in Saint-Germain-La-Rivière underground quarry during 2001–2004. Comparison between volumetric water content and effective rainfall during the same period.
Fig. 3. Séries temps des teneurs en eau par réflectométrie en domaine temporel (TDR) aux profondeurs de 69,5 m et de 71 m (NGF) dans la carrière souterraine de Saint-Germain-La-Rivière, durant la période 2001–2004. Comparaison entre la teneur en eau et les précipitations efficaces durant la même période.
The weather data are obtained from a meteorological Météo France station (Saint-Gervais). The real evapotranspiration is given by the Penman-Monteith model. Temperatures outside the quarry are taken from the meteorological station. A monthly time step is used in this study and is adequate for the characterization of the hydrological cycle (Fig. 3 and 4).
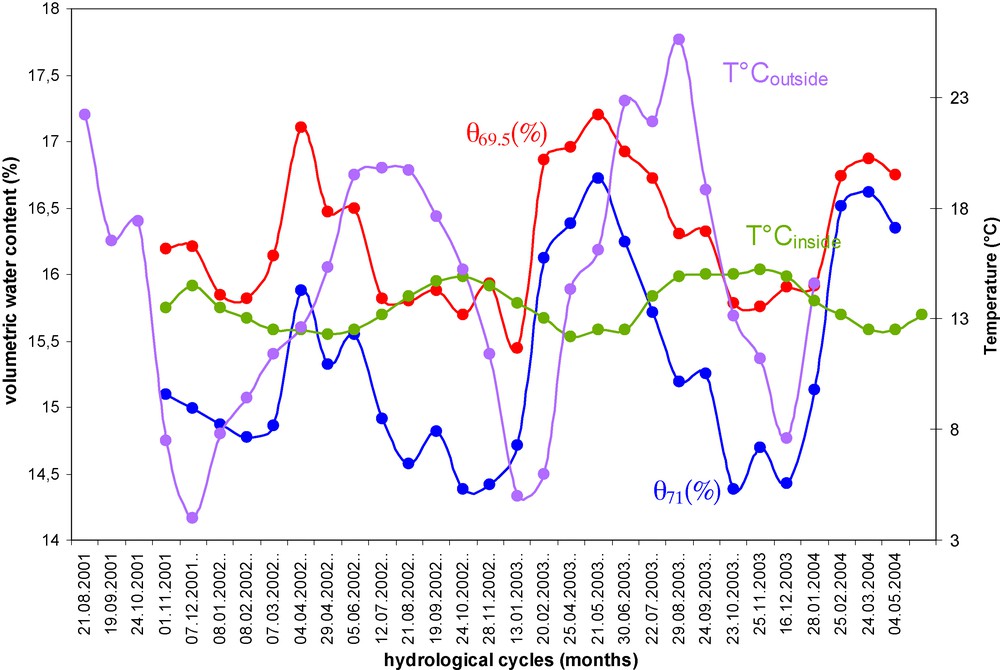
Time series of the outside temperature, of the inside quarry temperature and of the time domain reflectometry (TDR) water content measurements at the 69.5 m and 71 m NGF depth in Saint-Germain-La-Rivière.
Fig. 4. Séries temps de la température à l’extérieur, de la température à l’intérieur de la carrière souterraine et des mesures de teneur en eau par réflectométrie en domaine temporel (TDR), aux profondeurs de 69,5 m et de 71 m dans la carrière de Saint-Germain-La-Rivière.
The porous network is represented by the matrix pores only as the fractures are sealed with impermeable red clays. More than 98 core samples have been taken from the pillars as well as from boreholes drilled from the surface through the rock cover immediately above the mine pillars in order to analyse the physical properties (Fig. 2).
In Saint-Germain-La-Rivière, the water table lies at 16 m below ground. The capillary rise is neglected at the studied scale. The average temperature in the underground quarry is 13 ± 2 °C. This temperature varies during three hydrological cycles. The variation of temperature can play an important role in the exchange of water between the rock and the atmosphere of the quarry. The experiments performed in an underground limestone quarry in Vincennes (France) [9,11] show that for a temperature variation of about 2 °C, the saturation variation will be about 2% for a limestone whose average saturation is about 80%. In our case, the relative saturation variation is limited to about 1% for a limestone whose relative saturation varies between 35% and 50%. The exchange between the rock and the atmosphere is neglected at the studied scale. The water flow is mainly vertical, from the surface to the aquifer water table through the porous pillars.
3 Methods and theoretical background
The method used to measure the soil-moisture content is the time domain reflectometry (TDR). Several authors [9,13,17] applied the TDR to the measurement of the apparent dielectric constant of soils, which is strongly dependent on their water content. The dielectric constant of a material is a complex quantity having the following form [7,8]:
| (1) |
Different variables, such as texture, structure, soluble salts, water content, temperature, density, and measurement frequency affect the dielectric constant of soils [17]. For frequencies between 1 MHz and 1 GHz, the real part of the dielectric constant does not appear to be strongly dependent on the frequency. The TDR-method is based on a measuring the transit time of an electromagnetic wave in a transmission line of a known length within the material sample:
| (2) |
The wave travels along two rods of the TDR-probe of length l, it is reflected at the end of the rods and travels back the same way. The velocity measurement is transformed into a transit time measurement following the relationship (C = 2l/t) from which one gets:
| (3) |
In a porous medium, made of at least three components, air (K′ = 1), grains (K′ = 3 to 5) and water (K′ = 81), the velocity depends both on the proportions of these components and on the nature of the grains.
Different models have been proposed to describe the relationship between the volumetric water content θ and the relative dielectric constant K′. Topp et al. [17] showed that a third-order polynomial function was adequate to describe the relationship between K′ and θ as:
| (4) |
Although the individual calibration for each soil/rock may be necessary to obtain precise measurements of water content, this empirical relationship is still the most widely used in soil science.
The volumetric water content (θ) equals the product of porosity (θ) and water saturation (Sw). In a water-saturated rock, the water content is a measurement of porosity: θ = θSw.
4 Experimental results
4.1 Water content measurements
Three hydrological cycles (August 2001 to November 2004) were studied.
A monthly analysis of volumetric water content measurements and effective rainfall indicated that the rock saturation at the studied site varied between 35% and 50% (Table 1). Throughout the three cycles, the saturation never reached 100%. The maximum saturations were observed during cycle 2 (January 2003 to January 2004) (saturation ≈ 50.6%) while the minimum saturation observed was 35.1% (Table 1).
Volumetric water content and water saturation measured during three hydrological cycles in the underground quarry.
Tableau 1 Teneurs volumiques en eau et saturations mesurées durant les trois cycles hydrologiques dans la carrière souterraine.
| Site | Cote m NGF | Depth Δz (m) | ϕ | Cycle 1: January 2002 to January 2003 | Cycle 2: January 2003 to January 2004 | Cycle 3: January 2004 to May 2005 | |||||||||
| Volumetric water content (%) | Saturation (%) | Volumetric water content (%) | Saturation (%) | Volumetric water content (%) | Saturation (%) | ||||||||||
| Minimum | Maximum | Minimum | Maximum | Minimum | Maximum | Minimum | Maximum | Minimum | Maximum | Minimum | Maximum | ||||
| Saint-Germain 1 | 69.5 | 7.35 | 0.34 | 15.44 | 17.1 | 45.4 | 50.3 | 15.76 | 17.2 | 46.3 | 50.6 | 15.76 | 16.87 | 46.3 | 49.6 |
| Saint Germain 2 | 71 | 5.85 | 0.41 | 14.38 | 15.88 | 35.1 | 38.7 | 14.38 | 16.72 | 35.1 | 40.7 | 14.38 | 16.62 | 35.1 | 40.5 |
The volumetric water content of the vadose zone shows maxima and three minimum values (Fig. 5):
- • first cycle (January 2002 to January 2003): the volumetric water content in the vadose zone at 69.5 m (NGF) reached a maximum of 17.1% during April 2002 (water saturation ≈ 50.3%). This maximum was related to the maximum effective rainfall of October 2001 (Peff ≈ 27.6 mm). There was a six month time-lag between the rainfall events of October 2001 and their inference at depths of 5.85 m and 7.35 m. The rates of decrease (Ta) and increase (Tr) in saturation of the carbonate formation in the vadose zone of 5.85 and 7.35 m are given in Table 2;
- • second cycle (January 2003 to January 2004): the volumetric water content in the vadose zone at 69.5 m (NGF) reached a maximum of 17.2% in May 2003 (water saturation ≈ 50.6%). This maximum was related to the maximum effective rainfall of October 2002 (Peff ≈ 84 mm), also with a six-month time-lag. The desaturation (Ta) and saturation rates (Tr) of the carbonate formation in the vadose zone are Ta = 0.00766% day−1 and Tr = 0.01375% day−1 at 5.85 m depth. The rates of decrease (Ta) and increase (Tr) in saturation at depths of 5.85 and 7.35 m are given in Table 2;
- • third cycle (January 2004 to May 2004): the volumetric water content of the vadose zone at 69.5 m (NGF) reached a maximum of 16.9% in March 2004 (water saturation ≈ 49.6%). This maximum was related to the maximum effective rainfall of October 2003 (Peff ≈ 79.8 mm), again with a six-month time-lag. The rates of decrease (Ta) and increase (Tr) in saturation at depths of 5.85 and 7.35 m are given in Table 2.
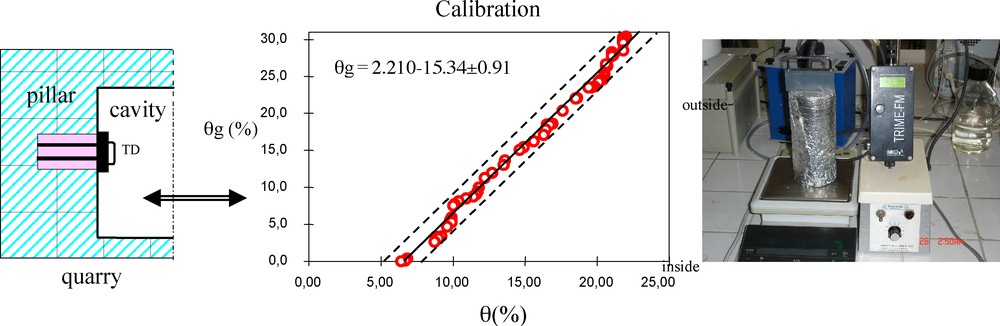
Calibration process: the water content θg is measured by direct weighing of the sample and by the value θ given by the TDR technique.
Fig. 5. Calibration : la teneur en eau θg mesurée par pesée de l’échantillon et par la technique de réflectométrie en domaine temporel (TDR) (θ).
Water desaturation rate (Ta) and water saturation rate (Tr) (in % days−1) in the vadose zone.
Tableau 2 Taux de désaturation en eau (Ta) et taux de saturation en eau (Tr) (en % jour−1) dans la zone vadose.
| Cycle 1 | Cycle 2 | Cycle 3 | Cycle 1 | Cycle 2 | Cycle 3 | |
| Saint Germain-La-Rivière | Saint Germain-La-Rivière | |||||
| 7.35 m depth (69.5 m NGF) | 5.85 m depth (71 m NGF) | |||||
|
|
0.0058 | 0.00766 | – | 0.0073 | 0.0151 | – |
|
|
0.0223 | 0.01375 | 0.0093 | 0.0202 | 0.01125 | 0.0147 |
4.2 Thermal transfers
The temperatures in the quarry are measured with a Hobo apparatus located in its centre (Fig. 4). Mean monthly values are obtained from hourly measurements for comparison with other monthly measurements (for example the water saturation).
We also observed three thermal cycles related to three maximum and three minimum values of the temperature outside and inside the quarry.
The thermal signal outside the quarry is characterized by maximum and minimum average temperature values (Fig. 4). The thermal signal evolution inside the quarry is characterized by maximum and minimum average temperature values (Fig. 4). There is a 3.5-month time-lag between the thermal signal outside the quarry and its inference at the 5.85 m depth.
4.3 Laboratory measurements
4.3.1 Calibration of the time domain reflectometry and representativity
The calibration process aims at obtaining the true value of the water content from the in situ TDR measurements. The TDR measurements require the probe to be in good contact with the rock. A slight void space between the electrode and the material causes significant measurement errors because the estimated K′ is sensitive to the dielectric properties of the medium. Some authors [2] have quantified the effect of the gaps around the electrodes analytically and numerically. They showed that air-filled gaps caused a significant underestimation of K′, whereas water-filled gaps result only in a slight overestimation of K′.
In a TDR probe with two rods, the main energy of the electromagnetic waves is restricted to a cylinder with a diameter equal to twice the distance between the two rods (Fig. 5) [8,10,13]. Hence, the rock sample measurement volume is a cylinder of approximately 8 cm in diameter and 16 cm in length. The calibration uses the volumetric water content obtained by the TDR and the gravimetric one obtained by the direct weighing of the sample. For the calibration of the TDR apparatus, we used a core sample whose size was of the order of the rock volume measured by the electromagnetic field (8 cm in diameter and 16 cm in length). The core is first dried with a primary vacuum and then in a drying oven at 60 °C. Next, the core is vacuum-saturated with water flushed at a high velocity to ensure good saturation. The core is progressively unsaturated at ambient temperature. The water content θg is measured by direct weighing of the sample and by the value θ given by the TDR technique. From these, we obtain the following calibration relationship (Fig. 5):
| (5) |
The discrepancy between the TDR volumetric water content and the gravimetric one is due to the quality of the contact between TDR probes and the porous rock.
The spatial representativity of the measurements is verified by comparing the experimental distribution DMobs to the punctual distribution DMal predicted by Poisson's law with the same density. From this, we obtain the coefficient R of spatial representativity [7]:
| (6) |
Values of the data spatial representativity coefficient R.
Tableau 3 Valeurs du coefficient de représentativité spatiale des données R.
| Sites | Depth Δz (m) | Number of measurements | Area (m2) | R |
| Saint-Germain 1 | 5.85 | 145 | 3369 | 1.26 |
| Saint-Germian 2 | 7.35 | 140 | 3369 | 1.23 |
4.3.2 Hydraulic properties
The basic physical properties used in this model are the permeability and porosity. Their measurement was obtained from 98 cylindrical samples. The air permeability of the rock was determined by flow experiments using an IFP49 variable head air permeameter, and converted into hydraulic conductivity k. In the case of linear beds in series, the appropriate average hydraulic conductivity is equal to the harmonic mean as:
The porosity was obtained by mercury injection. The average porosity ϕ takes into account the porosity of all beds. In the case of two-phase flow (water and air), the hydraulic diffusivity is defined by:
| (7) |
The relative water permeability is generally assumed to depend only on the water saturation Sw and ranges between 0 and 1. We used the Brooks-Corey pressure–saturation curves [1]:
| (8) |
For the drainage case and for the wetting phase, the water relative permeability can be estimated by the empirical Brooks-Corey model [1]:
| (9) |
Many authors propose a Corey-type water relative permeability:
| (10) |
In this paper, we used the simple relation given by [1]:
| (11) |
Fig. 6 gives the experimental curve of the water-air capillary pressure versus the water saturation obtained by the “porous plate” method [5]. In our case, the experimental irreducible water saturation is Swirr = 0.25. From equation (11) and using this experimental curve of Fig. 6, we obtained the relationship between the water relative permeability and the water saturation (Fig. 7). Table 4 gives different petrophysical properties at different depth used in this study during the modelling process.
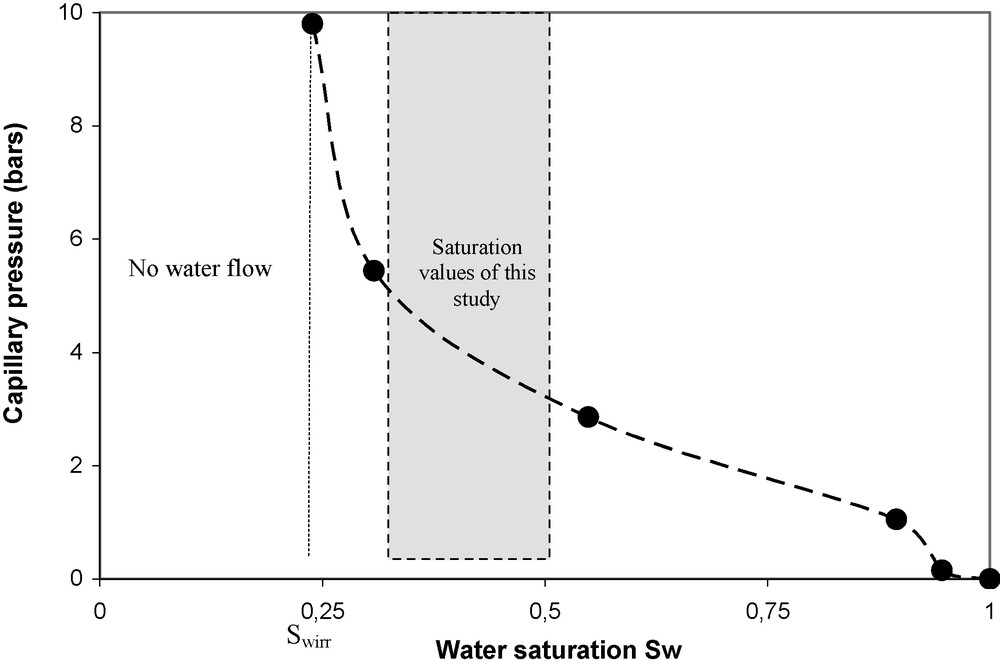
Experimental curve of air-water capillary pressure Pc versus water saturation Sw.
Fig. 6. Courbe expérimentale de pression capillaire air-eau Pc en fonction de la saturation en eau Sw.
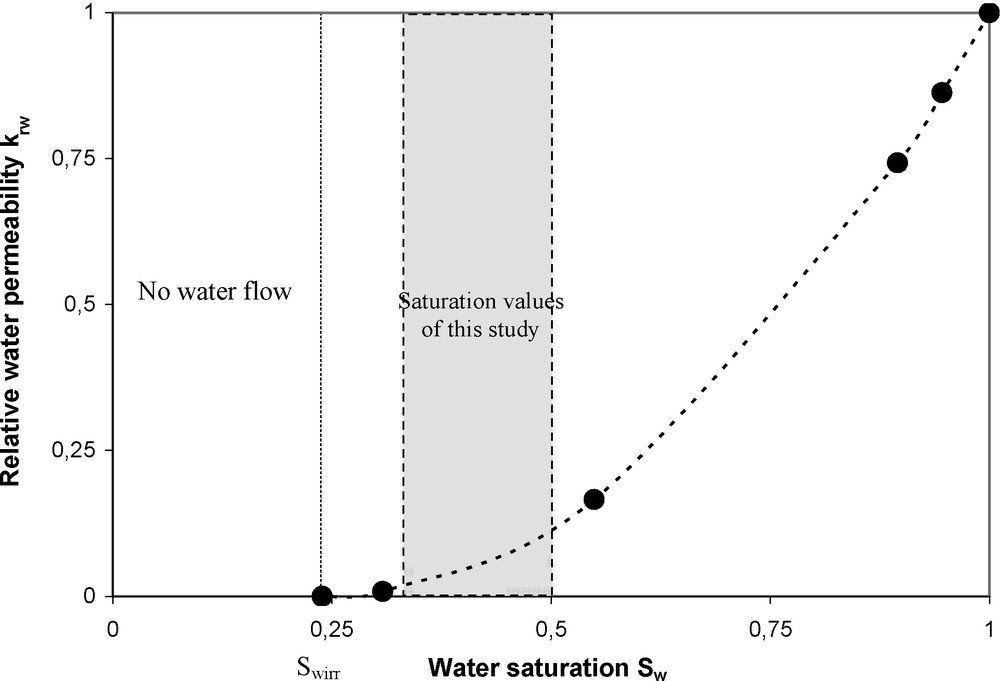
Water relative permeability krw versus water saturation Sw obtained by the Corey-type model (equation (19)).
Fig. 7. Perméabilité relative à eau krw en fonction de la saturation Sw obtenue avec le modèle de type Corey (Éq. (19)).
Hydraulic properties measured on the studied site and used for modelling water transfer.
Tableau 4 Propriétés hydrauliques mesurées dans le site d’étude et utilisées dans le modèle de transfert hydrique.
| Sites | Cote m NGF | Depth Δz (m) | ϕ | k 10−6 (m s−1) | krw minimum | Maximum | keff 10−6 (m s−1) | Dh 10−6 (m s−1) | ||
| Minimum | Maximum | Minimum | Maximum | |||||||
| Saint-Germain 1 | 69.5 | 7.35 | 0.34 | 4.5 | 0.049 | 0.123 | 0.221 | 0.554 | 0.65 | 1.63 |
| Saint-Germain 2 | 71 | 5.85 | 0.41 | 4.5 | 0.022 | 0.056 | 0.099 | 0.252 | 0.241 | 0.614 |
4.3.3 Thermal properties
In order to evaluate the thermal transfer in the carbonate vadose zone, we define different thermal properties which depend on several time-independent variables. Many authors have studied the changes of thermal properties with moisture content changes [6,14–16]. The thermal diffusivity Dth (m2 s−1) in an unsaturated medium is defined by:
| (12) |
| (13) |
kn the thermal conductivity is estimated by:
| (14) |
Equations (12)–(14) allow us to obtain maximum and minimum values of the thermal diffusivity (0.59–0.61 × 10⁻⁶ m2 s−1) using a uniform porosity ϕ = 41%, a maximum volumetric water content θ = 16.7%, a minimum volumetric water content θ = 14.4%, a volumetric heat capacity of the solid fraction Cs ≈ 2 × 10⁶ J m−3 K−1, a volumetric heat capacity of water Cw = 4.18 × 10⁶ J m−3 K−1 and a thermal conductivity of the limestone ks = 2.1–3.4 W m−1 K−1.
5 Modelling and discussions
5.1 Propagation, amplitude damping and phase lag of hydraulic/thermal signal – Model used in this study
In this study, we use the same model to analyse the phase lag and the amplitude damping of the thermal signal and volumetric water content at different depths in a homogeneous porous medium. If the thermal signal or volumetric water content signal at depth z = 0 (air temperature outside the cavity, effective rainfall) is a sinusoidal signal with a period τ, the thermal signal or volumetric water content measured at depth z must be again a sinusoidal signal with the same period τ but with a phase lag and damped. If we take into account only the conduction or diffusion process, a thermal or hydraulic signal at z = 0 defined by [4,12]:
| (15) |
becomes at depth z = −|z|:
| (16) |
| (17) |
The amplitude damping of the signal can be written:
| (18) |
From equation (16) we can deduce the time t for the hydraulic and thermal signals to pass from depth z1 to z2:
| (19) |
| (20) |
| (21) |
| (22) |
| (23) |
5.2 Results of the modelling
Table 5 gives the modelling results of the water transfer time in the vadose zone. The comparison between the predicted time and the measured time from TDR measurements generally shows a good agreement. The favourable modelling results show that the hydraulic transfer is dominated by the physical properties of the porous medium and its depth. The convection (which is neglected in the model) thus plays a minor role in the hydraulic transfer through the vadose zone. The discrepancy between the predicted hydraulic transfer time th and the measured hydraulic transfer time th′ is mainly due to the fact that the model does not take into account convection.
Comparison between the predicted time of water transfer (th) from equation (21) and the measured time of water transfer (th′).
Tableau 5 Comparaison entre le déphasage du signal hydrique (th) prédit par l’équqtion (21) et celui du signal hydrique mesuré (th′).
| Sites | Depth Δz (m) | Dh 10−6 (m s−1) | th 106 (s) | th (months) | |||||
| Δz | Minimum | Maximum | Maximum | Minimum | Maximum | Minimum | |||
| Saint-Germain 1 | 5.85 | 0.241 | 0.614 | 18.9 | 11.8 | 7.2 | 4.5 | 15.6 | 6 |
| Saint-Germain 2 | 7.35 | 0.65 | 1.63 | 14.4 | 9.12 | 5.5 | 3.5 | 15.6 | 6 |
This study shows that it is not possible to neglect the transfer of water through the unsaturated zone in a carbonate environment such as our site. This is an important point when predicting recharge to an aquifer. Some approaches of the hydraulic transfer in an unsaturated zone have been based on the assumptions that the hydraulic transfer is instantaneous. This study shows that the transfer time is not instantaneous and can be of the order of 6 months for a depth of 5–7 m in a limestone of saturated hydraulic conductivity of 4.5 × 10⁻⁶ m s−1.
Table 6 gives the comparison between the amplitude damping of the hydraulic signal at two different depths z1 and z2 obtained by modelling (equation (20)) and measured with the TDR technique. We observe a good agreement between modelling results and experimental data. From this, we deduce that above the water table the hydraulic signal amplitude must be near zero and the water content must be constant.
Comparison between the predicted amplitude damping (βh) of water transfer from equation (20) and measured damping
Tableau 6 Comparaison entre l’atténuation du signal hydrique (βh) prédite par l’Éq. (20) et celle mesurée
| Depth (m) | τ 106 (s) | Dh 10−6 (m s−1) | βh | ||||
| Sites | Δz | Minimum | Maximum | Maximum | Minimum | ||
| Saint-Germain | 1.5 | 31.56 | 0.65 | 1.63 | 0.6 | 0.4 | 0.5 |
Table 7 gives the modelling results of the thermal transfer time. The comparison between the predicted time values obtained from equation (23) and the measured time shows a discrepancy: the transfer time of the predicted thermal transfer (4.6–4.7 months) is longer than the measured value (3.5 months). The difference is likely due to an air circulation between outside (atmosphere) and inside the quarry and a rapid re-equilibration of air temperature in the vadose zone. The model used does not take into account the dynamics of the air in the quarry. The second observation is that the measured water transfer times in the vadose zone (about 6 months) are longer than the measured thermal transfer (3.5 months). On the contrary, the predicted water transfer time in the vadose zone (4.5–7 months) is equal to the predicted thermal transfer time (4.5–4.6) (Tables 5 and 7). The good agreement between the predicted temperature variation versus time and the predicted water transfer time is consistent with the results of many authors such as Cheviron et al. [6], Tabbagh et al. [15]. In fact, the time variation of the temperature in an unsaturated medium can be used for the determination of the vertical water flow rate.
Comparison between the predicted time of thermal transfers (tth) from equation (23) and that measured
Tableau 7 Comparaison entre le déphasage du signal thermique (tth) prédit par l’Éq. (23) et celui mesuré-th′ dans la carrière souterraine.
| Sites | Depth (m) | Dth 10−6 (m2 s−1) | τ 106 (s) | tth (months) | |||
| Δz | Maximum | Minimum | Minimum | Maximum | |||
| Saint-Germain 1 | 5.85 | 0.61 | 0.59 | 31.56 | 4.5 | 4.6 | 3.5 |
Table 8 gives the comparison between the amplitude damping of the thermal signal at two different depths z1 and z2 obtained from by modelling βth (equation (22)) and measured βth′ from the TDR measurements. The discrepancy between the predicted amplitude damping (2.3–2.4) and the measured amplitude damping (1.9) is likely due to the influence of the air circulation in the quarry.
Comparison between the predicted amplitude damping (βth) of thermal signal from equation (22) and that measured
Tableau 8 Comparaison entre l’atténuation du signal thermique (βth) prédite par l’Éq. (22) et celle mesurée
| Sites | Depth (m) | τ 106 (s) | Dth 10−6 (m2 s−1) | βth | |||
| Δz | Maximum | Minimum | Minimum | Maximum | |||
| Saint-Germain 1 | 5.85 | 31.56 | 0.61 | 0.59 | 2.3 | 2.4 | 1.9 |
6 Conclusions
This paper studied the water and heat transfer in the vadose zone of a carbonate formation during three hydrological cycles (August 2001–May 2004). The application of the TDR method to determine the water content of the porous rock was used to monitor the water transfer. More than 285 measurements of rock water content during three hydrological cycles distributed throughout the quarry show a permanently undersaturated limestone (between 35% and 50%). Three periods of maximum water content correspond to three effective rainfall maxima but with a time-lag. The results showed that the time for water transfer was long, about 6 months. The phase lag and amplitude damping of the hydraulic and thermal signal with depth have been modelled taking into account the measured physical properties of the porous medium. The comparison between the predicted and measured hydraulic transfer time is good; however, the comparison between the predicted and measured thermal transfer time shows a discrepancy, most likely due to air circulation between the outside (atmosphere) and inside of the quarry and a rapid re-equilibration of the temperature in the vadose zone with that of the air. The predicted water transfer time in the vadose zone (4.5–7 months) is equal to the predicted thermal transfer time (4.5–4.6). This good agreement is consistent with the results of many authors.
Acknowledgments
The authors thank Ghislain de Marsily for insightful reviews and input.