

Abridged English version
1 Introduction
The UTh/He thermochronology method assumes a homogeneous chemistry of the minerals, but chemical variations within apatite crystals are ubiquitous (e.g., [3,24,27]). Large variations of U and Th content within an apatite will induce errors in the UTh/He age [19,20] and invalidate any geological interpretation of the data. Combining cathodoluminescence (CL) and laser ablation ICP–MS (LA–ICP–MS) studies allowed us to qualitatively link the brightness of various zones within the apatite crystals with the Ce, U and Th content. The CL image gives a first order idea of the variation of Ce, U and Th within the apatite and the use of LA–ICP–MS allows a quantitative description of the Ce, and expected U and Th distribution, which is then used to correct the UTh/He age.
2 Consequences of chemical variations within a mineral for UTh/He dating
2.1 UTh/He analysis
The UTh/He method is based upon the radioactive decay of U and Th in minerals [15,25,29,30]. Throughout their radioactive decay process, these two elements produce a number of 4He particles, it is then possible to calculate a mean UTh/He age. When decay occurs, the 4He particle is ejected to a distance of 14 to 33 μm, depending on the decaying nucleid [31]. This process implies that some of the 4He particles can be ejected out of the crystal. That possibility is taken into account using a recoil correction factor (Ft) dependent on the size and shape of each individual crystal [6,7].
A heterogeneous distribution of U and Th within a crystal can thus lead to large errors in the UTh/He age calculation. Meesters and Dunai [20] have shown that when, for example, the U and Th are concentrated at the edge of the crystal, the age calculated assuming a homogeneous distribution could be as low as one third of the age calculated using a corrected recoil factor.
2.2 U and Th distribution within apatite crystals
The fission tracks distribution can be used as a first indicator of the U distribution in a crystal (e.g., [5,8–10,13,22]). Fig. 1 shows two cases of heterogeneous distribution of the fission tracks in apatites from the Ballachulish granite (Scotland). The high U content of the external rim in Fig. 1a will induce an under-estimation of the UTh/He age, whereas the high U content ‘core’ in Fig. 1b will lead to an over-estimation of the age. Nevertheless, the fission tracks distribution can only be used as an indicator of the U distribution when the number of tracks is large enough to give a clear picture.
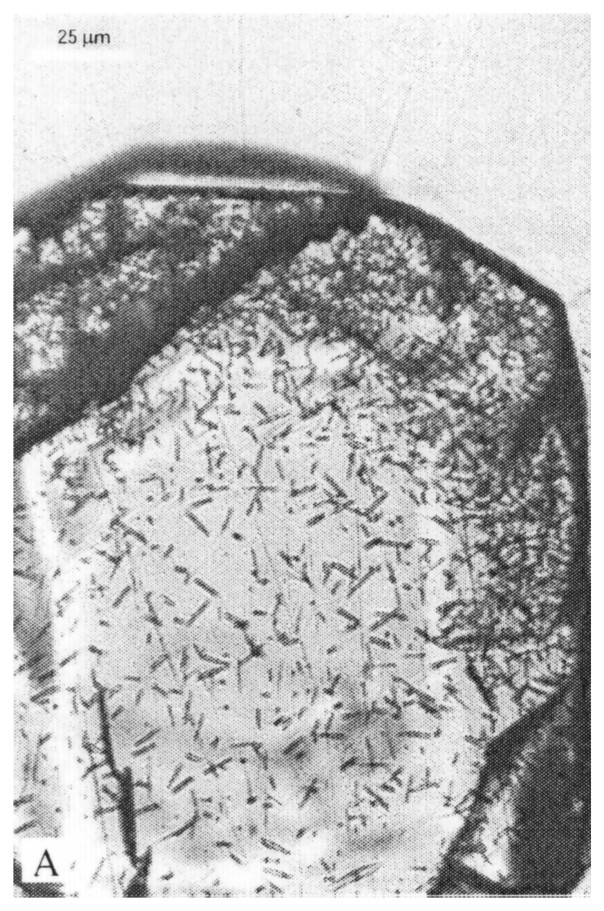

Deux cas extrêmes de zonation de l'U dans les apatites du granite du Ballachuslish (Écosse). À gauche (A), la répartition de l'U sur le bord du grain entraı̂ne une sous-estimation de l'âge UTh/He du grain. À droite (B), cet âge sera au contraire surestimé.
Two cases of highly zoned apatites from the Ballachulish granite (Scotland). To the left (A), the location of the U around the edge of the crystal will lead to an underestimation of the UTh/He age. Reversely, to the right (B), the age will be overestimated.
2.3 Cathodoluminescence imaging
In transmitted light, apatites obtained from the Shap granite (NW Scotland) appear as homogeneous, euhedral crystals. When observed using cathodoluminescence (CITL Technosyn 8200 Mk4 system with an accelerating voltage of 22 kV and incident beam of 220 μA), the same crystals show a range of zoning patterns (Fig. 2). The luminescence spectrum depends upon the system used [28], the varying response of the crystal lattice through time [18,21] but mostly upon the Mn and REE concentration [1,2,17]. The variation of luminescence observed in Fig. 2 implies large chemical variations inside the crystallising granitic magma [4]. Numerous UTh/He studies have been done using apatites from granite samples, which are usually supposed to be more homogeneous in chemistry than metamorphic rocks. Chemical heterogeneities between crystals from a same granite have been widely described (e.g., [3,24]) and Fig. 2 shows that it is also the case within a single crystal.
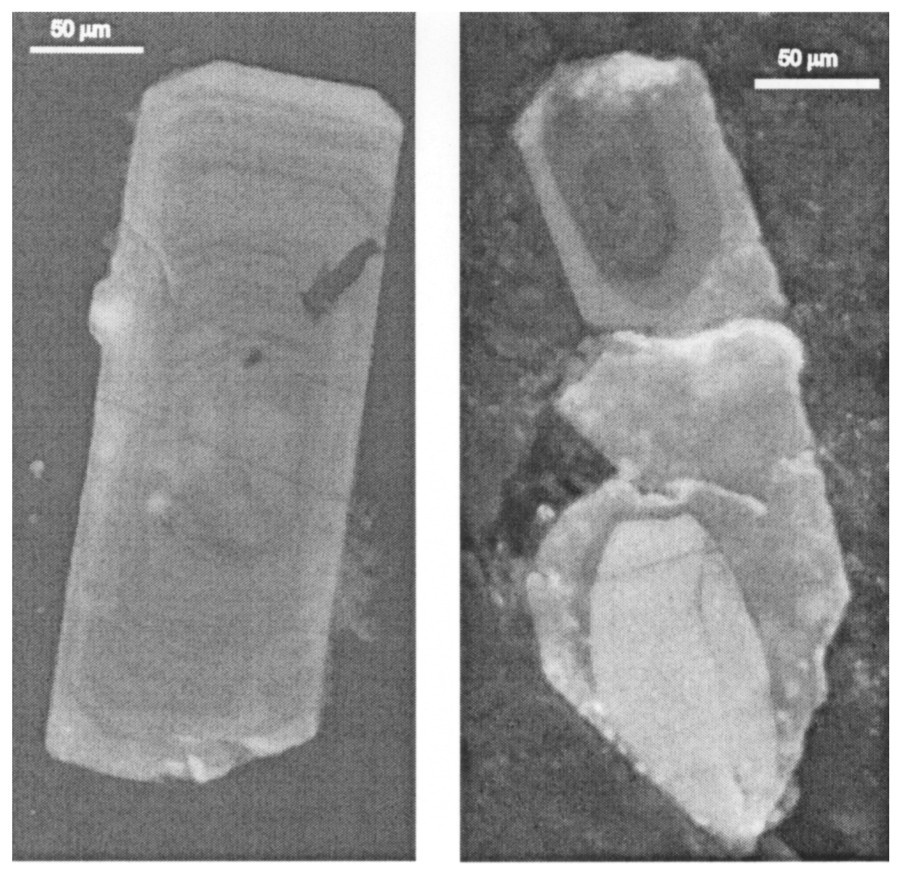
Exemples d'image en cathodoluminescence des apatites du granite de Shap. Le cristal de gauche présente une zone centrale formée de plusieurs « cœurs », entourée d'une zone finement zonée, elle-même entourée d'une bordure claire épaisse. Le cristal de droite montre deux « cœurs » clairement individualisés.
Examples of cathodoluminescence images of apatite from the Shap granite. The crystal on the left shows several ‘cores’ surrounded by a thinly zoned area, itself surrounded by a broad clear zone. The crystal on the right shows two well-defined cores.
Comparison between the fission track distribution and the CL images indicates that the bright zones have a higher track density than dark ones. The intermediate zones are more difficult to interpret due to their thinly zoned structure.
LA–ICP–MS analysis has been used to check the correlation between the CL intensity and Ce, U and Th content of each type of zones.
2.4 Laser ablation ICP–MS chemical analysis
The small volume of material used for each analysis (102 to 104 μm3 [14]) and the good sensibility of the apparatus (0.01 to 1 ppm [11,16]) allows a detailed study of the chemical variations between each single CL zone in a crystal. Analyses were done at Memorial University (Newfoundland) using a 266 nm Nd:YAG laser system attached to a VG Fisons PlasmaQuad II+ ‘S’ quadrupole mass spectrometer [4,11,26]. The laser was focused 100–200 μm above the sample surface and fired at 10 Hz repetition rate using an energy of 0.2–0.5 mJ pulse−1 depending on the concentration of the trace elements in the sample. Each measure started with 40 to 60 s of background analysis (laser off) followed by 50 to 100 s of sample analysis (laser on). A NBS 612 glass [12] and an apatite standard (Slyudyanka) were analysed every 20 samples. Ca concentration (measured using an electron microprobe) being constant in all apatite crystals was used as an internal standard. Analysis showing occurrences of zircon inclusions have been eliminated.
Fig. 3 shows the correlation between the CL intensity (in%) and the Ce (Fig. 3a), Th (Fig. 3b) and U (Fig. 3c) content in the selected analysis. All three elements show a negative correlation with the CL intensity. The good correlation of Ce and CL indicates that the CL intensity is truly controlled by chemical variations. The Th content varies from 20 to 110 ppm whereas the U content varies between 10 and 33 ppm only showing a weak negative correlation with the CL intensity.

Corrélation entre la concentration en Ce (a), Th (b) et U (c), mesurée par LA–ICP–MS et l'intensité de la luminescence dans les différentes zones des apatites du granite de Shap (Nord-Ouest de l'Angleterre).
Correlation between Ce (a), Th (b) and U (c) concentration obtained by LA–ICP–MS analysis and the luminescence intensity of the various zones within the Shap granite apatites (northwestern England).
3 Conclusion
Chemical heterogeneity within apatite crystals is a first order problem for UTh/He thermochronology. The use of cathodoluminescence coupled with a detailed analysis of the U and Th content shows a direct relationship between the CL intensity and the Th and U concentration. LA–ICP–MS analysis indicates large variation of the Th concentration (1 to 6) between the different typical CL zones. The U concentration seems more stable but still varies from 1 to 3 between the various CL zones. Furthermore, the Th and U concentrations vary in the same way. The small variations of U content compared to the variations of Th concentration imply that the use of the fission tracks distribution, which only depends on U content is not enough to fully describe the U and Th zoning in the apatite crystals.
The analysis of chemical heterogeneity within apatite crystals being ubiquitous for UTh/He thermochronology, the use of CL imaging appears to be a good and cheap way to obtain first order information on Ce, U and Th distribution. If the heterogeneity is large, electron microprobe analysis of Ce may be used to infer the type of U and Th zoning. Nonetheless whether or not this methodology can be applied to any kind of zoning in apatite is still to be clarified.
1 Introduction
La technique d'analyse thermochronologique UTh/He telle qu'elle est utilisée actuellement suppose une répartition homogène des éléments chimiques dans les minéraux. Des différences de composition chimique entre apatites d'un même échantillon mais aussi dans une même apatite sont toutefois fréquentes (par exemple, [3,24,27]). Des variations importantes de concentration en U et en Th au sein d'un cristal peuvent entraı̂ner des erreurs dans la détermination de l'âge UTh/He de ce cristal [19]. L'analyse de plusieurs cristaux étant indispensable à la détermination de l'âge moyen d'un échantillon, l'importance de l'erreur sur chaque âge individuel ne permet pas de déterminer un âge moyen significatif. Une étude par cathodoluminescence (CL) et ICP–MS à ablation laser a permis de faire un lien qualitatif entre l'intensité de la luminescence des différentes zones d'un cristal d'apatite et la répartition du Ce, de l'U et du Th dans ce même cristal. L'image obtenue par CL fournit un premier aperçu de l'hétérogénéité chimique des apatites étudiées. Une analyse chimique fine des différentes zones observées en CL permet ensuite de déterminer quantitativement la répartition de l'U et du Th et de corriger l'âge UTh/He.
2 Implications d'une hétérogénéité chimique des minéraux pour la datation UTh/He
2.1 Analyse (UTh)/He
La méthode (UTh)/He est basée sur la décroissance radioactive de l'U et du Th dans les minéraux [15,25,29,30]. Cette décroissance radioactive produit un certain nombre de particules d'4He stockées dans le réseau cristallin sous des conditions adéquates de température, variables suivant les minéraux (de 80 à 40 °C environ pour les apatites) [6,7]. En mesurant la concentration des trois éléments U, Th et 4He dans les minéraux, il est possible de calculer un âge moyen (UTh)/He. Lorsque l'4He se forme, la particule est éjectée à une distance variant entre 14 et 33 μm en fonction du nucléide initial [31]. Ce processus implique que certaines particules d'4He sont éjectées du minéral. Cette possibilité est prise en compte lors du calcul de l'âge (UTh)/He par un facteur de correction (Ft) dépendant de la taille et de la forme de chaque cristal [6,7]. La technique suppose une répartition homogène de l'U et du Th dans les échantillons.
Une répartition hétérogène de l'U et du Th dans les cristaux d'apatite peut induire une erreur importante dans le calcul de l'âge (UTh)/He moyen. Par exemple, si ces éléments sont concentrés sur le pourtour du grain, il est statistiquement probable qu'une grande partie de l'4He produit sera éjecté, entraı̂nant une sous-estimation du facteur de correction Ft. Meester et Dunai [19,20] ont montré que, dans ce cas, l'âge calculé en supposant une distribution homogène de l'U et du Th peut être jusqu'à 66 % plus jeune que l'âge (UTh/He) réel.
3 Distribution de l'uranium et du thorium dans les apatites
La distribution des traces de fission (par exemple, [5,8–10,13,22]) dans un cristal peut être utilisée comme un indicateur de la répartition de l'uranium. La Fig. 1 montre deux cas extrêmes de distribution hétérogène des traces de fission dans des cristaux d'apatite provenant du granite du Ballachulish (Ouest de l'Écosse). Dans ce même granite, deux types de répartition des traces dans les apatites sont observés : (a) une large zone centrale montrant quelques traces, entourée d'une couronne à très forte densité de traces ; (b) de petits agrégats de traces dans des cristaux montrant une densité moyenne de traces, faible. Dans le premier type, la concentration de l'U à la bordure des cristaux entraı̂nera une sous-estimation de Ft pour la méthode (UTh)/He et donc une sous-estimation de l'âge. Le deuxième type de distribution, au contraire, entraı̂nera une surestimation de l'âge. Les traces de fission ne peuvent toutefois être utilisées comme indicateur de la répartition de l'U dans les minéraux que si leur densité est suffisante pour présenter une image claire de leur distribution.
3.1 Imagerie par cathodoluminescence
En lumière naturelle transmise, les apatites étudiées (apatites du granite de Shap, Nord-Ouest de l'Angleterre) apparaissent, lorsque les traces de fission n'ont pas été révélées, comme des cristaux homogènes, avec peu ou pas d'inclusions. L'observation en cathodoluminescence (système CITL Technosyn 8200 Mk4 avec un voltage d'accélération de 22 kV et un faisceau incident de 220 μA, monté sur un microscope Zeiss Axioplan) révèle, dans les mêmes cristaux, une grande variété de zones différenciables par leur luminescence (Fig. 2). Le spectre de luminescence observé sur un cristal dépend du système de mesure utilisé [28], de la réponse variable du système cristallin de chaque minéral au cours du temps [18,21], mais principalement de la teneur en Mn et en Terres Rares (REE) des cristaux [1,2,17]. Les variations de luminescence observées sur les échantillons d'apatite de la Fig. 2 étant essentiellement liées à la composition chimique des minéraux (appareil de mesure identique et temps d'observation faible de quelques secondes) impliquent des variations chimiques importantes dans le magma granitique au cours de sa cristallisation [4]. De nombreuses études UTh/He ont été réalisées sur des cristaux d'apatite provenant de roches plutoniques ; ils sont supposés, à la différence de ceux provenant de roches paradérivées, avoir une composition chimique homogène. L'homogénéité chimique était déjà discutable à l'échelle d'un ensemble de cristaux provenant d'une même roche (par exemple, [3,24]) ; la Fig. 2 montre qu'elle n'est pas non plus vérifiée à l'échelle du cristal.
La comparaison entre la distribution des traces de fission et les différentes zones de luminescence montre que les cœurs sombres ont une densité de traces inférieure à celle observée dans les zones claires. De plus, les zones marquées par une alternance de fines bandes claires et sombres présentent une densité de traces supérieure à celle des autres zones. Les traces de fission ayant une taille largement supérieure à la largeur des bandes, il est possible que la forte densité observée dans ces zones mixtes soit due à la présence de bandes claires (riches en Ce), enrichies en U.
Pour vérifier la corrélation entre l'intensité de la luminescence des différentes zones et leur teneur en Ce, U et Th, une étude chimique individuelle de chaque région des cristaux a été faite par ICP–MS Laser (LA–ICP–MS).
3.2 Analyses chimiques par ICP–MS à ablation laser
Le faible volume de matériel (102 à 104 μm3 [14]) utilisé pour chaque analyse par ICP–MS à ablation laser permet d'étudier en détails les variations chimiques au sein d'un même cristal. De plus, la sensibilité de l'appareil (0,01 à 1 ppm [11,16]) facilite la détection de faibles variations chimiques entre différents points de l'échantillon. Les mesures LA–ICP–MS ont été réalisées au Memorial University (Terre Neuve) avec un laser de type 266 nm Nd:YAG monté sur un ICP–MS VG Fisons PlasmaQuad II+ « S » [4,11,26]. Le laser était focalisé entre 100 et 200 μm de la surface et la mesure faite avec une fréquence de 10 Hz et une énergie de 0,2 ou 0,5 mJ par impulsion, suivant la concentration des éléments en traces dans l'échantillon. Chaque mesure consistait en 40 à 60 s de mesure du bruit de fond, laser éteint, puis 50 à 100 s, laser allumé. Une analyse d'un verre standard (NBS 612 [12]) et d'une apatite de composition connue (Slyudyanka) sont intercalées toutes les vingt analyses d'échantillons pour contrôler la validité des résultats. Le Ca ayant une concentration quasi-constante dans les cristaux étudiés (la composition varie de moins de 0,5% sur 100 analyses par microsonde électronique) est utilisé comme standard interne pour le traitement des données LA–ICP–MS. Les cristaux d'apatite contiennent souvent des inclusions de zircon trop petites pour être visibles au microscope, mais identifiables lors de l'analyse chimique, du fait de leur très forte concentration en U, Th, Zr et Li. Toutes les analyses montrant des anomalies de ce type ont été éliminées.
La Fig. 3 montre la corrélation entre l'intensité de la luminescence (exprimée en %) et la concentration en Ce, U et Th pour l'ensemble des analyses. Le Ce ayant un contrôle important sur la luminescence des minéraux, la forte corrélation négative entre la concentration en Ce et l'intensité de la luminescence observée (Fig. 3a) indique que les variations de cette dernière sont directement liées à des variations chimiques entre les différentes zones des cristaux. La concentration en Th varie entre 20 et 110 ppm et la Fig. 3b montre une corrélation négative entre l'intensité de la luminescence et la teneur en Th. Les variations de la concentration en U sont plus faibles, de 10 à 33 ppm, et ne laissent apparaı̂tre qu'une corrélation faible, voire nulle, avec la luminescence (Fig. 3c).
4 Conclusion
L'hétérogénéité chimique dans les apatites est un problème de premier ordre pour l'analyse UTh/He. L'utilisation de la cathodoluminescence couplée à une analyse fine des concentrations en Ce, Th et en U dans les minéraux a mis en évidence une relation directe entre l'intensité de la luminescence et la concentration en Ce, Th et en U. L'intensité de la luminescence décroı̂t lorsque les concentrations en U et Th, qui varient en parallèle, augmentent. L'analyse LA–ICP–MS montre des variations importantes (de 1 à 6) des teneurs en Th entre les différentes zones de luminescence des cristaux d'apatite. La concentration en U semble plus constante, mais varie toutefois de 1 à 3. Les variations faibles de la concentration en U par rapport à celle en Th impliquent que la cartographie des traces de fission (qui ne montre que la répartition de l'U) n'est pas suffisante pour mettre en évidence les hétérogénéités de composition dans un cristal d'apatite.
L'analyse de l'hétérogénéité chimique des apatites constitue un préalable indispensable à toute étude thermochronologique par la méthode UTh/He. L'utilisation de la cathodoluminescence permet d'obtenir rapidement, et à un faible coût, des informations sur cette hétérogénéité. Si cette dernière est importante, une analyse par microsonde électronique de la répartition du Ce peut permettre d'obtenir des indications sur la répartition de l'U et du Th, puisque ces trois éléments se comportent de la même manière vis-à-vis du signal de cathodoluminescence. Il reste toutefois à confirmer que ce type d'étude est applicable à tous les types de zonation des apatites. En effet, la diminution de l'intensité de la cathodoluminescence peut être due, soit à l'incorporation de quantités importantes d'ions à large rayon (As, U, Th, etc.) (par exemple, [23]), soit, comme c'est le cas dans cette étude, à la destruction du réseau cristallin par les actinides (U et Th).