

Version française abrégée
L'ı̂le de Trizonia est localisée près de la côte nord du golfe de Corinthe, 5 à 10 km à l'aplomb des principales failles normales actives de pendage nord. Le taux de déformation et son gradient spatial y est maximal, d'après les mesures GPS. Grâce au soutien du projet CORSEIS de l'Union européenne, des mesures de déformation et d'inclinométrie ont pu débuter en octobre 2002 sur cette ı̂le, afin de mesurer des déformations transitoires liées à l'ouverture et à la sismicité du rift (Fig. 1). En particulier, elles visent à détecter d'éventuelles déformations asismiques liées aux fréquents essaims sismiques de la zone, dans un rayon de 20 km.
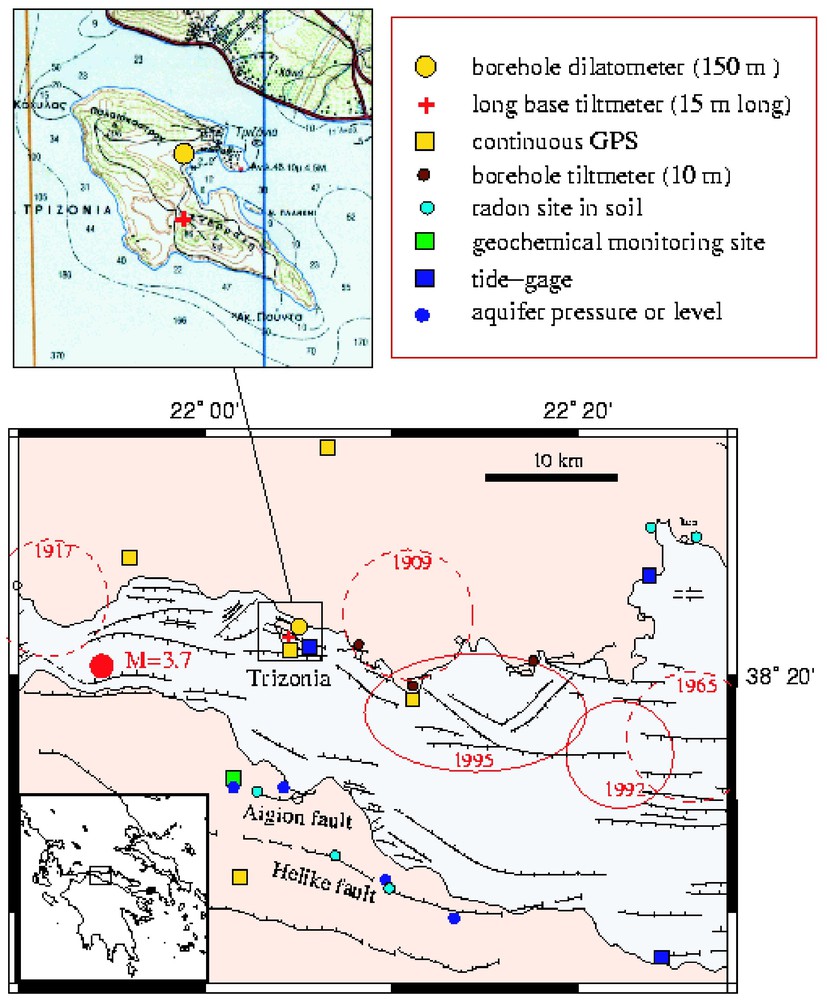
Geophysical and geochemical instrumentation of the western Rift of Corinth and of the Trizonia Island.
Instrumentation géophysique et géochimique de la partie ouest du rift de Corinthe et de l'ı̂le de Trizonia.
Quatre inclinomètres hydrostatiques, deux nord–sud et deux est–ouest, de 15 m de long, l'un rempli de mercure, l'autre d'eau, ont été construits par l'IPGP (Fig. 2) et installés en parallèle à 2,5 m sous terre dans deux tranchées perpendiculaires. Le niveau du liquide est mesuré par un flotteur en silice lié à un capteur de déplacement de type LVDT. Le système est posé sur une table de granite, elle-même solidaire d'une colonne de granite qui la porte, logée dans un forage de 1,5 m de profondeur, reposant à sa base sur la roche, et cimentée à celle-ci en partie basse.
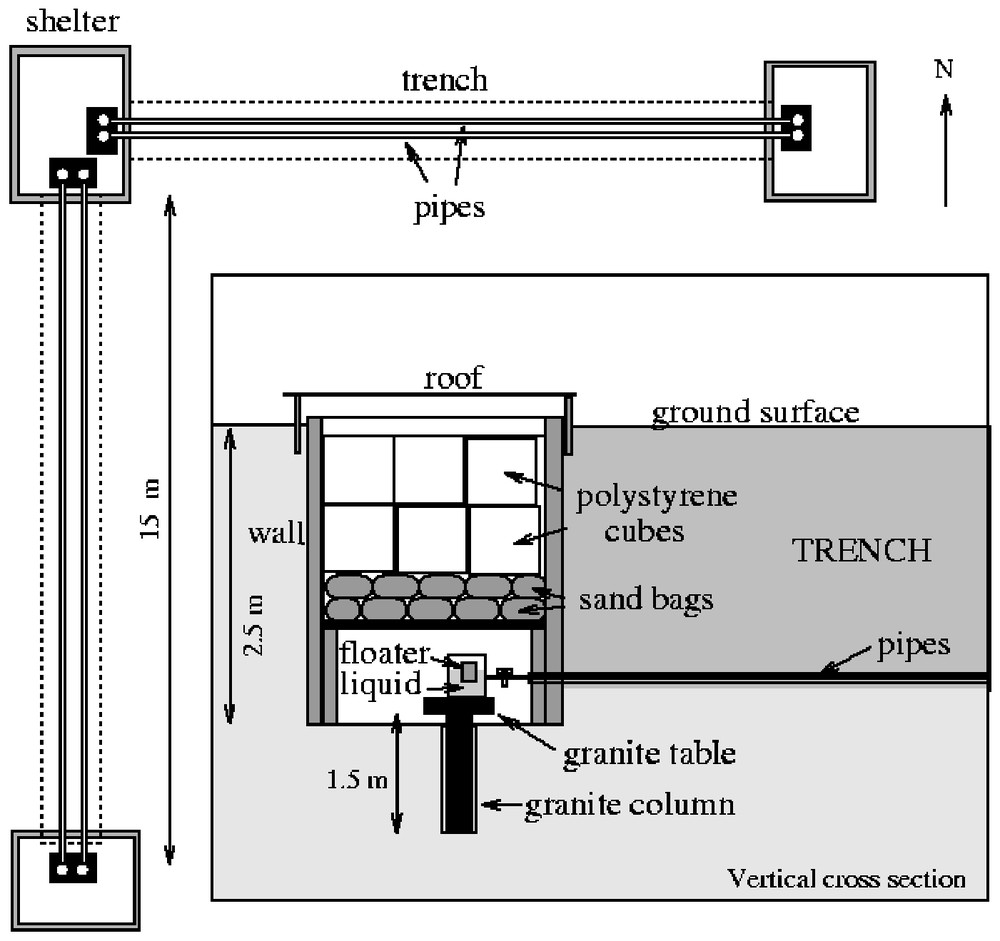
Map view and cross-section sketches of the Trizonia underground installation for the long-base hydrostatic tiltmeter (insert is a vertical cross-section).
Schéma en carte et en section verticale de l'installation inclinométrique longue base à Trizonia.
Le système fonctionne depuis octobre 2002. Des améliorations successives permettent d'avoir, depuis juin 2003, une résolution à courte période de quelques 10−9, pour le système à mercure, ce qui est exceptionnel pour un instrument à une si faible profondeur (Figs. 3 et 4). Il montre un signal de marée clair, cependant perturbé par les variations thermiques de longue période, ainsi que des effets de pression et de pluie. Ces effets sont en cours d'analyse, pour pouvoir être corrigés au mieux, grâce, pour certains, à leur influence différente sur l'eau et le mercure. Le stress thermique, de période 24 h, est notablement plus fort sur la composante nord–sud. Ces niveaux hydrostatiques sont complétés par des pendules horizontaux en silice de type Blum (résolution de quelques 10−8 à quelques 10−7 radians), fixés sur les tables de granite, et des mesures de température.
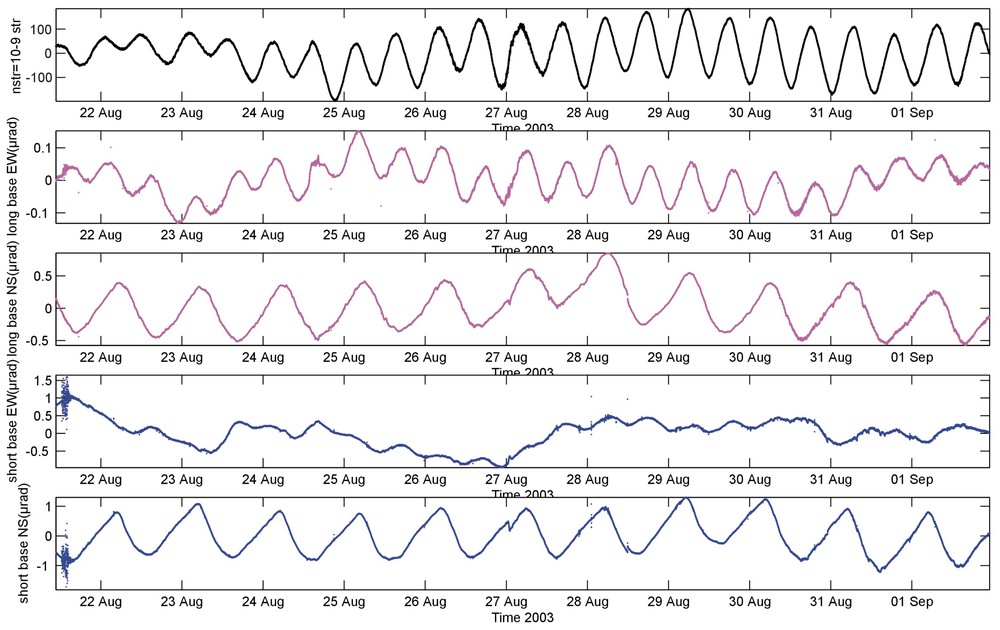
Unfiltered strain and tilt records in Trizonia. From top to bottom: borehole dilatometer; long base mercury east–west tiltmeter; long base mercury north–south tiltmeter; north–south silicon pendulum; east–west silicon pendulum.
Mesure de la marée en déformation et inclinométrie à Trizonia.
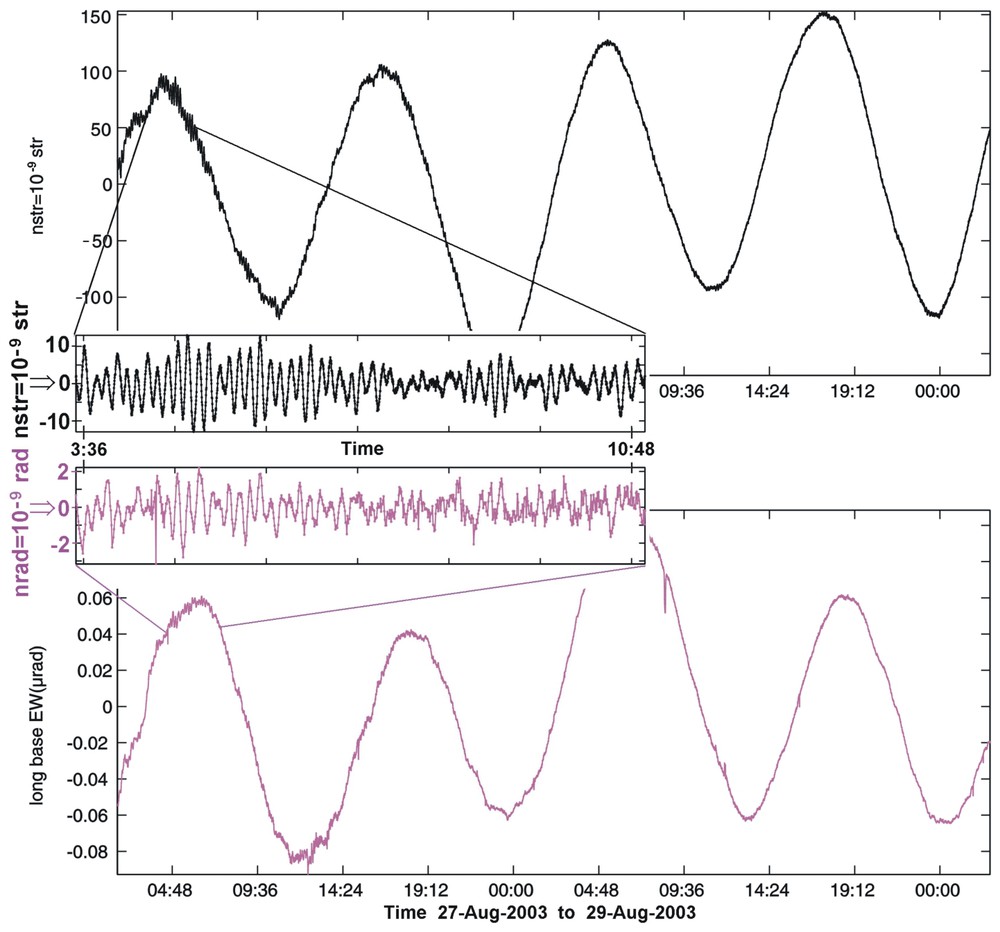
Unfiltered strain and tilt record in Trizonia. Top, borehole dilatometer; bottom, long-base east–west titlmeter. Inserts: zoom showing the free oscillation of the gulf, excited by wind.
Mesure de la marée et des seiches du golfe en déformation et inclinométrie à Trizonia.
Un kilomètre plus au sud, un dilatomètre de type Sacks–Evertson acquis par l'IPGP et fabriqué par la Carnegie Institution of Washington a été cimenté à 148 m de profondeur dans un forage. Il est en fonction depuis octobre 2002, et sa résolution est meilleure que 10−10 aux périodes inférieures à quelques heures. Les enregistrements continus à 5 Hz montrent les séismes, la marée marine et terrestre, ainsi que les seiches du golfe à environ 8 et 30 min, associés à 1 cm de battement de niveau d'eau (Fig. 4). Les « dilatogrammes » des séismes locaux, régionaux, ou mondiaux, sont aussi visibles sur les enregistrements à 50 Hz du canal déclenché sur événement.
L'analyse des dix premiers mois d'enregistrements montre un signal anormal largement dominant, le 3 décembre 2002, d'amplitude 10−7, durant une heure, dont le maximum coı̈ncide, à quelques secondes près, avec un séisme de magnitude M=3,7, localisé 15 km plus à l'ouest et à 8 km de profondeur (Figs. 1, 5 et 6). Si les deux événements sont physiquement liés, la magnitude de moment équivalente de la source de déformation lente est estimée à 5±0,5.
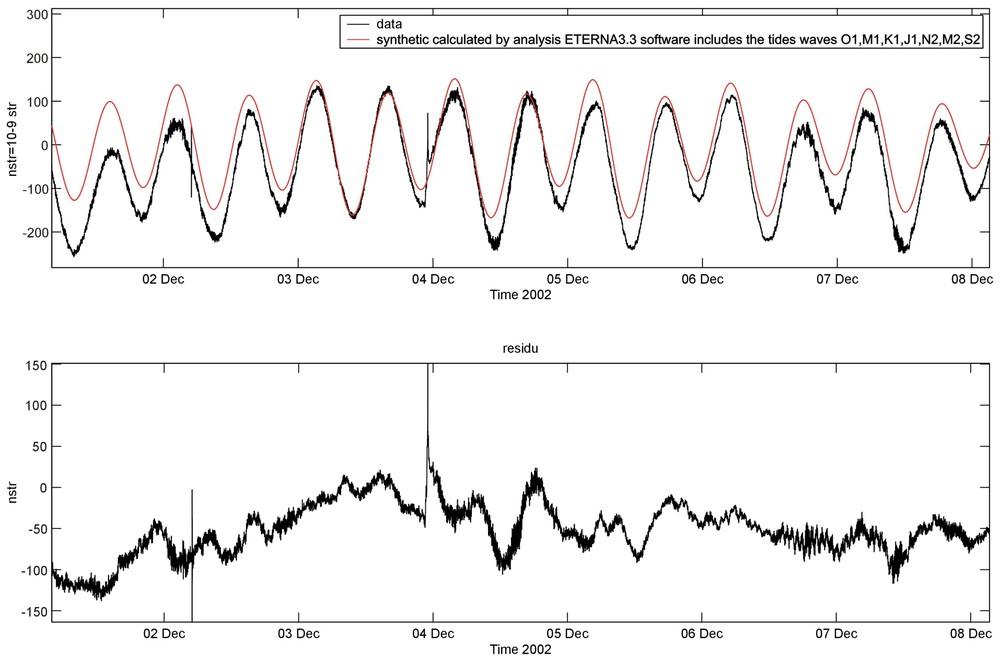
Top: dilatometer record (black) and adjusted tidal waves (grey). Bottom: residual between both. Note the 3 December 2002 spike (see Section 5) and the associated strain step, lasting at least a few hours. The large peak of 2 December is due to the seismic waves of the Vartholomio earthquake, M=5.8, located 100 km SSW.
Déformation transitoire du 3 décembre 2002.
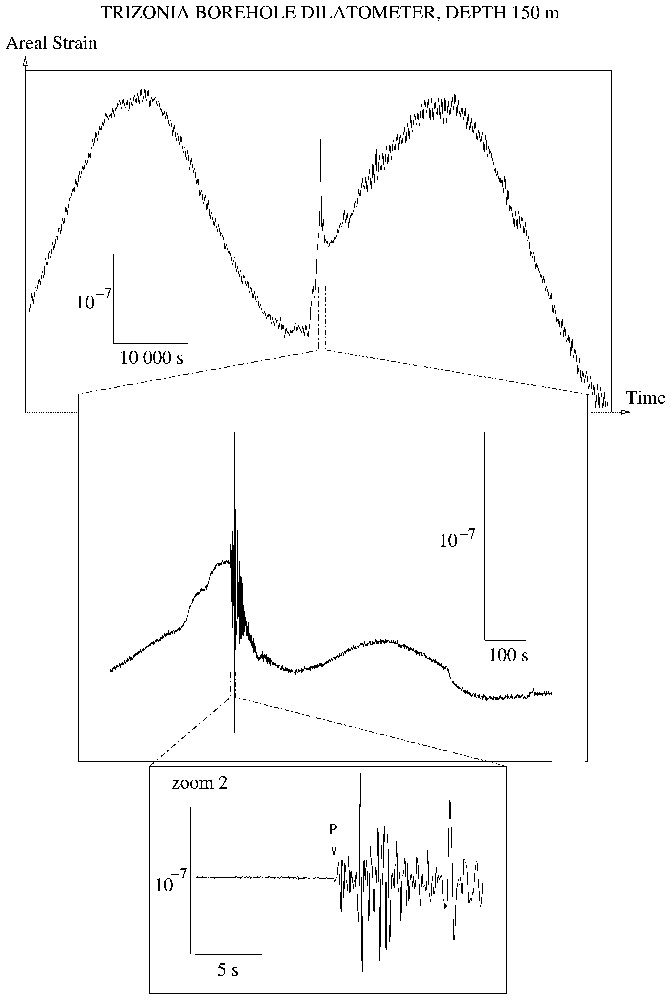
Details of the strain transient of 3 December 2002. Successive zooms show the seismic waves produced by a local M=3.7 earthquake (see Fig. 1). The short period noise is due to the free oscillations of the gulf.
Détails de la déformation transitoire du 3 décembre 2002.
1 Introduction
The existence of transient instabilities in the crust, their scaling characteristics, and their coupling to seismic activity is one of the challenging question concerning the mechanics of faults in the upper crust, with a clear connection to the problem of earthquake predictability [1]. Laboratory experiments and fault mechanics theories based on slip- or velocity-dependent friction laws [4] have clearly shown that the seismic instability nucleates after some long-lasting, slowly accelerating aseismic slip on a fault patch. This unstable patch may also increase in size during this nucleation phase [10]. At the field scale, the observation of some foreshocks sequences similarly suggests the existence of large aseismic slip on fault patches near the hypocenter of large earthquakes [6]. However, the value of the critical slip before instability observed in laboratory experiments is much smaller than the one deduced from seismological observations, which introduces the controversial question of scaling in friction laws [8]. Aseismic slip on faults is also commonly observed on creeping segments of major strike-slip systems like the San Andreas or the North-Anatolian fault, and direct observations of creep transients related to earthquake activity have been reported [7,9]. Another class of well-known transients are earthquake swarms, still poorly understood, which may be interpreted as being triggered by silent earthquakes, or by rapid fluid migration and hydrofracturation between reservoirs at different pressures [5,6].
Any progress in understanding such transient events and the triggering of earthquake requests much more detailed observations than what is currently available, with in particular the continuous measurement of strain in seismically active regions. The weakness of the strain signal at the surface expected for most transients at depth requests an instrumental resolution much better than 10−7. This is clearly out of reach of GPS or InSAR techniques, and demands high-resolution stainmeter or tiltmeter installation underground for reducing the influence of meteorogical and anthropic sources.
This motivated the installation of such instruments in the Rift of Corinth, in complement to the other geophysical arrays installed within the Corinth Rift Laboratory (CRL) project. We present in this paper the instrumental characteristics and first results of the tiltmeters and strainmeter installed in 2002.
2 Site selection: The Trizonia Island
The Trizonia Island is located 10 km north to Aigion, close to the northern coast of the Gulf (Fig. 1). It has been selected for the installation of a high-resolution strain and tilt observatory, for several reasons.
- (1) Its location above the deepest part of the major north-dipping normal faults (Aigion Fault and offshore fault) is favourable for the detection of aseismic slip transients near the nucleation spots of future large ruptures.
- (2) It is located 10 km west to the end of the 1995 rupture for the Aigion earthquake, thus in a recently stressed area.
- (3) It is located near the centre of the CRL seismological monitoring arrays.
- (4) Hard Mesozoic limestone is outcropping on the island.
- (5) There is no strong topography that could perturb the stress field.
- (6) The low height above sea level prevents large underground water flow and their associated perturbations.
The instruments in Trizonia are:
- (1) a Sacks–Evertson strainmeter, installed in June 2002 at a depth of 145 m in a borehole;
- (2) four 15 m-long hydrostatic tiltmeters (north–south and east–west), manufactured at IPGP, installed in a shelter at a depth of 2.5 m, in June 2002.
3 Tiltmeter
3.1 Performance of the IPGP hydrostatic long-base tiltmeter
In a previous project (the EU GAIA project, [2]), five tiltmeters based on Applied Geomechanics air bubble level systems were installed in boreholes at a depth of 10 m in a hard limestone, and several silicon pendulums were installed in a natural cave, near the village of Galaxidi, on the northern coast of the Rift of Corinth. However, the noise level of these instruments happened to be quite high, in the order of several 10−8 to several 10−7 at short period (minutes to hours), even larger at longer period, and the earth and sea tide effects were detected only during the intermittent low-environmental-noise conditions.
This motivated the development of a long-base hydrostatic tiltmeter, with higher resolution and possibly lower sensitivity to meteorological noise. The first prototypes were constructed in 1998 at IPGP [3]. The originality of the system is the use of silicon elements (reservoir, floater, suspension) for reducing the sensitivity to temperature, and the use of two tiltmeters in parallel, with two fluids with different thermal coefficient to separate thermal effects from true tilt ones.
Many tests were carried out, on the stability and temperature sensitivity of the displacement sensor (LVDT), and on the evaporation of water through an oil layer. A first installation, 10 m long, was done underground in the Astrophysics Laboratory, ‘Observatoire de Paris’. The depth was 30 m, the diurnal change in temperature 0.01 °C. We obtained a very good record of the earth tide, after filtering out the short period urban noise. The resolution was better than 10−9 radians at the tide period.
3.2 Trizonia installation
In Trizonia, the selected site is in a 20 m×20 m area with a horizontal ground surface, near the centre of the island, 1 km south from the harbour, at the altitude of 38 m (Fig. 1, red cross). Two 15 m-long and 2.5 m-deep perpendicular trenches were excavated (Fig. 2). They are oriented north–south and east–west, and have a common northwestern end. At their ends, three underground shelters have been built: south (S), east (E), and northwest (NW).
In both trenches, a horizontal PVC tube 10 cm in diameter has been buried. The tubes are horizontal within a few centimetres over the trench length. At the bottom of each shelter, vertical holes have been drilled, for the installation of granite columns (20 cm×20 cm, 1.5 to 1.8 m long), which were cemented in their lower part. In shelter S, the hard limestone is reached at 2.5 m. In shelter NW, it is at 2 m. In both shelters S and NW, the granite column is 1.5 m high, thus within firm rock. In shelter E, the hard limestone has not been found, and the column is 1.8 m long, anchored in a slightly weaker rock layer.
These granite columns support granite tables, tightly bolted to them. These tables are used for the installation of the instruments. Two tables are placed in the northern shelter, one for each direction. Each granite table supports two containers with the silicon floating/displacement sensor device, one for the water system, the other for the mercury. An oil layer (4 mm) is covering the water and the mercury in the containers to prevent evaporation. Two silicon pendulums (Blum type), oriented east and north, are fixed to each granite table, with a free oscillation of about 11 s. They are used for the control of the column/table stability, and provide an independent measurement of ground tilt. Temperature is measured in the shelter, and in the ground at the bottom of the granite column.
Each PVC tube in the filled trenches contains: a Teflon tube filled with water, a glass tube (in 1 m-long pieces, connected through articulated, air-tight glass joints) filled with mercury, two air-filled Teflon tubes (for pressure equilibrium of the hydrostatic levels), and all electrical cables for power and signal, collected in the northwestern shelter. The mercury and water tubes, within 1 cm from each other, are thus subject to identical temperature changes, if any. The mercury- or air-filled tubes are connected to the containers on the granite tables. In order to avoid flooding during storms, two drains have been installed in October 2003, in addition to the automatic electrical water pumps at the bottom of each shelter, installed in February 2003.
The instruments are protected against atmospheric perturbations, from bottom to top, by a steel plate, a layer of sand bags, a layer of polystyrene cubes, a plastic sheet, and a low metallic roof. The shelter for the loggers is 3 m away from the northwestern shelter, with power and phone line. It is used also for the continuous GPS and for the CRL seismometer of Trizonia. The logger is 20 bits with 32 channels: 8 channels are used for the water-tube tiltmeter (2 channels per tiltmeter, 2 double tiltmeters), 8 for silicon tiltmeters (east and north on each table), 16 for temperature measurements (shelter and ground). The data are sampled at 1 pt per 30 s. Atmospheric pressure is measured in the rift 10 km away. Rain and wind will be measured at the site in a near future.
The hydrostatic tiltmeter became operational in November 2002, with a short-term resolution of a few 10−8, which we improved, for the mercury tiltmeter, to a few 10−9 in June 2003. The mercury system thus clearly resolves the earth tidal tilt, of the order of 10−7 radians (Fig. 3), and detects the short-period (10 to 30 min) free oscillations of the gulf (Fig. 4). However, the dominant signal on the north–south component has a 24 h period, also recorded on the north–south Blum type pendulum. Such a signal barely appears on the east–west records of the same instruments, dominated by the earth and sea tide. We interpret this north–south signal as a thermostress effect, tilting the whole measurement site with a regular, daily cycle.
4 Dilatometer
A Sacks–Evertson borehole dilatometer has been manufactured by the Carnegie Institution of Washington [11]. Its nominal resolution is about 10−11 in strain. The instrument is about 3.5 m long and 8 cm in diameter. A 165 m-deep borehole has been drilled 50 cm above the sea level, 20 m WNW from the northwestern edge of the Trizonia main harbour. The casing was down to 138 m. In a first step, on 15 June 2002, the instrument was only partially cemented at a depth of 146 m, due to technical problems. A second load of cement was sent down on 15 October 2002, for achieving the complete coupling of the whole sensor to the borehole wall.
The dilatometer has two signal outputs. One is the high-sensitivity channel, integrating the volumetric change in the whole oil reservoir; the other is a lower sensitivity channel, with a smaller hydro-mechanical amplification, and which is usually disconnected from the strained part of the instrument, except when the instrument is triggered by a rapid and strong strain change. Thus, in normal situation, the second channel measures the pressure in a closed cell, proportional to the local temperature. In high-strain conditions, the hydraulic input for the high-sensitivity channel automatically and immediately stops, and the low sensitivity channel provides the strain signal. A third channel is the air pressure, associated with the electronic control box at the surface.
The signals are continuously recorded on a 24 bits Reftek station. High- and low-sensitivity strains are sampled at 5 Hz. In addition, a trigger is added, which provides a 50 Hz record of the two strain channels during 30 s. Sea-tide is presently measured at the rate of 1 pt per 2 min. Sea tide measurement at 5 Hz on the Reftek is planned for spring 2004.
The records show a clear tidal effect, combination of earth and sea tide, with amplitude about 3×10⁻⁷, in agreement with theoretical values (Fig. 3, top). The sea tide has also high-frequency components, at about 8 min to 30 min period (Fig. 4, top), corresponding to the dominant free oscillations of the western part of the Gulf, with a 1 cm peak-to-peak sea level variation (pressure fluctuation of about 100 Pa). The residual noise level of the instrument is thus about 10 Pa, which corresponds roughly to 10−9 strain.
The stabilization phase of the instrument after the second load of cement (15 October 2002) is marked by the frequent occurrence of a strain signal with a characteristic shape, appearing as a short duration step followed by relaxation, lasting a few minutes, positive or negative, mostly with an amplitude of about 10−8 or less. Their number diminishes with time: 10 per week in November, 5 per week in December, and less than one per week in the first two months of 2003. None is reported afterwards. We interpret them as micrometric slip, or opening, on centimetric cracks in the cement or in the surrounding rock mass, due to the hardening of the cement, and/or the relaxation of the rock mass around the borehole.
5 Analysis of the compression signal of 3 December 2002
On 3 December 2003, a compression transient with an amplitude of 10−7 strain is recorded on the strainmeter, lasting about 1 h (Fig. 5, top). Its smooth increase (Fig. 6) makes it very different from the noises related to the cement hardening and borehole relaxation process. It reaches a peak at about UT, and then decreases and vanishes back in the tidal signal. The removal of the main tidal signal reveals the dominance of a compressive step (Fig. 5, bottom). At the maximum of the strain anomaly, the record shows the high-frequency strain waves of a local earthquake, and the strain starts decaying sharply immediately after the arrival of the P wave strain, within the coda. This earthquake is located 14 km west to the site ( UT, 38°20.42 N 21°53.79 E), at a depth of 8 km (catalogue of the University of Patras) (red dot in Fig. 1). It has reported magnitudes 3.7 (Patras) and 3.5 (Preliminary Determination of Epicenter, National Observatory of Athens), and is the largest event of a swarm that started on around 20 November and persisted in December (66 earthquakes with M>2 have been reported by the University of Patras, within 3 min of longitude and latitude). No other slow strain event was recorded during this period.
In order to test the hypothesis that the strain transient and the earthquake are associated, we looked for other records of this strain on other nearby instruments. On the Trizonia hydrostatic tiltmeter, at the time of the anomaly, nothing emerges out of the noise level which is a few 10−8 at 1 h period, except the tilt signal of the M=3.5 earthquake itself (Fig. 7). Note that this was short after the installation, before reaching the present resolution, ten times better. We also investigated the records of the CMG3 installed by the Charles University of Prague (J. Zahradnik, personal communication, 2003), but the noise level appeared to be 10−7. We also investigated the ground water level records on the southern coast (Leonardi et Gavrilenko, pers. comm., 2003), but they did not show any signal above their noise level of 10−8. Hence, in the absence of instruments with the appropriate resolution, we can neither contradict, nor definitely validate the hypothesis that the earthquake and the strain signal are related.
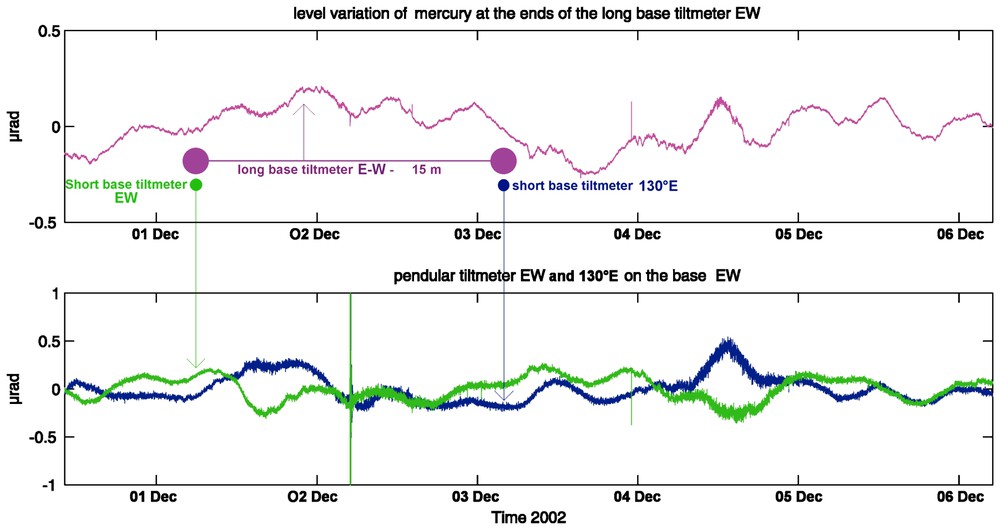
Tilt measurements for the 3 December 2002 transient. Top: variation of the mercury level on the east–west long-base tiltmeter. Bottom: east–west and N130E tilt on two silicon pendulums. No signal is detected near the time of the 3 December strain anomaly, at the resolution of a few 10−8, except the peak related to the waves of the M=3.7 earthquake. The other signal, on 2 December, is due to the seismic waves of the Vartholomio earthquake.
Mesures inclinométriques au moment du transitoire du 3 décembre 2002.
In the case when both events are related – which is not an unreasonable assumption, owing to the very small probability of the precise time coincidence of the events –, one can assume that they were close to each other, within a few kilometres, and hence estimate the total moment release M0 of the slow event. An estimate of the maximal deformation ε at a distance R for some fault slip is ε=1/(3πμ)M0R−3, where μ is the rigidity. Taking μ=3×10¹⁰ Pa and R=18 km provides M0=1.2×10¹⁷ N m, equivalent to a silent earthquake of moment magnitude 5.3. Note that the dilatation phase after the compression implies a change in the source mechanism. Hence, unidirectional aseismic slip on a single fault plane can be ruled out: Variations in slip direction on a single fault, a second activated fault, or some fluid migration, are requested to fit this observation. In case of aseismic slip on fault planes, assuming a maximal stress drop of 30 bar, the measured strain would imply a minimal fault length of 1 to a few km, and a maximal slip of a few tens of centimetres. In any case, the observed M=3.7 earthquake would not have contributed significantly to the moment of the slow transient. Interestingly, a second earthquake of magnitude 3.2 occurred 131 min after, less than 3 km away. Both events could thus be simply seen as aftershocks of the Mw=5±0.5 strain event.
6 Conclusion
The recently installed borehole dilatometer and mercury tiltmeters in the Trizonia Island record the earth and sea tides, and provide a continuous monitoring with resolution of a few 10−9, respectively, at short period. The analysis of a 10−8 compression signal on the dilatometer, lasting 1 h, on 3 December 2002, coincident with a 3.7-magnitude earthquake, suggests the occurrence of a slow transient source near the western end of the rift with a moment magnitude Mw=5±0.5. However, this observation shows that arrays of strainmeters, and not a single one as presently operating, are requested for unambiguously constraining the source of such events and for understanding their relationship with earthquake generation.
Acknowledgements
This work has been partially supported by the EU, DGXII Environment Program, Seismic Risk, CORSEIS project, contract EGV1-CT99-00002. We specially thank the Trizonia district and its inhabitants for their support to the project, and in particular for the use of land for the installations.