

Version française abrégée
Depuis 1990, un réseau GPS a été installé et progressivement étendu dans le golfe de Corinthe pour connaı̂tre précisément les déformations tectoniques dans ce rift. Ce réseau GPS s'insère dans des réseaux géodésiques installés à plus grande échelle [6,7] et densifie localement ces réseaux (Fig. 1) [5]. Les données GPS collectées lors de onze campagnes effectuées entre 1990 et 2001 ont été traitées de manière homogène à l'aide des logiciels GAMIT [11] et GLOBK [10]. De trois à onze stations GPS permanentes situées en Europe centrale et du Nord ont été utilisées afin de lier notre réseau à l'ITRF2000. Les séries temporelles de coordonnées, obtenues pour 57 points (Fig. 2), donnent une vision précise de la déformation à travers le rift, avec des incertitudes sur les vitesses inférieures à (Fig. 3). L'extension à travers le rift augmente d'est en ouest (Fig. 4). Elle passe de au niveau de Xilokastro à à l'ouest d'Aigion. La partie centrale du rift, en mer, absorbe la quasi-totalité de la déformation, dans une bande qui peut avoir moins de 10 km de large, ainsi que le montrent les vecteurs dans la région d'Aigion. Les blocs sud et nord sont affectés de mouvements de rotation rapides dans le sens horaire, que les résultats GPS permettent de quantifier précisément (Figs. 3 et 4). Dans le référentiel « Péloponnèse fixe », le premier (bloc sud) pivote de autour d'un pôle de rotation situé dans le golfe de Corinthe vers 38,28° N 22,19° E. Dans ce même référentiel, le second (bloc nord) pivote de autour d'un pôle de rotation situé vers 38,37° N 23,37° E. Par rapport à l'Europe fixe, ce même bloc pivote autour d'un pôle de rotation situé vers 39,25° N 20,92° E. Compte tenu du nombre de données utilisées et de leur précision, nos déterminations des pôles et vitesses de rotation sont plus précises que les estimations proposées précédemment [8,9,12,17]. Après avoir retiré les rotations, le bloc nord montre un taux d'extension nord–sud significatif, de l'ordre de (Fig. 5). En revanche, le bloc sud fait exception de la région de Psathopirgos, à l'extrémité ouest du rift, car il présente une déformation interne encore très faible par rapport à la barre d'erreur () (Fig. 5). Les taux de déformation y sont inférieurs à . Ceci implique, pour les failles bordières sud du golfe de Corinthe, des temps de chargement et de récurrence longs (500–1000 ans) pour les séismes de magnitude 6,5 à 7 s'y produisant.
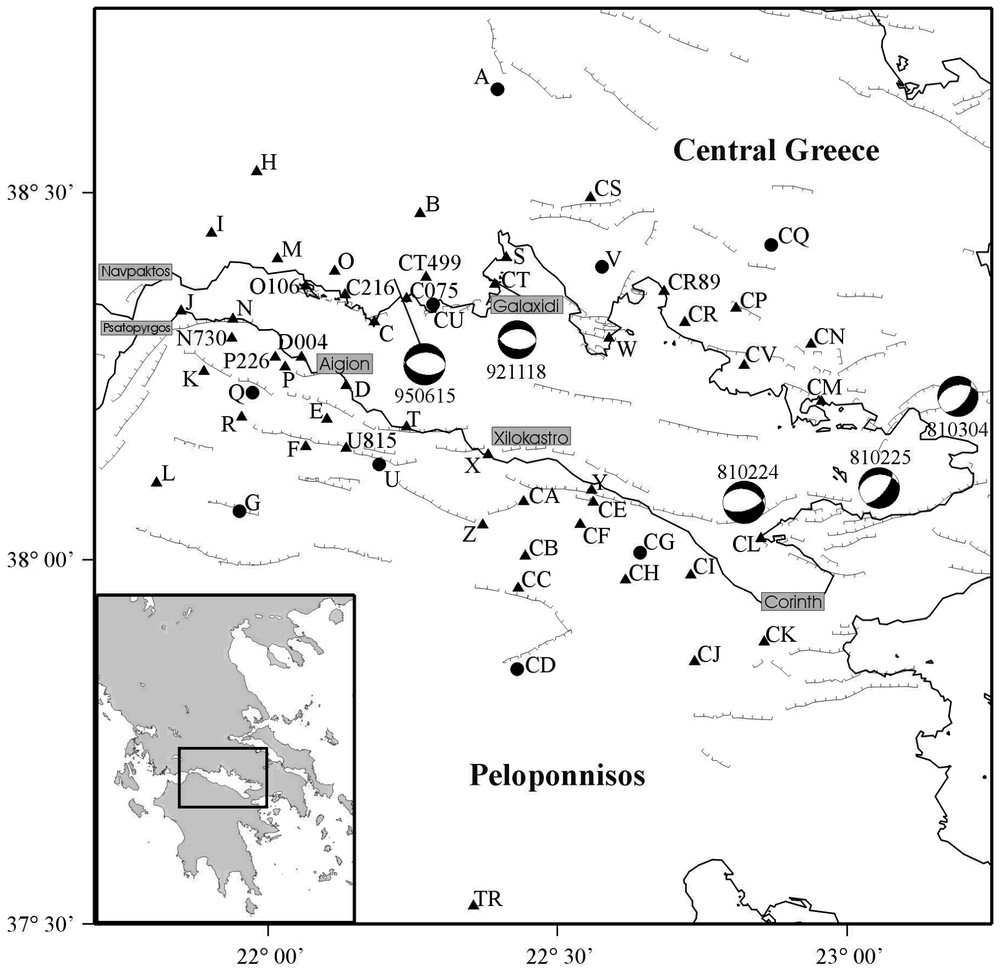
The Corinth Rift GPS core network [5]. Dots also belong to the ‘Central-Greece’ network [6]. Segmented lines are the main active faults. Epicentre locations and focal mechanisms of the major recent earthquakes are drawn.
Le réseau GPS de premier ordre du rift de Corinthe [5]. Les points ronds appartiennent aussi au réseau « Grèce centrale » [6]. Les traits segmentés sont les failles actives majeures. L'emplacement des hypocentres et les mécanismes au foyer des plus gros séismes récents sont indiqués.
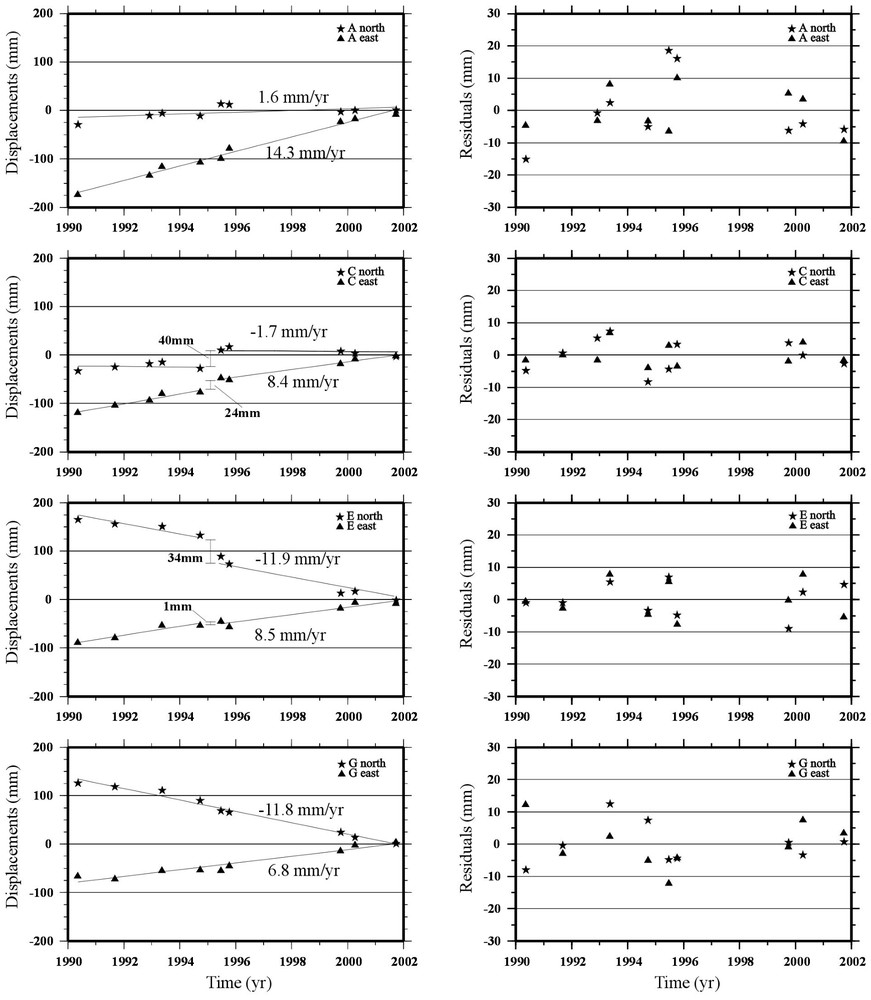
(Left) Temporal change of the ITRF2000 coordinates of points A, C, E, and G. The velocity is estimated by least squares adjustment of the time series. For C and E, located close to the 1995 epicentre, a co-seismic offset has been estimated in addition to the velocity assumed unchanged after the earthquake. The same procedure was applied to estimate the velocity of all points and, when appropriate, the 1995 co-seismic displacements. (Right) Residuals after velocities and co-seismic offsets have been removed.
(Gauche) Variation temporelle des coordonnées, exprimées dans l'ITRF2000, des points A, C, E et G. La vitesse est estimée par un ajustement par moindres carrés des séries temporelles. Pour les points C et E, situés près de l'épicentre du séisme de 1995, un décalage co-sismique a été estimé. La vitesse a été supposée inchangée après le séisme. La même procédure a été appliquée pour déterminer la vitesse de tous les points et, lorsque c'était nécessaire, les déplacements co-sismiques de 1995. (Droite) Résidus après soustraction des vitesses et des décalages co-sismiques.
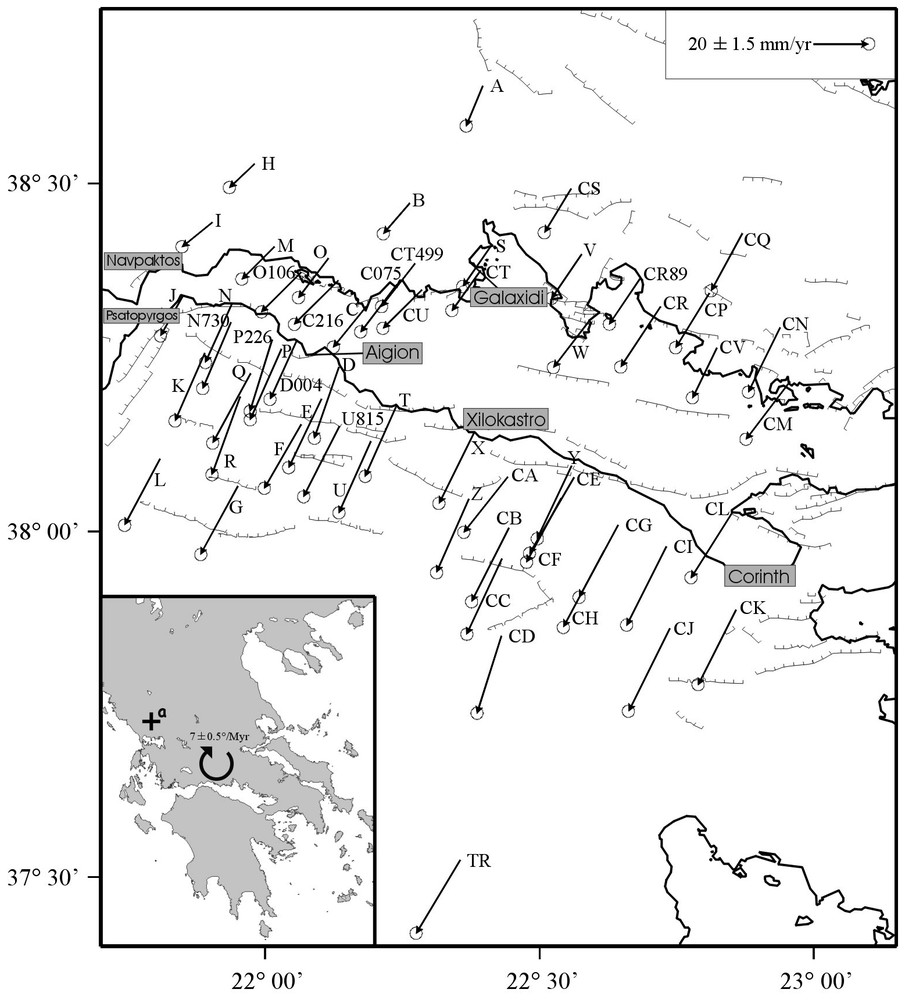
Velocities deduced from the 11 GPS surveys carried out between 1990 and 2001 plotted in a ‘fixed-Europe’ reference frame [15]. The pole of rotation of the Central Greece block with respect to ‘fixed Europe’ is shown in inset. Its coordinates and rotation rate are in Table 3.
Vitesses déduites des 11 campagnes GPS organisées entre 1990 et 2001. Le champ de vitesse est tracé dans un référentiel Europe fixe [15]. Le pôle de rotation du bloc de la Grèce centrale est montré en insert. Les coordonnées et la vitesse de rotation de ce pôle sont indiquées sur le Tableau 3.
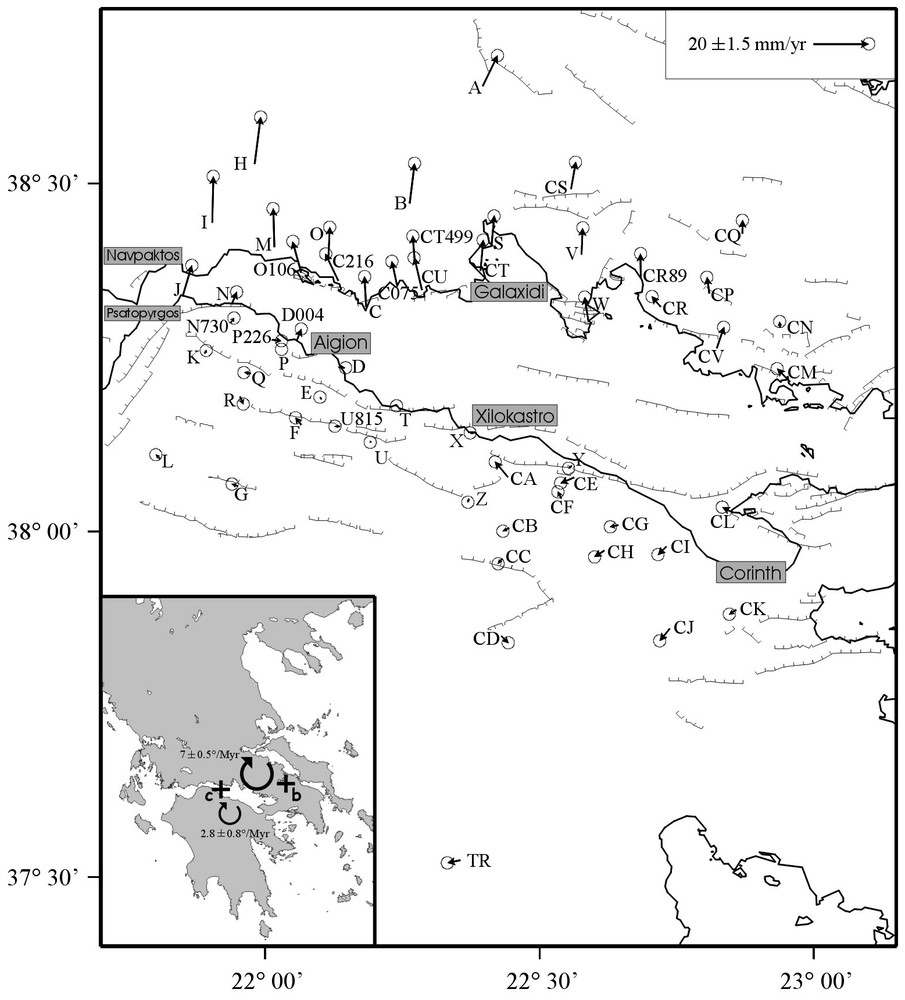
Same as Fig. 3, but the vectors are in a ‘Peloponnisos-fixed’ reference frame defined by minimising the velocities of the points located in Peloponnesos. The poles of rotation of the northern and southern blocks in this reference frame are shown in inset. Their coordinates and rotation rates are in Table 3.
Le champ de vitesse est défini dans un référentiel « Péloponnèse fixe », défini par la minimisation des vitesses des points situés dans le bloc sud. Les pôles de rotation des blocs nord et sud dans ce référentiel sont montrés en insert. Les coordonnées et les vitesses de rotation des ces pôles sont indiquées dans le Tableau 3.
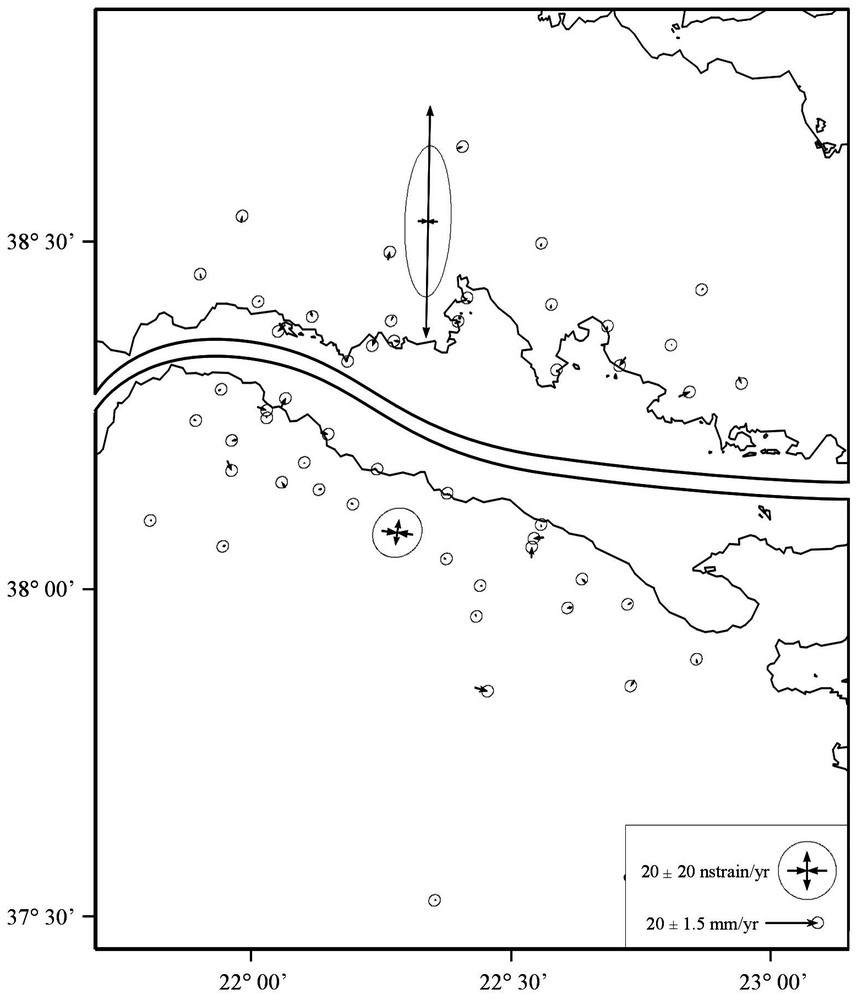
Residual velocities after removing the block rotations (each side of the rift must be seen independently). A small north–south extension () exists inside the northern block.
Vitesses résiduelles obtenues après avoir retiré les rotations des blocs (chaque côté du rift doit être considéré indépendamment). On observe une faible, mais significative, extension nord–sud () à l'intérieur du bloc nord.
1 Corinth Rift Laboratory GPS network
The Corinth Rift is one of the most seismically active areas in Europe. Several detailed studies of this asymmetric graben have been carried out combining tectonic, geodetic and seismological approaches (e.g., [2,5,16,17]). The main active structures of the rift are north-dipping faults, some clearly visible along the southern coast of the Gulf of Corinth, the rest located offshore in the central part of the rift. Several large earthquakes occurred in the Gulf of Corinth in the historical times and four earthquakes of magnitude larger than 6 occurred during the 20th century. The first geodetic results recognising the Gulf of Corinth as an area with unusually high strain rate were based on the comparison of GPS data with classical geodetic ones collected one century earlier [4]. The Corinth Rift GPS network is part of a large GPS network set up in Greece by several research teams [5–7]. It includes approximately 50 first-order points [5] measured at least three times (four hours sessions or more) in a given campaign. In addition, the network includes approximately 150 second-order points measured typically one or two times during two hours in at least one campaign. It covers about 100×80 km2, which corresponds to an average density of 1 point per 5 km2, allowing a rather good sampling of the main active faults. The ‘core network’ (Fig. 1) includes the first-order points as well as the second-order points observed at least twice during the eleven field surveys.
2 Data and data processing
Eleven GPS campaigns were carried out from 1990 to 2001. Two of them (November 1992 and June 1995) took place after the Ms=5.9, 18 November 1992, Galaxidi and the Ms=6.2, 15 June 1995, Aigion earthquakes. All data were processed using the version 10.0 of the GAMIT software [11] and the same processing strategies. We used IGS (International GPS Service) precise orbits and the GPS data from three to eleven surrounding IGS stations (Table 1) to tie our network to ITRF2000 (International Terrestrial Reference Frame) [1]. No ambiguity fixing was allowed for baselines longer than 100 km, in other words between points in the network and the IGS sites. The average percentage of ambiguities fixed in the network is ∼85%. The coordinates for each single campaign were obtained by combining the daily solutions using version 10.0 of the GLOBK/GLORG software [10]. In order to achieve this, a 7-parameter Helmert transformation was applied and its parameters were estimated using the subset of IGS stations included in the computations. Since the IGS stations are well defined in the ITRF2000, these parameters were used for the combinations of the daily solutions. Given the size of the network, the main sources of errors in our final results are the centring of the antennas for the horizontal components, and the antenna heights and troposphere modelling for the vertical component. Only the horizontal solutions are reported here. Fig. 2 (left) shows the time series of the coordinates obtained at four points. Points A and G, located away from the main active faults (Fig. 1), are not affected by the 1995 earthquake. The absolute velocity of those points is the slope of the coordinates time series obtained by least-squares adjustment. For those and the other points located away from the 1995 epicentre, this method was found to provide a more realistic uncertainty estimation than the one based on the use of both GAMIT [11] and GLOBK [10]. Fig. 2 (right) shows the residuals after removing the absolute velocity. The averaged uncertainties of the velocity vectors for the whole set of points provide a global estimate of the accuracy of the solution, which is of the order of . The spatial consistency of the velocity field (analysed in the following sections) supports this figure.
IGS stations used to tie the network to ITRF2000
Stations IGS utilisées pour connecter le réseau à l'ITRF2000
| Site | Long. | Lat. | Time Interval |
| (deg.) | (deg.) | (yr) | |
| ANKR | 32.76 | 39.89 | 1995–2001 |
| GRAZ | 47.07 | 15.49 | 1992–2001 |
| JOZE | 52.10 | 21.03 | 1994–2001 |
| KOSG | 52.18 | 05.81 | 1992–2001 |
| MATE | 16.70 | 40.65 | 1992–2001 |
| METS | 60.22 | 24.40 | 1992–1997 |
| NICO | 33.40 | 35.14 | 1999–2001 |
| ONSA | 57.40 | 11.93 | 1991–2001 |
| PENC | 19.28 | 47.60 | 1999–2001 |
| SOFI | 23.40 | 42.56 | 1999–2001 |
| ZIMM | 07.47 | 46.88 | 1994–2001 |
3 Co-seismic deformation
Points C and E are located close to the epicentre of the 15 June 1995, Aigion earthquake (Fig. 1). Their time series (Fig. 2, left) indicate an offset at that epoch. For those and 15 other points located close to the epicentre, a co-seismic offset was estimated together with the absolute velocity. In combination with seismic and tectonic data those co-seismic movements were used to infer the location and characteristics of the fault of the 1995 earthquake [3,5]. The best fitting model is a relatively low-angle north-dipping fault (dip ∼35°) located in the central part of the rift, approximately 3 km north of the Aigion Fault between 3 and 9 km depth. The moderate co-seismic deformation measured at point D and other points along the southern coast of the Gulf near Aigion are the prominent data constraining the upper limit of the rupture at a depth of ∼3 km. This showed that the uppermost part of the crust inside the Gulf of Corinth did not rupture during this event and might therefore behave not in a brittle-elastic manner, but rather as a plastic material deforming continuously [5].
4 ‘Long-term’ deformation
We call ‘long-term’ deformation the velocity field remaining after removing the offset produced by the 1995 earthquake at the sites where this offset is observed (thus larger than ∼5 mm). Since the time window of our observations is much shorter than the recurrence time of large earthquakes in the Gulf of Corinth, the present solution might be considered not quite representative of the long term. However, the consistency between our velocity field and that found over 100 years [3] and the absence of significant change in the slopes of the coordinates time series before and after the 1995 earthquake support the assumption of a stationary velocity field. The velocities (Fig. 3, Table 2) are expressed in the ‘fixed Europe’ reference frame defined by Nocquet et al. [15] (i.e., after removing from the absolute velocities of our points the theoretical velocity of Europe with respect to the ITRF). North of the gulf, and from west to east, the gradually increasing velocities indicate a clockwise rotation of this domain. The location of the pole of rotation, obtained by a least squares adjustment, is shown in the inset of Fig. 3. Nevertheless, the main velocity gradient is the extension across the Gulf of Corinth. This is more clearly depicted in a ‘Peloponnisos-fixed’ reference frame (Fig. 4), which is defined by minimising the velocities in Peloponnisos. The extension of the rift of Corinth is located almost entirely offshore and increases from east to west. The extension rate estimated here is not significantly different from the one found in previous works [5,6], but it is better resolved, due to the larger amount of data, the longer time interval of GPS observations, and the homogeneous data processing. A moderate clockwise rotation of Peloponnisos is observed. The corresponding pole of rotation is shown in the inset in Fig. 4 as well as the pole of rotation of the northern side of the gulf with respect to the Peloponnisos. Fig. 5 shows the residual vectors after the offshore extension across the rift and after the block rotations have been removed. For each side of the gulf, the residual vectors contain a possible signal of internal deformation, discussed in the next section, plus a noise corresponding to the errors in the observations. The average estimation of the r.m.s. error for the velocity vectors, obtained from the temporal analysis, is confirmed by the low value of the residuals and their spatial consistency. In the Peloponnisos, except of point CA, which is probably affected by a landslide and points J and N discussed later, all other points behave in a very consistent way.
Approximate coordinates, observations interval, velocities and formal uncertainties of the GPS points of the Corinth Rift network. The velocities are expressed in the ‘fixed-Europe’ reference frame [15]. Uncertainties are estimated using the average scatter of the residuals of a linear regression. They are estimated only for points observed at least three times. For the points near the 1995 epicentre uncertainties are estimated only when at least three epochs of observations exist before or after the event
Cordonnées approchées, intervalles d'observations, vitesses et incertitudes des points GPS du réseau du rift de Corinthe. Les vitesses sont exprimées dans le référentiel « Europe fixe » [15]. Les incertitudes sont estimées en utilisant l'écart moyen entre les coordonnées et la régression linéaire. Ces mêmes incertitudes sont estimées seulement pour les points mesurés au moins 3 fois. Pour les points situés près de la région épicentrale du tremblement de terre de 1995, elles sont estimées seulement quand au moins trois époques d'observations existent avant ou après le séisme
| Site | Long. | Lat. | No. a | Time interval | ||||
| (deg.) | (deg.) | (yr) | () | () | () | () | ||
| A | 22.40 | 38.64 | 9 | 1990–2001 | −4.7 | −11.6 | 0.7 | 1.0 |
| B | 22.26 | 38.47 | 9 | 1990–2001 | −8.2 | −8.0 | 1.6 | 2.1 |
| C | 22.18 | 38.32 | 10 | 1990–2001 | −10.6 | −11.7 | 1.6 | 2.4 |
| C216 | 22.13 | 38.36 | 3 | 1991–2001 | −14.7 | −12.8 | – | – |
| C075 | 22.24 | 38.36 | 4 | 1991–2001 | −11.8 | −14.2 | 3.0 | 1.2 |
| CA | 22.44 | 38.08 | 3 | 1993–2001 | −14.6 | −17.1 | 0.3 | 1.5 |
| CB | 22.44 | 38.01 | 2 | 1993–2001 | −12.2 | −23.7 | 1.3 | 0.8 |
| CC | 22.43 | 37.96 | 3 | 1993–2001 | −11.5 | −24.4 | 0.1 | 0.5 |
| CD | 22.43 | 37.85 | 4 | 1992–1995 | −7.5 | −25.1 | 3.9 | 1.3 |
| CE | 22.56 | 38.08 | 3 | 1993–2001 | −14.8 | −24.7 | 2.5 | 0.3 |
| CF | 22.54 | 38.05 | 2 | 1993–2001 | −11.2 | −20.1 | 0.1 | 0.9 |
| CG | 22.64 | 38.01 | 3 | 1993–1997 | −12.8 | −23.2 | 1.0 | 1.3 |
| CH | 22.62 | 37.97 | 5 | 1993–2001 | −13.5 | −24.8 | 1.5 | 0.8 |
| CI | 22.73 | 37.98 | 2 | 1993–1995 | −13.0 | −25.6 | – | – |
| CJ | 22.73 | 37.86 | 2 | 1993–1995 | −13.6 | −27.1 | – | – |
| CK | 22.86 | 37.89 | 3 | 1993–1997 | −12.4 | −24.2 | 0.2 | 0.2 |
| CL | 22.85 | 38.03 | 2 | 1993–1995 | −13.7 | −20.8 | – | – |
| CM | 22.96 | 38.22 | 3 | 1993–1997 | −14.6 | −17.9 | 1.7 | 0.6 |
| CN | 22.94 | 38.29 | 3 | 1993–1997 | −10.2 | −20.5 | 4.7 | 0.3 |
| CP | 22.81 | 38.34 | 5 | 1993–2001 | −10.8 | −16.7 | 1.0 | 1.4 |
| CQ | 22.87 | 38.43 | 5 | 1993–2001 | −9.9 | −17.7 | 0.5 | 0.8 |
| CR | 22.72 | 38.32 | 2 | 1993–1995 | −13.1 | −18.9 | – | – |
| CR89 | 22.68 | 38.37 | 2 | 1993–2001 | −10.1 | −13.9 | – | – |
| CS | 22.56 | 38.49 | 4 | 1993–2001 | −8.3 | −12.9 | 0.1 | 0.5 |
| CT | 22.39 | 38.38 | 8 | 1992–2001 | −9.0 | −11.5 | 1.7 | 6.1 |
| CT499 | 22.27 | 38.39 | 3 | 1993–2001 | −10.8 | −12.5 | – | – |
| CU | 22.28 | 38.35 | 5 | 1992–2001 | −12.7 | −10.9 | 5.7 | 4.1 |
| CV | 22.82 | 38.26 | 2 | 1993–1995 | −7.4 | −15.1 | – | – |
| D | 22.13 | 38.24 | 10 | 1990–2001 | −7.6 | −22.9 | 2.6 | 2.2 |
| D004 | 22.06 | 38.28 | 4 | 1993–2001 | −8.4 | −18.6 | 2.6 | 5.8 |
| DION | 23.93 | 38.08 | 5 | 1995–2001 | −11.8 | −25.5 | 0.3 | 1.9 |
| E | 22.10 | 38.19 | 10 | 1990–2001 | −10.5 | −21.9 | 2.4 | 1.9 |
| F | 22.07 | 38.15 | 7 | 1990–2001 | −12.0 | −20.1 | 0.9 | 1.9 |
| G | 21.95 | 38.07 | 10 | 1990–2001 | −12.2 | −21.8 | 0.7 | 0.6 |
| H | 21.98 | 38.53 | 3 | 1991–2001 | −7.8 | −5.6 | 1.2 | 1.5 |
| I | 21.90 | 38.44 | 5 | 1991–2001 | −9.6 | −5.8 | 1.5 | 1.1 |
| J | 21.85 | 38.34 | 3 | 1991–2001 | −6.7 | −11.4 | 1.6 | 1.5 |
| K | 21.89 | 38.26 | 5 | 1991–2001 | −9.4 | −21.6 | 2.1 | 1.3 |
| L | 21.81 | 38.10 | 3 | 1991–2001 | −11.5 | −21.0 | 0.4 | 0.3 |
| M | 22.02 | 38.41 | 4 | 1991–2001 | −10.4 | −8.7 | 0.8 | 4.5 |
| N | 21.94 | 38.33 | 4 | 1991–2001 | −8.3 | −18.2 | 0.1 | 0.2 |
| N730 | 21.94 | 38.30 | 2 | 1991–2001 | −8.9 | −21.1 | – | – |
| O | 22.11 | 38.39 | 3 | 1991–2001 | −9.5 | −11.2 | 0.4 | 2.7 |
| O106 | 22.07 | 38.37 | 3 | 1991–2001 | −13.1 | −11.3 | – | – |
| P | 22.03 | 38.26 | 3 | 1991–1995 | −10.0 | −22.7 | – | – |
| P226 | 22.01 | 38.28 | 4 | 1991–2001 | −6.7 | −23.0 | 1.4 | 3.2 |
| Q | 21.97 | 38.23 | 4 | 1991–2001 | −12.4 | −22.2 | 1.0 | 0.8 |
| R | 21.95 | 38.19 | 4 | 1991–2001 | −8.9 | −25.3 | 1.2 | 0.3 |
| S | 22.41 | 38.41 | 6 | 1991–2001 | −9.0 | −11.9 | 2.7 | 1.0 |
| T | 22.24 | 38.18 | 7 | 1991–2001 | −9.6 | −22.6 | 0.5 | 0.9 |
| TR | 22.35 | 37.52 | 3 | 1993–1997 | −10.9 | −22.4 | 0.5 | 0.4 |
| U | 22.19 | 38.13 | 7 | 1991–2001 | −9.6 | −22.8 | 1.0 | 0.8 |
| U815 | 22.14 | 38.15 | 2 | 1995–2001 | −11.7 | −22.7 | – | – |
| V | 22.58 | 38.40 | 7 | 1991–2001 | −9.1 | −13.6 | 0.9 | 1.0 |
| W | 22.59 | 38.30 | 4 | 1991–2001 | −10.8 | −14.4 | 0.4 | 1.3 |
| X | 22.38 | 38.14 | 9 | 1991–2001 | −11.5 | −24.2 | 0.8 | 0.7 |
| Y | 22.56 | 38.10 | 4 | 1991–2001 | −9.9 | −23.2 | 0.6 | 0.2 |
| Z | 22.37 | 38.05 | 2 | 1993–2001 | −10.0 | −23.5 | 0.4 | 2.2 |
a Number of epochs of measurements / Nombre d'époques d'observation.
5 Discussion
The GPS velocities show that the extension is almost entirely accommodated offshore in the internal part of the rift in a band as narrow as 10 km near Aigion. The extension rate measured over eleven years is to the N185° E in the central part of the rift (Xilokastro) and to the N185° E in its western part (Aigion) (Fig. 4). To the west, two points (J, N) located on the southern block have velocity vectors intermediate between the ones expected for the southern and northern blocks, and suggest that part of the extension occurs on the Psathopirgos fault or south of it. Both southern and northern blocks behave as small rigid tectonic units affected by rotation rates, for the northern block, for the southern block (Table 3). The pole of rotation of the northern block with respect to fixed Europe is located at 39.25° N 20.92° E (Fig. 3). The pole of rotation of the same block with respect to Peloponnesos is located at 38.37° N 23.37° E (Fig. 4) near the junction of the northeastern termination of the rift and the southern termination of the North-Anatolian fault. With respect to ‘fixed Europe’ [15], Peloponnesos moves at towards N215° E, a value in good agreement with that obtained from larger-scale surveys [14]. In the ‘Peloponnisos-fixed’ reference system (Fig. 4), the vectors on the southern block indicate a clockwise rotation of Peloponnesos with respect to a pole located near Aigion, at the centre north of the block at 38.28° N 22.19° E. Given the number of the velocity data used and their accuracy, this estimate of the rotation rate for Peloponnisos is more reliable than the previous ones based on palaeomagnetic data [12], inferred from broken block rotation models [18], or on fewer and less accurate geodetic data [8,13]. The fact that the Corinth Rift opens more rapidly in the west than in the east indicates that the east tends to follow the southwest motion of Evia and Peloponnisos, whereas the northwest side of the rift is attached to the Apulia-Adriatic micro-plate and the northern Greece [18]. The rates of block rotations as well as the location of the poles are consistent with this simple model. Further extension of the existing GPS network to the west end of the rift will improve the present understanding of the processes occurring at the junction between the Corinth Rift and the western Hellenic arc.
Coordinates and angular velocities of the three poles of rotation plotted in Fig. 3(a) and 4(b) and (c) (CG=Central Greece; Eur =fixed Europe; Pel=Peloponnesos)
Coordonnées et vitesses angulaires obtenues pour les trois pôles de rotation indiqués sur les Figs. 3(a) et 4(b) et (c) (CG=Grèce centrale ; Eur=Europe fixe ; Pel=Péloponnèse)
| Code | Rotation pole | Longitude | Latitude | Rate |
| a | CG-Eur | 20.92 | 39.25 | |
| b | CG-Pel | 23.37 | 38.37 | |
| c | Pel-Pel | 22.19 | 38.28 |
After removing the block rotations, the residuals show the northern side of the rift internally deforming at a relatively slow north–south rate of (Fig. 5). The internal deformation of the southern part of the rift is less than , a result in good agreement with previous estimates based on tectonic and seismological analysis [2,9,13]. The slow rate of deformation across the major faults of the southern part of the Gulf implies long recurrence periods for large earthquakes (Ms=6.5 to 7) on these faults, 500–1000 years or more. Therefore, the smaller structures located in the inner part of the rift (like the 1995 fault) accommodate most of the rift extension probably with relatively frequent earthquakes of lower magnitude (Ms=5.5 to 6.5).
Acknowledgements
Since 1990, this work was supported by several French, Greek and European projects. The most recent are the EU projects SING (ENV4-CT97–0519) and CORSEIS (EVG1-CT99–00002) and the French ‘GDR Corinthe’. Several tens of people participated to the eleven tiring GPS campaigns: we are grateful to all of them. We thank Christophe Vigny and an anonymous reviewer for helpful comments and suggestions.