

Version française abrégée
1 Présentation générale de l'expérience
L'aire étudiée se situe dans le contexte extensif du golfe de Corinthe, actif depuis le début du Quaternaire [7, Fig. 1]. L'extension y est très rapide, ce qui occasionne une sismicité importante dans le golfe de Corinthe [1].
La géométrie du bassin est contrôlée par un ensemble de failles normales, présentant une structure en graben, avec une série de blocs basculés ayant favorisé des dépôts sédimentaires très épais, de faciès continentaux et marins [6]. Ces séries détritiques se sont déposées dans des compartiments abaissées par le jeu des failles normales. Elles constituent un aquifère multicouche, dont la perméabilité varie en fonction de la nature et de la granulométrie des sédiments. Ces séries recouvrent des formations carbonatées, qui sont karstifiées (Fig. 2). Ces deux systèmes aquifères, détritiques et carbonatés, constituent les principales ressources en eau de la région d'Aigion.

Geological cross-section of the Trapeza area.
Coupe géologique du site de Trapeza.
Deux puits ont été équipés au voisinage des localités de Neratzes et de Trapeza. Ils sont situés de part et d'autre des failles d'Aigion et de Hélike (Fig. 1) et captent l'eau dans les dépôts détritiques quaternaires :
- – la crépine du puits artésien de Neratzes est située entre 110 et 170 m de profondeur ; un débitmètre électromagnétique de précision et à pas de temps de 4 min a été installé sur ce puits ;
- – le puits artésien de Trapeza capte l'eau entre 90 et 130 m de profondeur ; une sonde de pression mesure le niveau d'eau toutes les 10 min.
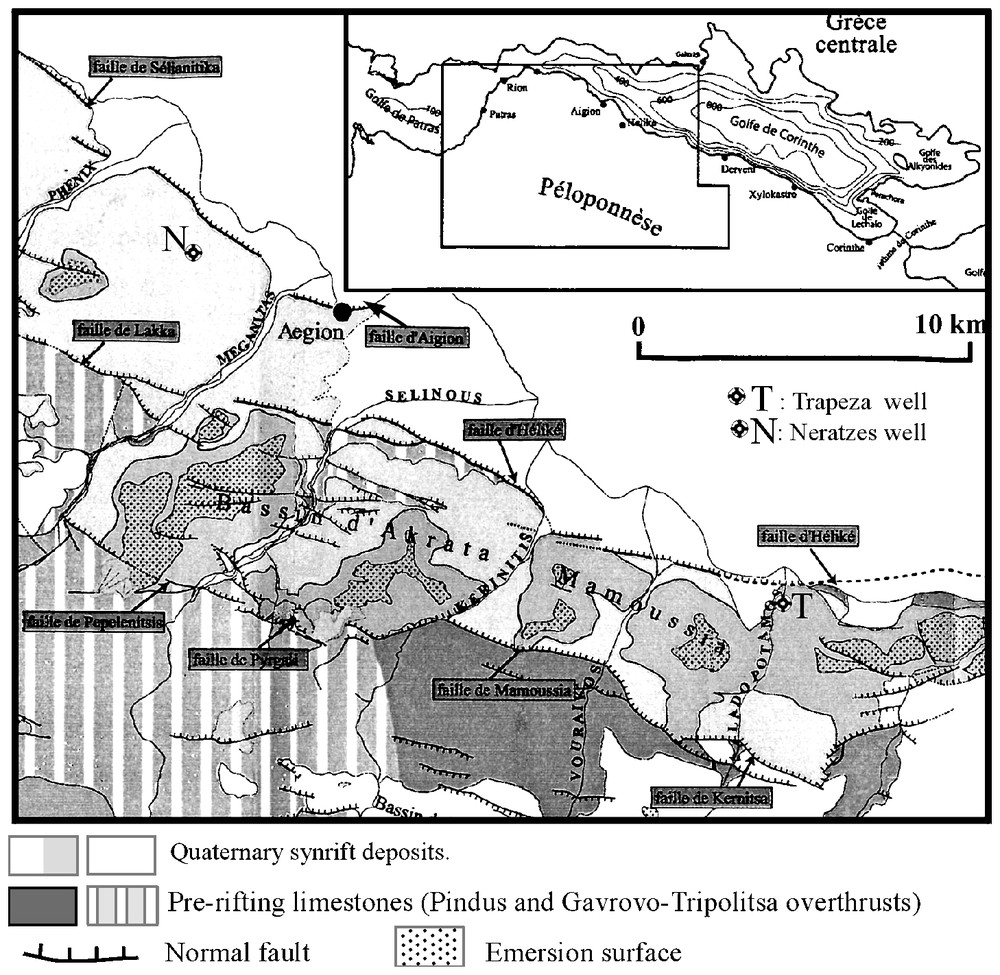
Structural setting of the Aigion area (modified from [6]).
Contexte structural de la région d'Aigion (modifié d'après [6]).
2 Analyse des données
Les forages de Trapeza et Neratzes présentent des fluctuations de charge hydraulique et de débit de longues et de courtes périodes (Fig. 3) :
- – les variations de longue période (de l'ordre du mois) ont des amplitudes de 20 à 60 cm : elles correspondent à la mise en charge et à la vidange de l'aquifère ;
- – les fluctuations de courte période (de semi-diurnes à hebdomadaires) avec des amplitudes de 3 à 10 cm pour Trapeza et de 3 à pour Neratzes correspondent aux variations induites par les marées terrestres et la pression atmosphérique ;
- – en plus de ces fluctuations, le puits de Trapeza présente des variations brutales de pression, qui décalent le niveau d'eau de 10 à 30 cm en quelques heures ; ces fluctuations ne semblent pas être dues aux précipitations, ni à un pompage dans le voisinage, mais à un problème d'installation : en effet, elles n'apparaissent plus depuis quelques mois.

Water-level and outflow changes in the studied wells and amplitude spectrum of the Trapeza signal.
Variations de niveau d'eau et de débit dans les puits étudiés et spectre d'amplitude du signal de Trapeza.
Les fluctuations de courtes périodes ont été utilisées pour étalonner le puits de Trapeza et pour estimer les propriétés hydrodynamiques de l'aquifère [4,8]. L'analyse de la réponse aux marées terrestres (Fig. 4) exécutée sur les six premiers mois de données, permet, en dépit de barres d'erreurs importantes, d'extraire une conductivité hydraulique de et une sensibilité à la déformation de l'ordre de 0,7 m pour une déformation de 10−6. Quoique les barres d'erreurs sur les ondes de marées observées soient importantes, les paramètres de l'aquifère sont raisonnables. Notons que la sensibilité du puits à la déformation (garante du lien entre tectonique et observation hydrologique) est relativement élevée.
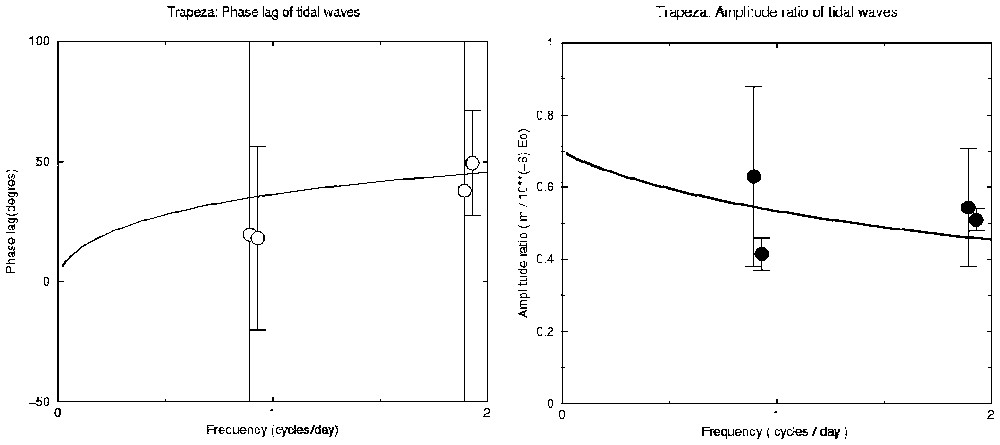
Trapeza Calibration using tidal waves: amplitude ratio and phase lag between the theoretical waves and the observed ones.
Trapeza : calibrage utilisant les ondes de marée. Rapports d'amplitude et déphasage entre les ondes théoriques et les ondes observées.
En ce qui concerne l'analyse barométrique (Fig. 5), nous calculons, en dépit d'une grande dispersion sur la détermination de l'efficacité barométrique, une valeur de la diffusivité verticale et un coefficient d'emmagasinement spécifique de 6,4×10⁻⁷ m−1 [2,10,11]. En ce qui concerne Neratzes, l'analyse du signal observé montre une sensibilité à la déformation au sein du puits de l'ordre de , pour une déformation de 10−6.
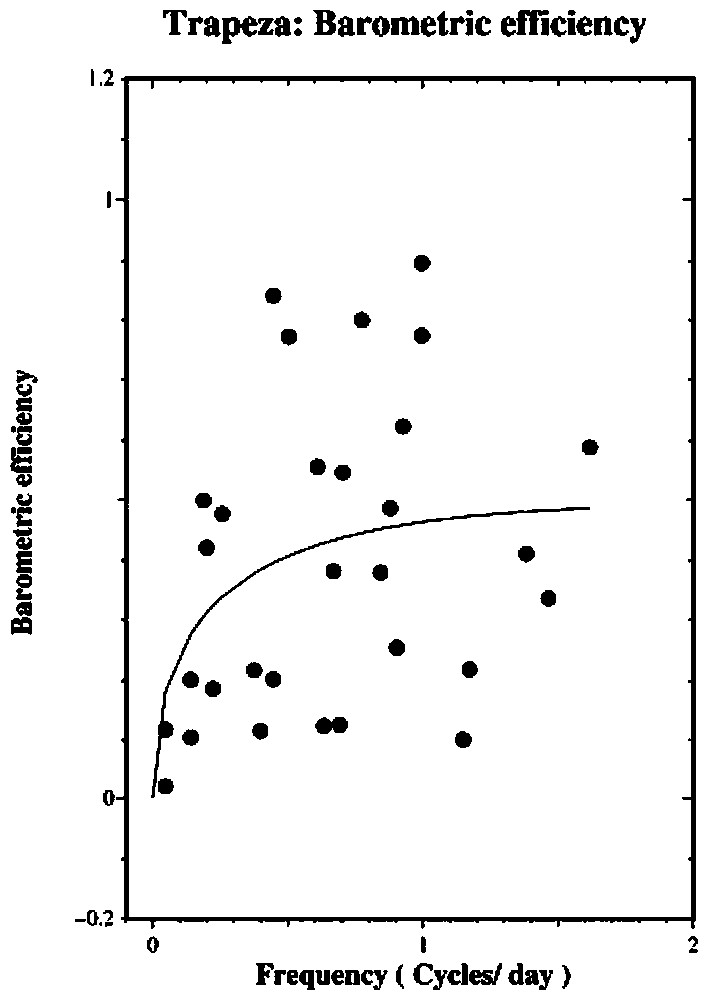
Barometric efficiency versus frequency. The black dots correspond to the calculated points. The solid line is the theoretical fit.
Efficacité barométrique en fonction de la fréquence. Les points noirs correspondent aux points calculés. La ligne continue est la courbe théorique ajustée.
3 Discussion et conclusion
À la suite de l'analyse des données du puits de Trapeza et sur la base de ses caractéristiques définies au paragraphe précédent, l'utilisation de ce dernier comme observatoire sismo-hydrologique semble pertinente. Nous présentons une modélisation des effets attendus pour un séisme qui serait l'analogue du séisme d'Aigion, du 15 juin 1995, Ms=6,2 [3]. À partir du champ de déformation associé au séisme, nous avons calculé la réponse temporelle qui résulterait de cet événement, en prenant en compte le degré de confinement calculé à partir des données barométriques (Fig. 6). Il apparaı̂t qu'un séisme analogue à l'événement d'Aigion serait clairement observable dans le puits de Trapeza, aussi bien en amplitude qu'en durée du signal observable. L'intérêt, lorsque nous disposerons de l'empreinte hydrologique d'un signal tectonique, sera, d'une part, de valider l'étalonnage, mais aussi de repérer les éventuelles déviations à ce modèle de comportement. Ceci constituera une information complémentaire des observations effectuées dans les puits profonds du projet du Laboratoire du rift de Corinthe.
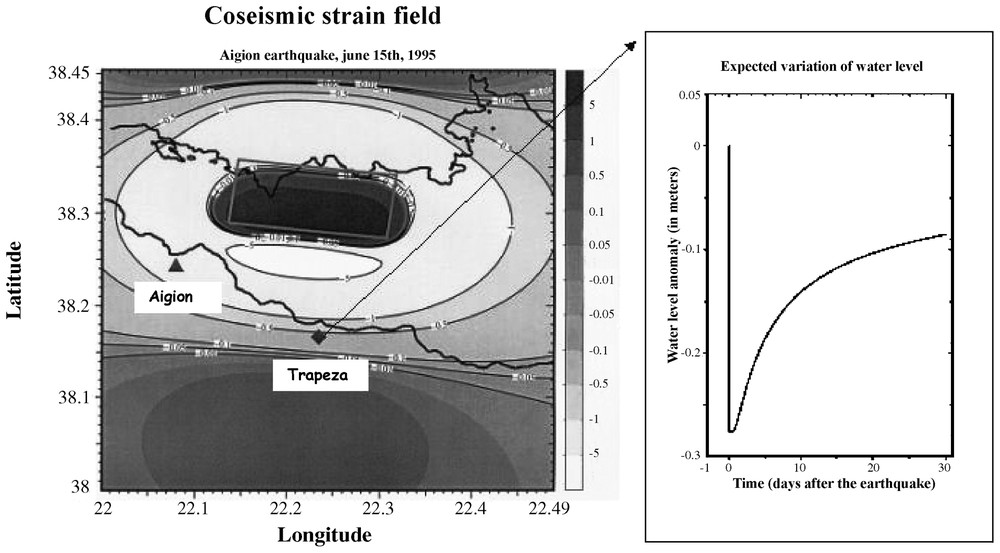
Strain field corresponding to an earthquake analogous to the Ms=6.2 Aigion earthquake and expected water-level change.
Champ de déformation correspondant à un séisme analogue au séisme d'Aigion (Ms=6,2) et variation du niveau d'eau attendue.
1 General presentation of the experiment
Two wells have been equipped at the beginning of 2002 in the Aigion area within the framework of the Corinth Rift Laboratory project. We present here a first analysis of the recorded data and an assessment of one year of recording.
1.1 Structural setting and hydrogeology of the Aigion area
The studied area is located in the Gulf of Corinth, which has been an active rift since the Earlier Quaternary [7]. The extension is particularly active (of 1 to ) with an important seismic activity [1]. The normal faults control the geometry of the sedimentary basins organized in grabens with tilted blocks. This structure in grabens induces thick Quaternary sedimentary deposits, with a continental and marine facies ([6, Fig. 1]).
These detrital sequences, settled in compartments lowered by the normal faults, constitute a multilayer aquifer, with a variable permeability according to the nature and grain-size distribution of the sediments. They overlie a karstic aquifer, which is fractured and tilted by the system of normal faults, and which outcrops southward between the altitudes of 1500 to 2000 m. These two aquifer systems (detrital and karstic) are the main water resources in the Aigion area.
1.2 Well data acquisition
The survey boreholes of Neratzes and Trapeza, located in the blocks limited by the faults of Aigion and Helike, catch water from the Quaternary detrital deposits (Figs. 1 and 2):
- – Neratzes: this artesian well catches water between depths of 110 and 170 m; the equipment is an electromagnetic outflow-meter with a sensitivity of , and a step of measurement time of 4 min;
- – Trapeza: this artesian well catches water between depths of 90 and 130 m, and a pressure sensor measures water level every 10 min; the top wall of the aquifer is formed by 40 m of impermeable marls; the Trapeza well does not reach the limestone, but field studies and water chemistry prove that the boundary of karstic aquifer is close to the Trapeza aquifer (Fig. 2).
These equipments were installed at the beginning of 2002. Corrosion due to aggressive local water has partially damaged the installation during the second part of the year, so that only 6 months of records are currently available. These problems have been solved at the beginning of 2003.
2 Preliminary processing of data
2.1 Preliminary remarks
The analysis of hydraulic pressure and outflow from the Trapeza and Neratzes wells allowed us to identify two kinds of variations (Fig. 3):
- – long-term variations (of the order of the month) with amplitudes of 20 to 60 cm for Trapeza; they are related to groundwater recharge and to the emptying of the aquifers;
- – short-term variations (semi-diurnal to weekly), with amplitudes of 3 to 10 cm for Trapeza and of 3 to for Neratzes; these variations seem to be induced by the atmospheric pressure variations and by the tidal deformations, as we will see later.
In addition to these variations, we observe fast changes of water level in the Trapeza well. The water-level increase or decrease can reach 30 cm, with a time constant of a few hours (see the ‘zoom’ in Fig. 3). These variations have been induced by a problem of installation and by the corrosive power of water.
Since a few months, the well is closed by a plastic system, which cannot be corroded by the water and these variations did not appear anymore.
2.2 Analysis of the data of Trapeza well
The observed variations of water level in wells result from a set of physical processes that affect the aquifer. These naturally caused processes allow usually, when hydrological tests have not been performed, to fix the values for the hydrodynamic and poro-elastic parameters of the aquifer. We present here a preliminary analysis of the variations observed within the Trapeza well, which covers six months of monitoring.
2.2.1 Analysis of the earth tides
This type of analysis has been developed in the past [4,8]. Usually, one observes mainly the diurnal and semi-diurnal waves inside the well. This effect is shown in Fig. 3, where the amplitude of the spectrum of the Trapeza signal has been reported. One observes clearly diurnal (around 1 cycle/day) and semi-diurnal (around 2 cycles/day) tidal waves in this figure. After removing the low-frequency variations in the signal in order to extract the tidal effect, a visual inspection indicates that the tidal signal seems to remain stable with time for the six months of analysis. The aquifer is strained by the tides and this allows the fluid to flow in the well. This is what we observe here. This flow process depends on the properties of the porous medium. According to [5], the observed signal in the Fourier domain can be written as follows:
| (1) |
2.2.2 Barometric analysis
The barometric efficiency is defined as the ratio between the pressures observed in the well and the barometric pressure. The variations of the barometric pressure cover a much larger band of frequencies than tides waves and usually depend on the frequency. This dependence is due to the vertical fluid flow to the water table and provides information on how the aquifer is confined. The frequency dependence of the barometric efficiency can be expressed as [10]:
| (2) |
| (3) |
2.2.3 Analysis of the pluviometry
With regard to the measured variations of precipitation in the two closest stations (located near the sea, and in the mountains), there are two seasons of precipitations, in March and December. As we need more than one year of water-level measurement to identify the time lag between precipitation and water level, we can only estimate the time of seepage of precipitation to the aquifer: it is probably of the order of several months. Once the analysis will have been performed, we will be able to define the flow conditions in the aquifer by calculating a transfer function, taking into account the recharge associated with precipitations and the response observed in the well. This will allow us to remove the long period variations in the signal and to define the possible anomalies that might affect the signal.
2.3 Analysis of the Neratzes well
The tidal effect that we have observed in the Neratzes well seems to indicate that the measurement with the outflow-meter will provide a suitable tool in the future.
The outflow data of the Neratzes well are very disrupted due to installation problems that appeared during the first year of recording. Although these problems are solved now, a detailed analysis is not yet possible. Nevertheless, the data indicate that this type of unconventional measurements is valid. The amplitude spectrum calculated for the first three months of signal shows distinct tidal waves. The analysis of the observed signal gives a sensitivity of the well close to for a strain of 10−6.
3 Discussion and conclusion
In order to test the ability of the Trapeza well to be used as a ‘seismo-hydrological’ observatory, starting from its characteristics defined in the previous section, we present here a modelling of the effects which are expected for an earthquake which would be analogous to the Aigion event of 15 June 1995 (Ms=6.2). In that purpose, we use the fault model published in [3] and we calculate the resulting coseismic deformation field. The results are shown in Fig. 6. It appears that the expected deformation should be around 4×10⁻⁷, which is likely to yield a coseismic water level drop of around 0.4 m (the well is situated in the dilated area). The water level goes back to zero according to the equation W(t)=Ws·erf(z/(4·Cv·t)0.5), where Cv is the vertical diffusivity, Ws is the coseismic water-level change and erf is the error function. Fig. 6 shows the time constant that is associated with the diffusive process toward the water table. It appears that an event analogous to the Aigion earthquake should be clearly observed, as well as in amplitude and in duration. Let us keep in mind however that the hydromechanical model is based on a poro-elastic description of the coupling, and that the fluid is supposed to circulate in a homogeneous medium. The deviations to this type of behaviour will provide complementary information to that given by the deep boreholes drilled in the framework of the Corinth Rift Laboratory project. The development of a larger network of observation wells would constitute an important element for tracking the heterogeneity of fluid flow in the Corinth area.
Finally we have to emphasize that the calibration is a very preliminary one. We have seen that anomalous events affected the signal during the time of recordings on which the calibration was done. Even though it introduces some noise that makes the calibration analysis less reliable, it does not seem to have an effect on the calibration itself. Recent recordings in the Trapeza well (where the perturbations have disappeared) seem to confirm the preliminary calibration presented here.
Acknowledgements
This work was supported by CNRS–INSU through the ‘GDR Corinthe’. We wish to thank F. Cornet and P. Bernard for their help in many occasions and for the discussions. We acknowledge also an anonymous referee who improved the initial manuscript. A special thank to Mylene and Tassos Filippakopoulos for their contribution, which was invaluable for the wells' equipment as well as for the data acquisition.