Plan
Comptes Rendus

Geochemistry
Quantification of water exchange between a hill reservoir and groundwater using hydrological and isotopic modelling (El Gouazine, Tunisia)
[Quantification des échanges entre une retenue collinaire et les eaux souterraines par modélisation hydrologique et isotopique (El Gouazine, Tunisie).]
Comptes Rendus. Géoscience, Volume 336 (2004) no. 16, pp. 1453-1462.

Résumés

Stable isotope compositions (18O and 2H), determined for underground and surface waters from the watershed of a hill reservoir and downstream from the reservoir, suggest that (i) the reservoir water, which is more or less evaporated, represents a mixture between surface waters (rainfall, runoff) and the upstream alluvial groundwater meteoric in origin; (ii) the downstream alluvial groundwater have a stable isotope composition of a previously infiltrated reservoir water. The 18O isotope enrichment modelling of the mixed reservoir water shows that an input flux of 50 m3 day−1 is balanced by an output flux of 300 m3 day−1 when the reservoir water level is above 4.5 m, and by an output flux of 170 m3 day−1 when water levels are lower. The contribution of hill reservoirs to local groundwater movements must be considered in any regional scale hydrological investigations of areas that contain hill reservoirs.

La composition isotopique (18O et 2H) d'eaux souterraines et superficielles, déterminée pour le bassin versant d'une retenue collinaire et sa partie aval, suggère (i) que l'eau de la retenue, qui est plus ou moins évaporée, représente un mélange entre les eaux de surface (pluie, ruissellement) et la nappe alluviale amont d'origine météorique et (ii) que la nappe alluviale aval a la composition isotopique d'une eau de la retenue anciennement infiltrée. La modélisation de l'enrichissement en isotope 18O pour l'eau mélangée de la retenue montre qu'un flux entrant de 50 m3 j−1 est compensé par un flux sortant de 300 m3 j−1, lorsque le niveau d'eau de la retenue est supérieur à 4,5 m, et par un flux sortant de 170 m3 j−1 en dessous. La contribution des lacs collinaires aux écoulements souterrains doit être prise en compte pour de futures études hydrologiques à l'échelle régionale.

Métadonnées
Reçu le :
Accepté le :
Publié le :
DOI : 10.1016/j.crte.2004.08.006
Keywords: groundwater, water budget, stable isotopes, hill reservoir, modelling, North Africa, Tunisia
Mot clés : eaux souterraines, bilan hydrologique, isotopes stables, lac collinaire, modélisation, Afrique du Nord, Tunisie
Olivier Grünberger 1 ; Jean-Pierre Montoroi 2 ; Slah Nasri 3

1 IRD–LDD, Paholyothin Road, Chatuchak, 10900 Bangkok, Thailand
2 IRD, 32, av. Henri-Varagnat, 93143 Bondy, France
3 INRGREF, rue Hédi-Karray, BP 10, 2080 Ariana, Tunisia
@article{CRGEOS_2004__336_16_1453_0,
     author = {Olivier Gr\"unberger and Jean-Pierre Montoroi and Slah Nasri},
     title = {Quantification of water exchange between a hill reservoir and groundwater using hydrological and isotopic modelling {(El} {Gouazine,} {Tunisia)}},
     journal = {Comptes Rendus. G\'eoscience},
     pages = {1453--1462},
     publisher = {Elsevier},
     volume = {336},
     number = {16},
     year = {2004},
     doi = {10.1016/j.crte.2004.08.006},
     language = {en},
}
TY  - JOUR
AU  - Olivier Grünberger
AU  - Jean-Pierre Montoroi
AU  - Slah Nasri
TI  - Quantification of water exchange between a hill reservoir and groundwater using hydrological and isotopic modelling (El Gouazine, Tunisia)
JO  - Comptes Rendus. Géoscience
PY  - 2004
SP  - 1453
EP  - 1462
VL  - 336
IS  - 16
PB  - Elsevier
DO  - 10.1016/j.crte.2004.08.006
LA  - en
ID  - CRGEOS_2004__336_16_1453_0
ER  - 
%0 Journal Article
%A Olivier Grünberger
%A Jean-Pierre Montoroi
%A Slah Nasri
%T Quantification of water exchange between a hill reservoir and groundwater using hydrological and isotopic modelling (El Gouazine, Tunisia)
%J Comptes Rendus. Géoscience
%D 2004
%P 1453-1462
%V 336
%N 16
%I Elsevier
%R 10.1016/j.crte.2004.08.006
%G en
%F CRGEOS_2004__336_16_1453_0
Olivier Grünberger; Jean-Pierre Montoroi; Slah Nasri. Quantification of water exchange between a hill reservoir and groundwater using hydrological and isotopic modelling (El Gouazine, Tunisia). Comptes Rendus. Géoscience, Volume 336 (2004) no. 16, pp. 1453-1462. doi : 10.1016/j.crte.2004.08.006. https://comptes-rendus.academie-sciences.fr/geoscience/articles/10.1016/j.crte.2004.08.006/

Version originale du texte intégral

Version française abrégée

1 Introduction

Plusieurs centaines de retenues collinaires construites en Tunisie centrale [1,26] permettent la recharge de la nappe alluviale. Une importante infiltration souterraine est manifeste lorsque le bilan hydrologique annuel est fortement négatif. Les isotopes stables 18O et 2H peuvent être utilisés pour améliorer la connaissance du bilan hydrologique souterrain entre lac et aquifère [2,15]. L'objectif de l'étude est d'évaluer le bilan hydrologique souterrain d'une retenue collinaire infiltrante et de déterminer les conséquences de ce bilan sur l'aquifère alluvial aval.

2 Matériels et méthodes

La retenue d'El Gouazine est située en Tunisie centrale, à environ 50 km au nord-ouest de Kairouan (35°55′N–9°45′E ; altitude 375 m) et forme un bassin versant de 18,1 km2 (Fig. 1). Le remplissage de la retenue, construite en 1990, est très variable sous climat méditerranéen. La pluviométrie moyenne annuelle est de 344,2 mm pour la période 1994–2000 et la moyenne annuelle de l'évaporation en bac classe A est 1745,4 mm pour la période 1996–2000. Le bilan hydrologique annuel de la retenue est compris entre 25408 m3 (1999–2000) et 273435 m3 (1995–1996) [8]. Pour une période donnée, ces valeurs correspondent au bilan hydrologique souterrain (les entrées moins les sorties), qui est la somme de deux termes mesurés, le bilan hydrologique de surface (l'évaporation et les autres usages de l'eau moins la pluie et le ruissellement) et la variation du volume d'eau dans la retenue. Une valeur négative du bilan souterrain exprime « une fuite » de la retenue non mesurée, qui se traduit par une perte nette vers la nappe. Aucun facteur correctif (environ 0,8 pour la nappe d'eau libre d'une petite retenue, d'après [24]) n'a été appliqué aux mesures d'évaporation en bac. Les sols sont principalement des Cambisols calcaires et des Calcisols encroûtés, qui se sont formés à partir de formations sédimentaires du Tertiaire [6,14,17]. La retenue a un faible taux d'envasement annuel et, depuis sa construction, les sédiments fins et grossiers, qui se sont déposés sur une épaisseur d'environ 3 m, en ont colmaté le fond. Cependant, une couche sableuse, formée par l'altération de grès calcaire en rive ouest, laisse supposer des fuites significatives [20,21]. Lorsque la retenue est pleine, la profondeur maximale est inférieure à 5 m et aucune stratification de l'eau n'a été observée [25]. L'aquifère alluvial aval est caractérisé par un gradient hydraulique de 0,01 m m−1, une transmissivité comprise entre 0,2 et 1,2×10⁻³ m2s−1 et un coefficient d'emmagasinement compris entre 0,02 et 0,12 [23]. Selon les dires des paysans locaux, la construction de la retenue a favorisé la recharge de l'aquifère alluvial aval permettant le maintien de l'irrigation.

Fig. 1

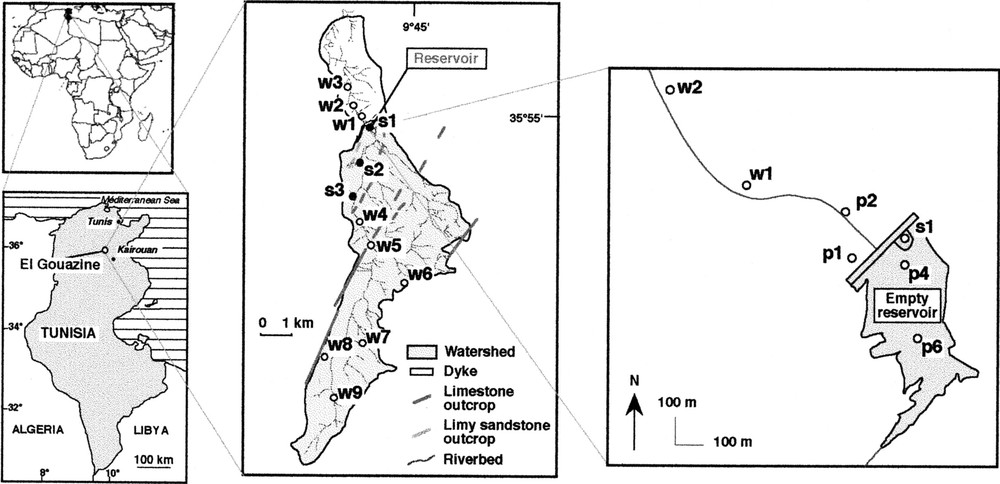
Location of the El Gouazine watershed in Tunisia (North Africa) with water sampling sites highlighted (● surface waters, ○ ground waters).

Localisation du bassin versant d'El Gouazine en Tunisie (Afrique du Nord) et indication des sites d'échantillonnage d'eau (● eaux de surface, ○ eaux de nappe).

Du 14 au 23 mai 1998, 13 échantillons d'eau de nappe ont été prélevés dans des puits (9) et des fosses (4), répartis dans le bassin versant et en aval de la retenue presque vide. Trois échantillons d'eau de surface ont été collectés dans et autour de la retenue (Fig. 1). Les teneurs isotopiques mesurées d'après [13] et [10] sont exprimées en δ‰ vs V-SMOW, avec une précision de ±0,2 pour δ18O et ±2 pour δ2H, et en termes de rapport isotopique selon la relation (1) [16]. Le bilan hydrologique quotidien de la retenue est calculé selon un modèle récursif, qui relie les volumes d'eau stockés Vn et Vn+1 aux jours n et n+1, selon la relation (2). Les termes V0, Pn, En et Sn étant connus, le modèle teste différentes valeurs de (AqnFn) et ajuste une courbe de l'évolution du volume d'eau en comparant les valeurs calculées et observées du 1er janvier 1997 au 16 mai 1998 [8]. Par ailleurs, dans le terme Pn, le ruissellement est estimé en considérant un écoulement hortonien sur le bassin versant [9]. Le bilan isotopique quotidien de la retenue est calculé selon un modèle récursif qui relie les rapports isotopiques Rn et Rn+1 aux jours n et n+1, selon la relation (3). Les termes V0, R0, Rp0, Ra0, Pn, En, Sn et αn étant connus [3,5,12,19] et plusieurs conditions étant considérées [4], le modèle teste différentes valeurs de Aqn et de Fn. Il ajuste une courbe de l'évolution isotopique de la retenue, calculée du 1er septembre 1997 au 29 avril 1998, sur la valeur mesurée au cours de l'étude.

3 Résultats

Les teneurs isotopiques des eaux de nappe du bassin versant (w4 à w9, p6 et s3) sont présentées dans le Tableau 1. Les valeurs appartiennent aux droites des eaux météoriques globale GMWL [11] et locale LMWL [7] et sont en accord avec [18] (Fig. 2). Les eaux de surface (s1 et s2) et de sédiment (p4) sont enrichies en isotopes stables par évaporation, tandis que les teneurs isotopiques des eaux de la nappe aval (w1, w2, w3, p1 et p2) sont intermédiaires entre celles de la retenue et celles de la nappe amont. Les résultats suggèrent que l'eau de la retenue, qui est plus ou moins soumise à l'évaporation, est un mélange entre les eaux de surface (pluie, ruissellement) et la nappe alluviale amont, d'origine météorique. La nappe alluviale aval présente la composition isotopique d'une eau de la retenue anciennement infiltrée.

Table 1

Stable isotope (18O and 2H) composition of water samples from the El Gouazine site in May 1998

Composition en isotopes stables (18O et 2H) des eaux du site d'El Gouazine en mai 1998

Sample Label Date 18O () 2H
Evaporated water
Reservoir water s1 14/05/98 10.9 45.4
Surface water s2 14/05/98 1.9 5.3
Pit p4 23/05/98 −1.1 −7.7
Downstream groundwater
Well w1 17/05/1998 −2.1 −13.2
Well w2 21/05/1998 −2.0 −13.0
Well w3 21/05/1998 −2.6 −15.1
Pit p1 21/05/1998 −1.3 −9.1
Pit p2 21/05/1998 −2.2 −15.5
Upstream groundwater
Well w4 16/05/1998 −4.1 −25.5
Well w5 16/05/1998 −5.3 −31.1
Well w6 16/05/1998 −5.4 −28.9
Well w7 23/05/1998 −4.7 −32.0
Well w8 16/05/1998 −5.2 −33.9
Well w9 21/05/1998 −4.4 −23.5
Pit p6 22/05/1998 −3.6 −22.1
Seepage s3 14/05/1998 −4.5 −24.3
Fig. 2

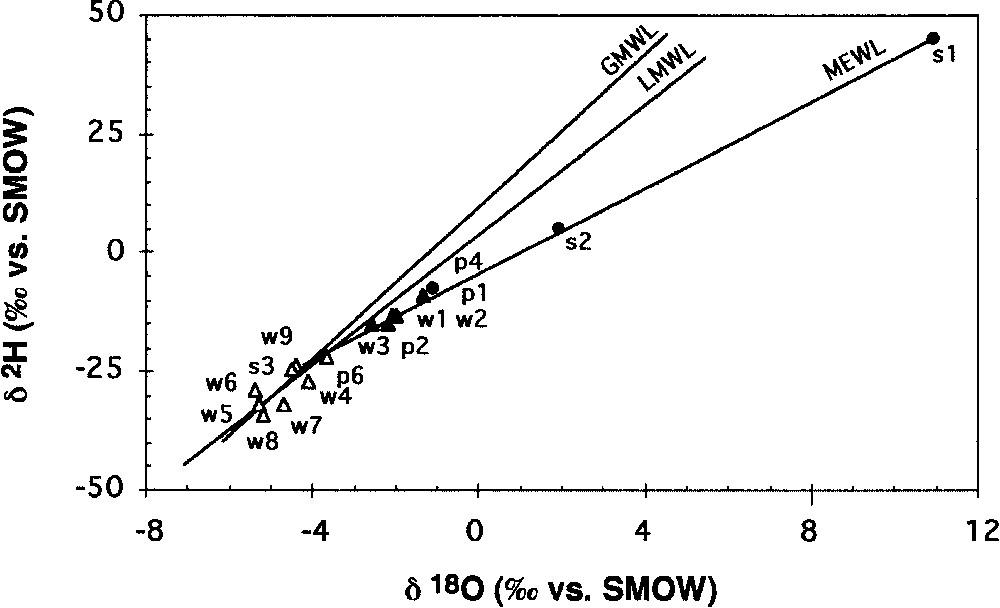
Relationship between 2H and 18O for samples of surface and ground water from the El Gouazine site. GMWL, global meteoric water line (δ2H=8δ18O+10 after [10]); LMWL, local meteoric water line (δ2H=6.5δ18O+4.3 after [7]); MEWL, mixing and evaporated water line (δ2H=4.6δ18O3.9). ● Evaporated waters including reservoir water (s1); ▴ ground waters from downstream wells and pits; ▵ groundwaters from upstream wells, pits and seepage.

Relation entre 2H et 18O pour les eaux de surface et de nappe du site d'El Gouazine. GMWL, droite globale de l'eau météorique (δ2H=8δ18O+10 d'après [10]); LMWL, droite locale de l'eau météorique (δ2H=6,5δ18O+4,3 d'après [7]) ; MEWL, droite de l'eau mélangée et évaporée (δ2H=4,6δ18O3,9). ● Eaux mélangées et évaporées, incluant l'eau de la retenue (s1) ; ▴ eaux de nappe provenant des puits et des fosses en aval ; ▵ eaux de nappe provenant des puits, des fosses et des suintements en amont.

Le meilleur ajustement du modèle hydrologique est obtenu pour des valeurs de (AqnFn) égale à 250 m3j−1 au-dessus du niveau d'eau 4,5 m et à 120 m3j−1 au-dessous (Fig. 3). En utilisant ces valeurs, la modélisation isotopique de l'eau de la retenue débute par une valeur de 4 δ18O, correspondant à des apports superficiels (pluie/ruissellement, Rp0) et souterrain (Ra0), et par un nouveau remplissage de la retenue (R0=Rp0). Pour caler le modèle sur la valeur mesurée au cours de l'étude, on considère un flux souterrain entrant de 50 m3 j−1 et un flux souterrain sortant de 300 m3 j−1, quand le plan d'eau est au-dessus de 4,5 m, ou de 170 m3 j−1 au-dessous (Fig. 4a), les échanges avec la vapeur atmosphérique étant négligeables [15].

Fig. 3

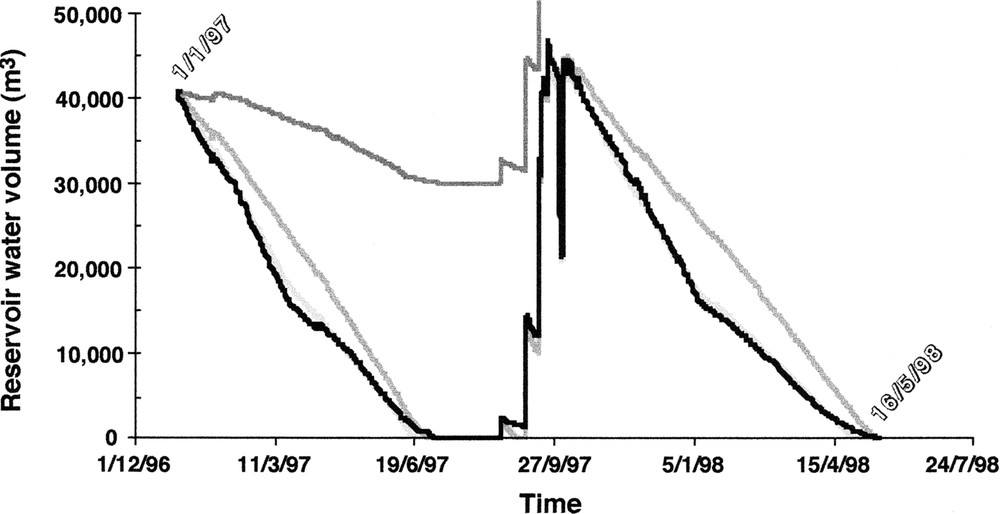
Simulation of water volume change over time in the El Gouazine reservoir. Bold-black line, measured water volume; dark-grey line, AqnFn=0 m3day−1; medium-grey line, Aqn Fn=150 m3day−1; light-grey line, AqnFn=250 m3day−1 above 4.5 m water level and AqnFn=120 m3day−1 below the 4.5-m water level.

Simulation de l'évolution temporelle du volume d'eau dans la retenue d'El Gouazine. Trait en noir foncé, volume d'eau mesuré ; trait en gris foncé, AqnFn=0 m3j−1; trait en gris moyen, AqnFn=150 m3j−1; trait en gris clair, AqnFn=250 m3j−1 au-dessus du niveau d'eau à 4,5 m et AqnFn=120 m3j−1 en dessous du niveau d'eau à 4,5 m.

Fig. 4

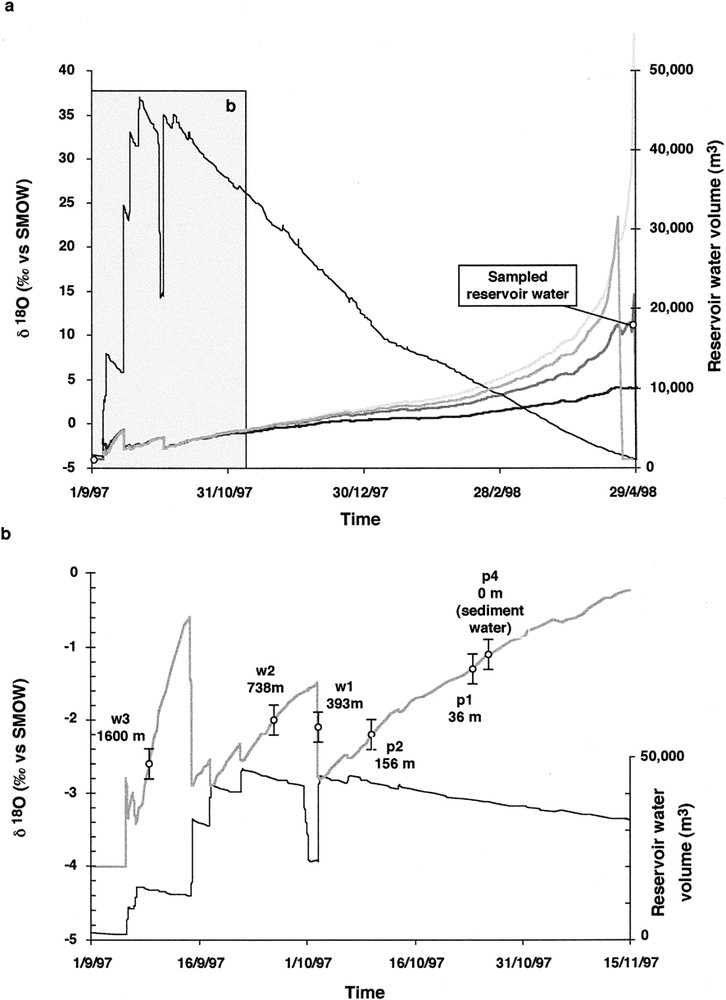
(a) Simulation of the 18O content over time for water from the El Gouazine reservoir during the period 1997–1998. Bold-black line, Aq=150 m3day−1; dark-grey line, Aq=50 m3day−1; medium-grey line, Aq=25 m3day−1; light-grey line, Aq=0 m3day−1; black line, measured reservoir water volume; ○ measured 18O content of reservoir water. (b) Detail of a time period from Fig. 4a. Dark-grey line, Aq=50 m3day−1; black line, measured reservoir water volume; ○ measured 18O content of downstream groundwater assumed to be the 18O content of a previously infiltrated reservoir water; I, standard deviation; w3/p1, sampled well or pit; 36 m, distance from the reservoir.

(a) Simulation de l'évolution temporelle de la teneur en 18O pour l'eau de la retenue d'El Gouazine durant la période 1997–1998. Trait noir foncé, Aq=150 m3j−1; trait gris foncé, Aq=50 m3j−1; trait gris moyen, Aq=25 m3j−1; trait gris clair, Aq=0 m3j−1; trait noir, volume d'eau mesuré dans la retenue ; ○ teneur en 18O mesurée dans l'eau de la retenue. (b) Détail d'une période de temps extraite de la Fig. 4a. Trait gris foncé, Aq=50 m3j−1; trait noir, volume d'eau mesuré dans la retenue ; ○ teneur en 18O mesurée dans l'eau de la nappe aval et considérée comme étant la teneur en 18O d'une eau de la retenue anciennement infiltrée ; I, intervalle indiquant la précision de la mesure ; w3/p1, puits ou fosse échantillonné ; 36 m, distance depuis la retenue.

Comme les valeurs isotopiques mesurées dans la nappe alluviale aval correspondent à des valeurs isotopiques d'une eau de la retenue anciennement infiltrée, on dispose sur la Fig. 4b, qui constitue un agrandissement de la Fig. 4a, les points de mesure suivant un ordre logique et on en déduit les dates relatives à l'acquisition du signal isotopique. Connaissant la distance (dg) parcourue par l'eau infiltrée en aval de la retenue et la durée du parcours (ng), on peut estimer une vitesse d'écoulement souterrain (vg=dg/ng). Pendant une période donnée, le volume (Vg) d'eau infiltrée par la retenue est déduit de la modélisation isotopique. Pour une période d'écoulement cumulée de 51 jours, les valeurs respectives de vg et Vg sont 31,4 m j−1 et 14 650 m3 (Tableau 2). La vitesse d'écoulement souterrain est d'autant plus grande que la retenue est plus remplie. Le rapport Vg/fdg, où f représente la porosité totale des dépôts alluviaux, donne une estimation de la section transversale de l'aquifère alluvial. En estimant une porosité de 25 % pour les dépôts alluviaux calcaires, la valeur est de 36,6 m2, ce qui est en accord avec d'autres observations de terrain [22]. En considérant un gradient piézométrique mesuré de 0,01 m m−1, une perméabilité estimée de 0,01 m s−1 et la section transversale d'écoulement précédemment calculée, une application simple de la loi de Darcy nous permet d'estimer un flux de 316,4 m3 j−1, qui est bien en accord avec les résultats de notre modélisation.

Table 2

Estimate of leakage from the El Gouazine reservoir in May 1998. δO18, oxygen-18 content of alluvial groundwater; dg, distance of groundwater flow; ng, time period of groundwater flow; vg, groundwater flow velocity; Vg, output groundwater volume of the reservoir; cdg, cng and cVg, cumulative groundwater values; mvg, mean velocity of groundwater movement

Estimation des pertes par infiltration de la retenue d'El Gouazine en mai 1998. δ18O, teneur en oxygène 18 de la nappe souterraine alluviale ; dg, distance parcourue par l'écoulement souterrain ; ng, durée du parcours souterrain ; vg, vitesse de déplacement de la nappe souterraine ; Vg, volume d'eau souterraine sortant de la retenue ; cdg, cng et cVg, valeurs cumulées des paramètres de l'écoulement souterrain ; mvg, vitesse moyenne de déplacement de la nappe souterraine

Label 18Oa() Date dga (m)b ng (day) vg (m day−1) Vgc (m3) cdg (m) cnd (day) mvg (m day−1) cVg (m3)
p4 −1.1 30/10/1997 0 0 0
36 5 7.2 1500
p1 −1.3 25/10/1997 36 5 7.2 1500
120 14 8.6 4200
p2 −2.2 11/10/1997 156 19 8.2 5700
237 8 29.6 2400
w1 −2.1 03/10/1997 393 27 14.6 8100
345 6 57.5 1800
w2 −2.0 27/09/1997 738 33 22.4 9900
862 18 47.9 4750
w3 −2.6 09/09/1997 1600 51 31.4 14 650

a Measured data;

b estimated data from Fig. 4b;

c calculated data from water isotope budget modelling.

4 Conclusion

La modélisation hydrologique des variations quotidiennes du volume de la retenue montre que l'on peut estimer le bilan hydrologique souterrain d'un lac collinaire. Pour le lac collinaire d'El Gouazine, le bilan est négatif et est de 120 m3j−1 au-dessous d'un niveau d'eau de la retenue estimé à 4,5 m. Au-dessus de ce seuil, le bilan double. Ayant été calibré pour une seule année hydrologique, le modèle devra être validé en prenant en compte la variabilité climatique interannuelle. L'utilisation des isotopes stables de l'eau et la modélisation isotopique permettent d'estimer les flux d'eau souterraine entrant et sortant de la retenue. Pour le lac collinaire d'El Gouazine, on a pu estimer le flux entrant à 50 m3 j−1 et le flux sortant à 300 m3j−1 au-dessus du seuil de 4,5 m ou à 170 m3j−1 au-dessous. Cependant, la calibration du modèle isotopique s'est faite avec seulement deux points de mesure (condition initiale et mesure au moment de l'étude). Ce manque de données nécessitera de compléter l'étude par un suivi temporel de la composition isotopique des eaux superficielles et souterraines du lac collinaire pour mieux comprendre le fonctionnement de la retenue à de courts pas de temps. Par ailleurs, comme la composition isotopique des eaux de l'aquifère alluvial change avec la construction de lacs collinaires, la présence de tels ouvrages dans le paysage doit être prise en compte dans des études régionales concevant une stratégie d'échantillonnage des eaux souterraines pour l'analyse isotopique.

1 Introduction

Numerous water and soil conservation projects are planned for Mediterranean countries such as Central Tunisia, where several hundreds hill reservoirs have been constructed in a range of environments [1,26]. Among the benefits of using rain-harvesting constructions such as hill reservoirs is the recharge of adjacent groundwater supplies, which acts as an efficient mechanism for preserving water resources compared with separate water storage facilities that allow evaporation but no groundwater recharge. Current methods of determining the surface hydrological budget of hill reservoirs by monitoring water level, rainfall and evaporation neglect the important influence of groundwater infiltration. The importance of infiltration is evident when annual surface water budgets are highly negative. Unfortunately, understanding this process is hampered by the lack of knowledge about the hydrological budget of infiltrated groundwater. As intrinsic components of the H2O molecule, the stable isotopes 18O and 2H can be measured and used to distinguish between waters from different sources, hence they can improve the knowledge of groundwater balance between lake or reservoir and aquifer [2,15].

The objective of our research has been to assess the groundwater balance for an infiltrated hill reservoir and determine the consequences of this balance for the adjacent alluvial aquifer.

2 Materials and methods

2.1 Study site

The El Gouazine hill reservoir is located approximately 50 km northwest of the city of Kairouan (35°55′N–9°45′E ; 375 m elevation) in Central Tunisia. The reservoir is situated at the outlet of an 18.1 km2 watershed (Fig. 1). Constructed in 1990, the reservoir consists of a 232-m-long dyke constructed of earth materials and has a maximum capacity of 233 370 m3. Replenishment of the reservoir is highly variable owing to the complexities of the Mediterranean climate. The mean annual rainfall in the watershed was 344.2 mm during the period from 1994 to 2000. Class-A pan evaporation in the watershed far exceeds rainfall each year with a mean annual evaporation amount of approximately 1745.4 mm estimated for the period from 1996 to 2000 [8]. The surface hydrological budget has been monitored since 1994 and the annual value is ranging from 25,408 m3 (1999–2000) to 273,435 m3 (1995–1996) [8]. For a given period, the budget value corresponds to the groundwater balance (input minus output), which is the sum of two measured terms, the water surface balance (evaporation and other water releases minus rainfall and runoff) and the variation of the reservoir water volume. A negative value of the groundwater budget expresses an unmeasured leakage of the reservoir, which represents a net water loss and a water supply of the downstream groundwater. No corrected factor (usually 0.8 for the free-water surface of a small reservoir after [24]) was applied to the class A pan evaporation measurements. The 20% evaporation overestimation should have enhanced the negative groundwater balance by about 10%.

The El Gouazine watershed is located at the east boundary of the SW–NE-oriented Ousseltia syncline [6,17]. The elevation of the watershed regularly decreases from 575 to 375 m in the vicinity of the reservoir. Soil formations (mainly calcrete calcisols and calcaric cambisols) have developed on underlying Tertiary sedimentary units [14], which were intensely folded during the formation of the Atlas Mountains, approximately 40 million years ago with these tectonic movements producing nearly vertical rock layers that dip steeply to the southeast in the eastern part of the watershed.

The reservoir is affected by only small amounts of siltation each year and, since the reservoir construction in 1990, the volume of accumulated clayey and coarse sediments has been 16,030 m3. This accumulation has led to sediment deposits of nearly 3 m thickness that effectively make the reservoir impermeable. However, a sandy layer, formed by weathering of a calcareous sandstone, is present on the western embankment of the reservoir and is thought to promote leakage when the reservoir is replenished [20,21]. When the reservoir is full, the maximum water depth is less than 5 m and no water stratification is recorded [25]. Detrital materials are deposited in the riverbed, leading to the formation of a temporary alluvial aquifer that has been exploited by the construction of wells to meet agricultural and domestic water needs. The alluvial aquifer downstream of the reservoir, laterally delimited by the mean water channel width, is characterized by a 0.01-m m−1 hydraulic gradient, a transmissivity ranging from 0.2 to 1.2×10⁻³ m2s−1 and a storage coefficient ranging from 0.02 to 0.12 [23]. The reservoir construction has promoted water storage within the alluvial aquifer allowing long term irrigation, as reported by local farmers who noted an increase in groundwater levels immediately after the reservoir construction.

2.2 Water sampling and analytical methods

From 14 to 23 May 1998, water samples were taken from six wells in the reservoir watershed, three wells in the alluvial aquifer downstream of the reservoir and four pits both from downstream and within the almost empty reservoir. Three water surface samples were also collected within and around the reservoir (Fig. 1). The analysis of stable isotopes in the water samples was conducted at the Paris-11–Orsay University using the Epstein–Mayeda [13] and Coleman et al. [10] techniques. Isotope ratios were measured using a mass spectrometer and are expressed as δ‰ vs V-SMOW values with an analytical precision of ±0.2 for δ18O and ±2 for δ2H. An expression of the isotope ratio is given by the relationship:

Ri=(O18/O16orH2/H)=((δi/1000)+1)Rismow(1)
where i represents an isotope and where Rismow equals 0.15676×10⁻³ for 2H and 2.0052×10⁻³ for 18O [16].

2.3 Water budget modelling

The reservoir water budget is calculated using a recursive model linking the stored water volumes Vn and Vn+1 at the nth and (n+1)th days as follows:

Vn+1=Vn+(PnEnSn)+(AqnFn)(2)
where Pn is the rainfall and runoff inputs, En the evaporation output, Sn the water output by over-spillwaying or by bottom-flushing, Aqn and Fn the groundwater input and output. Runoff inputs are estimated considering a Horton overland flow within the reservoir watershed [9]. The initial value V0 and the values for Pn, En and Sn terms being known, the model tests different values for (AqnFn) and fits a curve of the evolution of water volume by comparing calculated and observed data. The hydrological dataset used for modelling consists of the daily information recorded by field monitoring of the reservoir water level, rainfall and evaporation between 1/9/1997 to 16/5/1998 [8].

2.4 Water isotope budget modelling

The reservoir water isotope budget for each day is calculated using the following recursive model:

Rn+1=[(VnFnSn)Rn+PnRpn+AqnRanEnαn]/[Vn+1](3)
where Rn, Rpn and Ran are the nth day isotope ratios of the reservoir water, the surface water inputs (rainfall and runoff) and the groundwater input respectively and αn is the nth-day isotope fractionation factor between the liquid and vapour phases. The total fractionation factor is calculated by summing the temperature-dependent enrichment factor at equilibrium given by [3] and the kinetic enrichment factor as defined by [12] using diffusion factors [19] and a turbulence factor of 0.67 [5].

Several assumptions are required: (i) as, after [4], the isotope ratio Rpn of the runoff water is slightly affected by the isotope ratio of the soil water, the runoff and rainfall Rpn values are considered as similar; (ii) Rpn and Ran do not change during the modelling and are equal to the initial values Rp0 and Ra0; (iii) downstream from the reservoir, we neglect the meteoric water supply of groundwater by soil infiltration. As the initial values (V0, R0, Rp0 and Ra0) and the values for Pn, En, Sn and αn terms are known, the model calculates the temporal evolution of the reservoir water isotope content for the period from 1 September 1997 to 29 April 1998 and tests how different values of Aqn and Fn fit the isotope content value measured in May 1998.

3 Results

3.1 Isotope water content

The isotope contents of the watershed groundwater (w4 to w9, p6 and s3) range from −5.4 to −3.6 δ18O and from −33.9 to −22.1 δ2H with average values of 4.7±1.2 δ18O and 27.7±8.2 δ2H (Table 1). These values fall on both the global meteoric water line (GMWL, δ2H=8δ18O+10 after [11]) and the local meteoric water line (LMWL, δ2H=6.5δ18O+4.3 extrapolated after [7]) (Fig. 2), and are in agreement with groundwater data of the Kairouan area [18]. The similarity of measured isotope values with independent meteoric water data indicates that groundwater upstream of the reservoir originates from infiltrating precipitation that is not subject to surface or subsurface alteration of its isotopic composition.

Reservoir water (s1), surface water (s2) and sediment water (p4) are enriched with stable isotopes during the evaporation process. Waters downstream of the reservoir (w1, w2, w3, p1 and p2) are weakly enriched with both δ2H and δ18O, with values ranging from −15.5 to −9.1 δ2H and from −2.6 to −1.3 δ18O, respectively (Table 1). These values suggest that the reservoir water, which is more or less evaporated, represents a mixture between surface waters (rainfall, runoff) and the upstream alluvial groundwater, meteoric in origin. The downstream alluvial groundwater has a stable isotope composition of a previously infiltrated reservoir water. The regression equation for a line fitted through the composition of both mixed and evaporated water, ‘the mixing and evaporated water line’ (MEWL), is δ2H=4.6δ18O3.9 with a square correlation coefficient (r2) of 0.997 and nine data couples. The intersection point between the MEWL and LMWL lines occurs at a stable isotope composition of 4.2δ18O (Fig. 2). The slope of the MEWL and the ratio equal to the kinetic enrichment factor for 18O and 2H allow us to calculate the relative humidity of the atmosphere as 0.37.

3.2 Input and output groundwater fluxes

The best fit for the water budget model is given by (AqnFn) values equal to 250 m3day−1 above the reservoir 4.5-m water level and 120 m3day−1 below (Fig. 3). Using these values, isotope modelling of the water isotope budget starts with a 4δ18O content of the inputs into the reservoir (rainfall/runoff, Rp0, and groundwater, Ra0) and with a newly replenished reservoir (R0=Rp0). As the calculated relative humidity is inferior to 0.4 and the observed maximum reservoir isotope content at the most evaporated stage is +10.9 δ18O, the deviation from the Rayleigh model by exchange with atmospheric vapour is neglected [15]. A 50-m3 day−1 groundwater input (Aqn) balanced by a 300-m3 day−1 output flux, when the reservoir water level is above 4.5 m, and by a 170-m3 day−1 output flux when the water level is below 4.5 m, fits well with the measured isotope content in reservoir water samples (Fig. 4a).

We assume that the measured 18O contents of downstream groundwater are the 18O contents of a previously infiltrated reservoir water. Hence, in Fig. 4b, which is a detailed part of Fig. 4a, the isotope contents in groundwater samples are plotted following a logical order and we infer the time corresponding to the acquisition of the isotope signal by the water sample based on the distance of the sampling point to the reservoir, assuming a known velocity of groundwater. Knowing the downstream distance (dg) and the time period (ng) of the groundwater flow, we can calculate an underground flow velocity (vg=dg/ng). For a given time period, the output water volume (Vg) of the reservoir is calculated after the results of the water isotope budget modelling. During a cumulated period of 51 days, the vg and Vg values are, respectively, 31.4 m day−1 and 14 650 m3 (Table 2). The larger the volume stored in the reservoir, the higher the flow velocity. The Vg/fdg ratio, where f is the total porosity of the alluvial deposits, gives an estimation of the transversal section area of the alluvial aquifer. Considering a 25% porosity of the calcareous alluvial deposits, the value is 36.6 m2, which is in accordance with other field observations [22]. Using a measured piezometric gradient of 0.01 m m−1, an estimated permeability of 0.01 m s−1 and the above alluvial aquifer area, a simple application of Darcy law allows us to infer a flow rate of 316.4 m3 day−1, which is well in agreement with the results of our modelling.

4 Conclusion

Quantification of the groundwater balance surrounding a hill reservoir has been possible using water budget modelling. For the El Gouazine reservoir, the groundwater balance is negative and ranging from 250 m3day−1 above a 4.5-m reservoir water level and 120 m3day−1 below. As the model was calibrated for only one hydrological year, a further validation will have to take into account the annual rainfall variability. Stable isotope measurements and water isotope budget modelling lead to estimate both the input and output groundwater fluxes of a hill reservoir. For the studied reservoir, the amount of water input to the reservoir from groundwater is 50 m3 day−1, whereas the amount of groundwater output from the reservoir varies with the reservoir water level, ranging from 300 m3day−1 above the 4.5-m threshold and 170 m3day−1 below. However, the calibration of the water isotope budget model was only made with two observed measurements (initial condition and sample measurement). This lack of isotope data versus time requires a further additional study for a better understanding of the reservoir functioning at short time steps.

Moreover, as the stable isotope composition of the waters in an alluvial aquifer drastically changes with the construction of a hill reservoir, the presence of such reservoirs in the landscape must be taken into account when planning strategies for sampling water for stable isotope analysis during regional surveys.

Acknowledgments

This study was sponsored from 1998 to 2001 by the European Union project Hydromed (ERBIC 18 CT 960091), managed by J. Albergel from IRD.


Bibliographie

[1] J. Albergel; M. Rejeb Les lacs collinaires en Tunisie : enjeux, contraintes et perspectives, C. R. Acad. Agric. Fr., Volume 83 (1997) no. 2, pp. 77-88

[2] L. Bergonzini; E. Gibert; A. Winckel; O. Merdaci Bilans hydrologique et isotopiques (18O et 2H) du lac Massoko, Tanzanie. Quantification des échanges lac–eaux souterraines, C. R. Acad. Sci. Paris, Ser. IIa, Volume 333 (2001), pp. 617-623

[3] Y. Bottinga; H. Craig Oxygen isotope fractionation between CO2 and water, and the isotopic composition of marine atmosphere, Earth Planet Sci. Lett., Volume 5 (1969), pp. 285-295

[4] J. Boulègue; T. Bariac; Y. Le Bissonnais; L.M. Bresson; F. Darboux; L. Djebairia; P. Richard; A.V. Auzet Caractérisation géochimique du ruissellement superficiel et du flux de subsurface, Actes du colloque PNRH 2000, Météo-France, Toulouse, 2000, pp. 39-42

[5] W. Brutsaert A theory for local evaporation (or heat transfer) from rough and smooth surfaces at ground level, Water Resour. Res., Volume 11 (1975), pp. 543-550

[6] G. Castany, Étude géologique de l'Atlas tunisien oriental, thèse, université de Besançon, 1951

[7] H. Celle-Jeanton; K. Zouari; Y. Travi; A. Daoud Caractérisation isotopique des pluies en Tunisie. Essai de typologie dans la région de Sfax, C. R. Acad. Sci. Paris, Ser. IIa, Volume 333 (2001), pp. 625-631

[8] Ces/Orstom, Annuaires hydrologiques des lacs collinaires. Réseau pilote de surveillance hydrologique, reports, Tunis, 1996, 1997a, 1997b, 1999, 2000, 2001

[9] R.J. Chorley The hillslope hydrological cycle (M.J. Kirby, ed.), Hillslope hydrology, John Wiley & Sons, 1978, pp. 1-41

[10] M.L. Coleman; T.J. Sheperd; T.E. Rousse; G.R. Moore Reduction of water with zinc for hydrogen isotope analysis, Anal. Chem., Volume 54 (1982), pp. 993-995

[11] H. Craig Isotopic variations in meteoric waters, Science, Volume 133 (1961), pp. 1702-1703

[12] H. Craig; L. Gordon Deuterium and oxygen-18 variations in the ocean and the marine atmosphere, Occ. Publ., Volume 3 (1965), p. 277

[13] S. Epstein; T. Mayeda Variation of oxygen-18 content of waters from natural sources, Geochim. Cosmochim. Acta, Volume 4 (1953), pp. 213-224

[14] A. Fournet, Etude pédologique de la dorsale tunisienne. Transversale Kebir-Bargou-Serdj-Ousseltia, Dess report, université de Paris, 1969

[15] R. Gonfiantini Environmental isotopes in lake studies (P. Fritz; J. Fontes, eds.), Handbook of Environmental Isotope Geochemistry, vol. 2, Elsevier, Amsterdam, 1986, pp. 112-168

[16] J. Hoefs Stable Isotope Geochemistry, Springer-Verlag, Berlin, 1997

[17] A. Jauzein Contribution à l'étude géologique des confins de la dorsale tunisienne (Tunisie septentrionale), Ann. Min. Géol., Tunis, Volume 22 (1967)

[18] I. Karray, N. Fakhfakh, Contribution à l'évaluation des ressources en eau du système aquifère de la plaine de Kairouan par les méthodes hydrochimiques et isotopiques (bassin d'oued Zéroud), mémoire de fin d'études, université de Sfax Sud-Enis, 1998

[19] L. Merlivat Molecular diffusivities of H216O, HD 16O and H218O in gases, J. Chem. Phys., Volume 69 (1978), pp. 2864-2871

[20] J.-P. Montoroi; O. Grünberger; S. Nasri Water chemistry of a small reservoir catchment in central Tunisia. Preliminary results of water–soil–rock interactions, Proc. Rep., Volume 3222 (1999), pp. 107-121

[21] J.-P. Montoroi; O. Grünberger; S. Nasri Groundwater geochemistry of a small reservoir catchment in Central Tunisia, Appl. Geochem., Volume 17 (2002) no. 8, pp. 1064-1071

[22] J.P. Montoroi; S. Nasri; M. Schmutz Geophysical survey of Mediterranean soils in a Tunisian floodwater harvesting system, 17th World Congress of Soil Science, Bangkok, Thaïlande, 14–21 August 2002, Abstracts, IUSS, Vol. IV, Symp. 48, 2002, p. 1495

[23] S. Nasri, Hydrological effects of water harvesting techniques. A study of tabias, soil contour ridges and hill reservoirs in Tunisia, Lund University Thesis, Sweden, Report 1030, 2002

[24] B. Pouyaud, Contribution à l'évaluation de l'évaporation de nappes d'eau libre en climat tropical sec. Exemples du lac de Bam et de la mare d'Oursi (Burkina-Faso), du lac Tchad et d'Açudes du Nordeste brésilien, Études et Thèses, Orstom, Paris, 1986

[25] N. Rahaingomanana, Caractérisation géochimique des lacs collinaires de la Tunisie semi-aride et régulation géochimique du phosphore, thèse, université Montpellier-1, 1998

[26] J.-C. Talineau; S. Selmi; K. Alaya Lacs collinaires en Tunisie semi-aride, Sécheresse, Volume 5 (1994) no. 4, pp. 251-256


Commentaires - Politique


Ces articles pourraient vous intéresser

Processus et bilan des flux hydriques d’un bassin versant de milieu tropical de socle au Bénin (Donga, haut Ouémé)

Bamory Kamagaté; Luc Séguis; Guillaume Favreau; ...

C. R. Géos (2007)


Origine et évolution du soufre au sein de l'aquifère des Sables infra-molassiques du Bassin aquitain

Laurent André; Michel Franceschi; Pierre Pouchan; ...

C. R. Géos (2002)


Une dépression piézométrique naturelle en hausse au Sahel (Sud-Ouest du Niger)

Guillaume Favreau; Christian Leduc; Christelle Marlin; ...

C. R. Géos (2002)