

Version française abrégée
L'enregistrement de la variabilité climatique rapide de la dernière période glaciaire est obtenu à haute résolution par le profil des isotopes de l'eau dans les carottes de glace du Groenland [9,21,37] (Fig. 1). Traditionnellement, la température y est reconstruite à partir de la relation spatiale observée actuellement entre isotopes de l'eau et température. Cependant, à cause de biais liés à la saisonnalité des précipitations et aux changements de température des régions d'évaporation des masses d'eau, de telles reconstructions des variations de température sont sous-estimées, jusqu'à un facteur 2, pour la dernière période glaciaire [4,6,7,11,22,24,26,46].
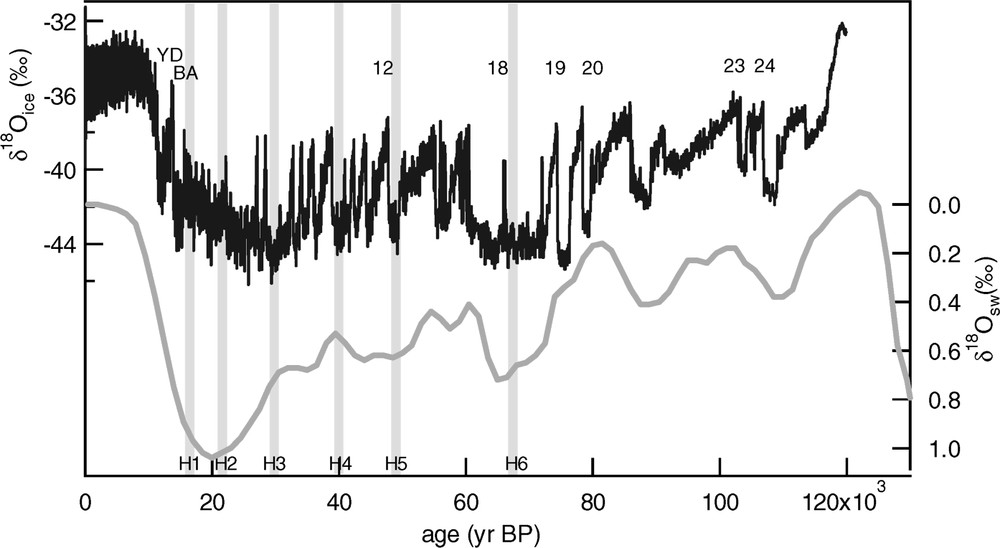
Top: full record of the over the NorthGRIP ice core [37] depicting the DO 1–25. We indicate the location of DO 18, 19, 20, 23 and 24. Bottom: global ocean record [43] depicting the evolution of the global ice volume during the last climatic cycle. Grey rectangles indicate the location of Heinrich events 1–6 [3].
En haut : enregistrement complet du O de la glace sur la carotte de NorthGRIP [37] avec la succession des DO 1 à 25. Les DO 18, 19, 20, 23 et 24 sont indiqués. En bas : enregistrement du O de l'océan global [43] indiquant l'évolution du volume total de glace pendant le dernier cycle climatique. Les rectangles gris indiquent les événements de Heinrich de 1 à 6 [3].
Une méthode alternative basée sur la mesure conjointe des isotopes de l'azote (N) et de l'argon (Ar) permet de reconstruire le scénario de température sur la succession des événements de Dansgaard–Oeschger (DO) [39,40]. En effet, lors des réchauffements rapides, un gradient transitoire de température affecte le névé (neige poreuse sur 100 m en surface de la calotte, avant piégeage de l'air dans la glace). Ce gradient de température modifie la répartition des isotopes et crée un fractionnement thermique, en plus d'un fractionnement gravitationnel. Ce gradient transitoire de température est alors enregistré comme une anomalie isotopique positive/négative pour un réchauffement/refroidissement dans l'air piégé dans la glace [40]. Combiner N et Ar permet d'isoler ce signal thermique du signal gravitationnel [39]. En effet, le signal gravitationnel est proportionnel, toutes choses étant égales par ailleurs, à la différence de masse entre les deux isotopes considérés ; il suffit donc de soustraire le quart du signal Ar au signal N pour obtenir un signal de nature purement thermique. Ce signal thermique, proportionnel au gradient transitoire de température dans le névé, peut alors être traduit en variation de température de surface via l'utilisation d'un modèle de densification du névé et de diffusion de la chaleur [16,38]. Les incertitudes sur la datation des carottes de glace (c'est-à-dire le taux d'accumulation) sont alors négligeables par cette méthode et, moyennant une incertitude analytique faible ( pour le N et pour le Ar), l'incertitude sur le changement de température calculé est de 2,5 °C [30].
À partir de cette méthode, nous avons mesuré un profil continu à haute résolution de N et Ar et obtenu une amplitude, pour les réchauffements rapides associés aux événements 18, 19, 20, 23 et 24, au début de la dernière période glaciaire (c'est-à-dire entre −107 et ) de 11, 16, 11, 10 et 16 ± 2,5 °C. Cette étude confirme les précédentes [6,7,22,29,30,32,33,39,40] et indique que la relation classique entre isotopes de l'eau et température sous-estime les variations de température pendant la dernière période glaciaire (sous-estimation allant jusqu'à un facteur 2,4 pour le DO 24). De plus, cette étude menée sur une longue séquence de DO montre que la pente temporelle réelle, , varie d'un événement à l'autre (de 0,5 à 0,3) et suggère que le scénario de température réel de la dernière période glaciaire au Groenland ne peut pas être linéairement relié au , même à l'intérieur d'un DO.
Sur le DO 19, nous montrons en effet une reconstruction à haute résolution de la température à partir des isotopes de l'air sur l'intégralité de l'événement (c'est-à-dire pas seulement restreinte à l'amplitude du réchauffement rapide). Elle confirme une forme très différente de la température de surface déduite des isotopes de l'air par rapport au profil – en particulier, la phase froide du DO 19 n'est pas un plateau, mais un coup de froid court suivi d'un réchauffement progressif (Fig. 2).
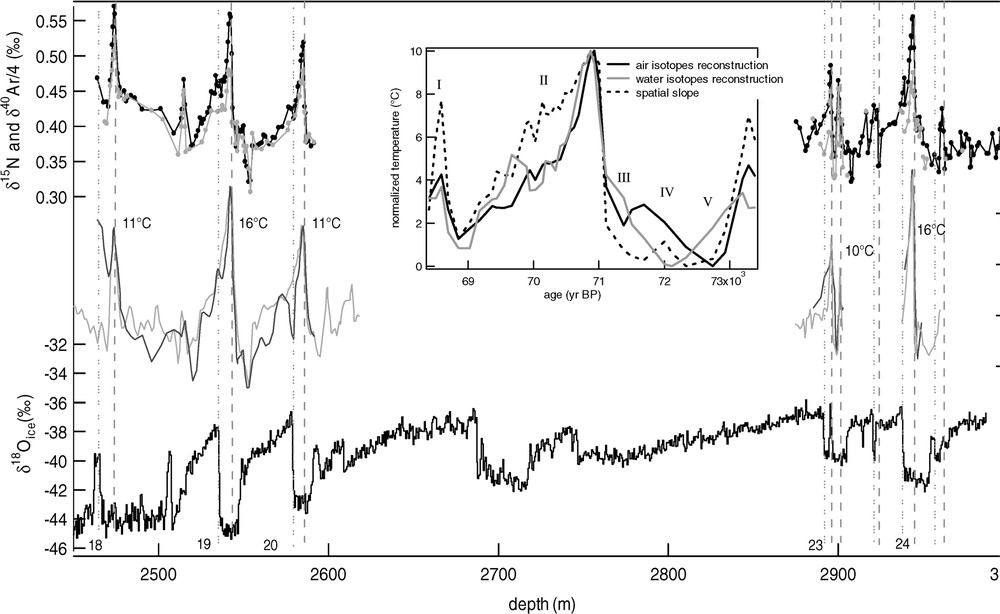
DO 18, 19, 20, 23 and 24 in the NorthGRIP ice core. Top: N (black) and Ar (grey) records. Middle: measured and smoothed over a three points running mean (black) and modelled [16] (grey) with a temperature increase of 11, 16, 11, 10 and 16 °C for DO 18, 19, 20, 23 and 24. Bottom: on the NorthGRIP ice core [37]. The dotted/dashed lines stand for the rapid events recorded in the ice ()/gas (N and Ar) records. The systematic depth shift between the temperature increase recorded in the profile (rapid increase) and the gas N or Ar profile (peaks) comes from the air entrapment around 80 m under the top of the ice sheet (at each depth level, the ice is older than the entrapped gas). On an age scale, both signals occur at the same time. Centre: temperature evolution over DO 19: normalized temperature scenario that best fits the N and profile when used as input for the firnification and heat-diffusion model (black solid line); normalized temperature scenario obtained from the inversion of and δD measurements in NorthGRIP (grey solid line) using relationships between water isotopes and source and site temperatures classically applied over central Greenland [35].
DO 18, 19, 20, 23 et 24 dans la carotte de NorthGRIP sur une échelle de profondeur. En haut : N (noir) et Ar (gris). Milieu : signal déduit des mesures, lissé par une moyenne glissante sur trois points (noir) et modélisé [16] (gris) avec des augmentations de température de 11, 16, 11, 10 et 16 °C pour les DO 18, 19, 20, 23 et 24. En bas : sur la carotte de NorthGRIP [37]. Les lignes en pointillés/tiretés indiquent les événements rapides enregistrés dans la glace ou dans le gaz (N et Ar). Le décalage systématique entre l'augmentation de température enregistrée dans le profil de O de la glace (augmentation rapide) et dans le profil N ou Ar du gaz (pics) est relié au piégeage de l'air dans la glace à 80 m sous la surface de la calotte (c'est-à-dire que, à une profondeur donnée, l'air est plus jeune que la glace). Sur une échelle d'âge, les deux signaux sont en phase. Au centre : évolution de la température pour le DO 19. Ligne continue noire : scénario de température normalisée qui reproduit le mieux les profils de N et de Nexcès quand il est utilisé comme entrée du modèle de densification et de diffusion de la chaleur ; ligne continue grise : scénario de température normalisée, obtenu par inversion des mesures de Oice et de δD à NorthGRIP en utilisant les relations classiques entre isotopes de l'eau et températures de site et de source au Groenland [35].
Finalement, nous présentons une compilation des différents résultats existants sur les DO au Groenland à partir des isotopes de l'air et de l'eau (Fig. 3). Une telle comparaison montre la difficulté de décrire de façon générique un DO. Les DO 12 et 19 semblent ainsi les plus proches sur la base de leur enregistrement au Groenland – (i) refroidissement progressif pendant la phase chaude et (ii) petit réchauffement abrupt 2000 ans après le réchauffement principal –, mais les enregistrements marins montrent que, si le réchauffement abrupt du DO 12 est précédé par une décharge d'icebergs depuis la calotte laurentienne (événement de Heinrich), aucune décharge massive n'a été enregistrée avant le réchauffement abrupt du DO 19 [10]. Il semble donc difficile de relier directement le scénario de température de surface des DO avec les décharges d'icebergs dans l'Atlantique nord.
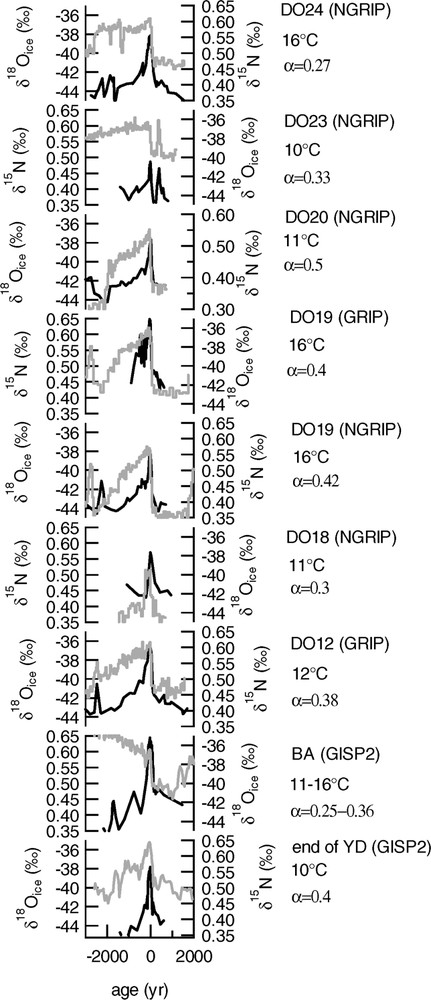
Comparison of different DO in GRIP, GISP2 and NorthGRIP: N (black, [30–32,39,40]) and (grey) records. On the right, we indicate the amplitude of the main temperature increase. α is the temporal slope calculated over this main increase: . The original timescales are from Johnsen et al. [22] for GRIP, Hammer and Meese [19] and Meese et al. [36] for GISP2, and NorthGRIP community paper [37] for NorthGRIP. We then attribute an age of 0 for the N maximum and the beginning of the plateau. Note that the NorthGRIP timescale is probably incorrect over DO 19: after adjusting the N and profiles over the main warming (age 0), the small event occurring 2000 years later has not the same age in the gas and in the ice records, which is incoherent.
Comparaison de différents DO à GRIP, GISP2 et NorthGRIP : N (noir [30–32,39,40]) et (gris). À droite, l'amplitude pour les réchauffements majeurs est indiquée. α est la pente temporelle calculée pour l'augmentation principale : . L'échelle de temps est de Johnsen et al. [22] pour GRIP, Hammer et Meese [19] et Meese et al. [36] pour GISP2, et NorthGRIP Community Paper [37] pour NorthGRIP. Nous avons attribué un âge de 0 pour le maximum de N et le début du plateau de . Il faut noter que l'échelle de temps de NorthGRIP est probablement fausse sur le DO 19 : après un ajustement des profils de N et sur le réchauffement principal (âge 0), le petit événement qui a lieu 2000 ans plus tard n'a pas le même âge dans l'air et dans la glace, ce qui est incohérent.
1 Introduction
The first evidence for the succession of rapid climatic events in the northern hemisphere during the last glacial period has been provided by the Greenland ice cores [9,21]. Records for that rapid climatic variability were then obtained in numerous marine [2,10,27] and continental archives [5,15,45] in the northern hemisphere and associate events are depicted in the Antarctic ice cores [1]. Despite this sum of information at lower latitudes, Greenland ice cores still provide the more detailed and continuous climatic record of the last glacial period. Among other things, (i) water isotopes profiles (Fig. 1) depict surface-temperature changes [21], (ii) ice chemical contents reflect changes in atmospheric circulation and source conditions [13], and (iii) greenhouse gases concentration (CH4, N2O) fluctuations parallel temperature changes [12]. The water isotopes enable one to clearly describe the succession, over a DO, of a rapid /temperature increase, followed by a warm period (interstadial) and a slower /temperature decrease toward a cold period (stadial).
The conventional reconstruction of the temperature profile is based on the spatial linear relationship observed today between surface temperature and ice isotopic composition [8] with a slope defined by: . Applying this relationship to reconstruct the past temperature evolution implicitly assumes that the spatial and temporal relationships are similar and that the condensation temperature is linked to the surface one with the same relationship back in time. However, the evaporative origin and the seasonality of precipitation have likely varied during the succession of glacial and interglacial periods through the influences of obliquity and ice-sheet extent [4,11,24,26,46].
Another palaeothermometry method was developed from the direct temperature measurements in the borehole and it is based on the heat equation inversion. The most important result of this method for the glacial period is the estimate of the last glacial maximum temperature to less than today in central Greenland, while the conventional temperature estimate from the water isotopes gave a 12 °C difference [6,7,22]. This dramatic underestimation was attributed to the seasonality of the precipitation that is displaced toward summer during the last glacial maximum because of the ice-sheet extent reducing the winter moisture advection to Greenland [11,26,44]. The borehole method is independent of the different biases affecting the water isotopes temperature reconstruction. However, because of heat diffusion, the temporal resolution of the reconstructed temperature profile is limited and cannot resolve the temperature scenario of the rapid events during the last glacial period.
More recently, an alternative method has been proposed to infer the amplitude of the rapid temperature changes [39,40]. It takes advantage of the thermal diffusion that fractionates the atmospheric gases in the firn (constituted of porous snow in the upper 50–120 m of the polar ice-sheet before the pore close-off). The precise temperature estimate requires a high analytical precision, an accurate calibration of the thermal effect and the use of a heat-diffusion model to link the thermal gradient in the firn to the surface temperature change [23]. This method has already been applied to different rapid climatic events leading to the same conclusion than the one drawn from the borehole temperature measurements: the conventional use of the water isotopes underestimates by a factor 1.5–2 the amplitude of the rapid temperature changes during the last glacial [32,33,39,40].
We concentrate here on this new method to study the temperature evolution over DO in Greenland. We first describe the method and its potential to determine precisely the amplitude of the rapid temperature changes. We then apply it to the surface temperature reconstruction over sequences of DO at the onset of the glacial cycle at NorthGRIP. Finally, we present a comparison of rapid events on which air isotopic measurements were performed to compare the temporal evolution of surface temperature during a variety of DO at the beginning, middle or end part of the last glacial period.
2 An overview of the method
The repartition of air isotopes before enclosure at the bottom of the firn is imposed by thermal and gravitational fractionations if the gas species have a constant atmospheric isotopic composition. The nitrogen isotopic composition can possibly show temporal variations through biological processes (denitrification). However, since the residence time of N2 in the atmosphere is more than 107 years, even the large consumption of nitrogenous fertilizer during recent time does not modify the atmospheric N [42]. Argon is inert with respect to the biogeochemical cycling and therefore, it has been shown that the atmospheric Ar was constant over the last million years [42].
The gravitational fractionation is simply imposed by the gravity field on the Earth, g. It drives the heavier isotopes towards the bottom end resulting in the barometric equation: , where z is the depth, R the gas constant and T the mean firn temperature. More interestingly, during a rapid warming, the top of the firn becomes warm, while the bottom end remains cool creating a thermal gradient. The coldest bottom end is enriched in heavier isotopes according to and ( and are the thermal diffusion coefficients associated to nitrogen and argon isotopic mixings [17,18]). The positive anomaly is then recorded during the pore close-off.
The N and Ar measurements in the air enclosed in the ice hence result from two effects. To quantify the thermal effect, two methods were proposed. The first method consists in isolating the thermal fractionation from the gravitational one [40]. Indeed the combination of N and Ar gives access to the , directly proportional to the firn thermal gradient. Because of heat diffusion, the firn thermal gradient is smaller than the surface temperature change. A model of heat diffusion in the firn [16,38] is therefore needed to determine the amplitude of the surface temperature change. The second method [32,33] is based on the development of a powerful firnification and heat-diffusion model [38] predicting the firn depth evolution as well as its instantaneous thermal gradient. It should reproduce both the thermal and gravitational signals. The surface temperature scenario used as input is then adjusted so that the model reproduces the measured N signal.
Here, we use the first method owing to a high analytical precision both on N and Ar measurements (respectively 0.006‰ and 0.025‰). This method offers the advantage of ignoring uncertainty in the gravitational signal influenced by changes in accumulation rate and mean temperature [30–32] still badly constrained (uncertainty up to a factor of two in the accumulation rate [44]). Our approach should be almost accumulation-rate independent [30]. Note that the accumulation rate influence on the close-off depth slightly modifies the heat diffusion length but such influence is negligible (the uncertainty in accumulation rate can create a 10% uncertainty in the heat-diffusion length and consequently a maximum error of 0.3 °C in the inferred temperature increase).
3 Results
Our N and Ar measurements were performed on the newly drilled NorthGRIP ice core [37] following the analytical procedure previously described [28,29]. Previous studies have already depicted the rapid changes and their amplitudes during the deglaciation (Bølling Allerød, Younger Dryas [39,40]) and full glacial [30]. We therefore concentrated on the glacial inception captured by the new NorthGRIP ice core (DO 23 and 24, whose rapid temperature increases occurred at and , respectively [37]) and on the Marine Isotopic Stage 4, characterized by a rapid growth of the ice sheet [41] ( to , DO 18, 19 and 20, whose rapid temperature increases occurred at −78.4, −74.5, and , respectively [37]).
Fig. 2 depicts the N and Ar records over the two climatic sequences of interest. As expected, the gas records show a positive/negative anomaly corresponding to each warming/cooling. Because of the close-off depth and of the progressive thinning with increasing depth, the warming is recorded a few meters deeper in the gas record than in the one (i.e., at each depth level, the air is younger than the surrounding ice, since it is trapped at the bottom of the firn; note that when the water and air isotopic profiles are drawn on a same timescale, the rapid temperature increase is recorded simultaneously as a rapid increase and sharp N and Ar peaks). The thermal anomalies are characterized by smallest amplitude for Ar/4 than for N, in agreement with the different thermal diffusion coefficients for the different isotopic pairs [17,18]. Using this property, the Nexcess evolution (Fig. 2) can be calculated and a firnification and heat-diffusion model [16] is adjusted to reproduce the amplitude of the main rapid warming events. The NorthGRIP surface temperature is found to have increased by 10 °C over DO 23, 11 °C over DO 18 and 20, and up to 16 °C over DO 19 and 24. The associated uncertainty is of 2.5 °C, taking into account the analytical and the dating errors [30] (we suppose that the timing of the temperature increase can be twice more rapid or twice slower than suggested by the proposed timescale [37] because of the accumulation-rate uncertainty). The choice of a different firnification and heat-diffusion model does not influence our results (not shown here).
We clearly confirm that the spatial relationship applied to the abrupt changes of surface during the last glacial period underestimates the amplitude of the rapid temperature changes by a factor, , of 1.3 (DO 20) to 2.4 (DO 24) ( over the rapid warming, ). It moreover suggests strong atmospheric and/or sea-ice feedbacks around Greenland to explain a 16 °C temperature increase in 100 years, triggered by a change in the thermohaline circulation mode as classically suggested for the occurrence of DO [14]. Simulations with intermediate complexity models can only produce a maximum 8 °C change [14].
The use of air isotopic measurements can moreover be extended to the reconstruction of the complete temperature history over a sequence of DO if a detailed record of N and Ar is available. Indeed, even during the glacial period, the and the surface temperature records do not show the same apparent temporal slope over the different DO ( for DO 20, 0.4 for DO 19 and around 0.3 for DO 18, 23, 24). As a consequence, the proportionality is probably neither respected inside a DO and the surface temperature scenario should not parallel the record. To favour this argument, deuterium excess measurements have been performed over different Greenland ice cores [20,25,31]. They suggest that the source for precipitation largely varied between the cold and the warm phases of a DO, such influencing as well the final .
Some small but significant N and anomalies have no clear counterpart in the record. We suggest however that they should be the result of rapid temperature changes. Sensitivity studies driven with a firnification and heat-diffusion model suggest that the mean firn temperature has a stronger influence on the gravitational signal of N than the accumulation rate. We have used the firnification and heat-diffusion model [16] in a slightly different way than previously described to best reproduce the N and measurements not only over the rapid temperature increase but over the entire DO [31]. This method has been applied to DO 19, where the highly detailed measurements provide enough constraints for this temperature reconstruction (Fig. 2). The reconstructed surface temperature has a significant different shape than the profile. The stadial preceding DO 19 (V) is not simply a cold plateau, but a short temperature minimum, followed by a slow warming (IV) before a last cold dip (III). After the main 16 °C increase, our N profile imposes that the temperature should have decreased relatively fast (II). Such a scenario was independently confirmed by the combined use of the and δD measurements that enables to account for the source temperature influence (Fig. 2, [31]). The stability of during cold phases appears to be an artefact linked to a site-temperature/source-temperature compensation. Note however that this last method does not take into account the seasonality of precipitation and could therefore not reproduce the full amplitude of the temperature change [35].
Finally, the palaeothermometry method based on air isotopic measurements requires a precise analytical setup and the development of a precise firn modelling tool. However, this method provides unique results on the temperature scenario for rapid events that neither the water isotopic measurements nor the borehole temperature measurements can resolve. Using this method enables us to propose a new shape for the high-latitude-temperature scenario over a DO that should be considered for further modelling studies.
4 Comparison of DO events: N and
Using the N profile over a DO provides a temperature evolution without the different biases affecting the profile. Since 1998, measurements of N and Ar were performed over the different DO in central Greenland to first infer the amplitude of the major temperature increases. We present here a synthesis of the published N and profiles over DO as well as the inferred temperature changes to describe the variety of DO in Greenland (Fig. 3).
We show a wide variety of DO characterized by rapid warming events ranging from 10 to 16 °C both in Summit (GRIP and GISP2) and in NorthGRIP. The temporal slope between water isotopes and the reconstructed surface-temperature variations confirms that the profile cannot be directly used to reconstruct the surface temperature scenario over Greenland: the temporal slope varies from 0.3 to 0.5 over the DO presented here. Finally, comparing the and N profiles over the different DO leads to the conclusion that their shapes and then the transient surface-temperature evolutions differ from event to event (unfortunately, because of the lack of data, we cannot propose a definite temperature scenario from air isotopic measurements). As a conclusion, describing a ‘typical’ DO through a general scheme is not an easy task.
The last point can be deepened by comparing on the one hand DO 12 (GRIP) and 19 (NorthGRIP) and, on the other hand, DO 18. DO 12 and 19 depict similar and N profiles. As the is biased by hydrological cycle processes, we concentrate on the N one, which suggests a short and small cooling before the main rapid increase (also recorded in the profile ([30,31], III in Fig. 2). After the main peak, the N decreases smoothly and a small peak, corresponding to a rapid warming event, occurs 2000 yr after the main temperature increase (I in Fig. 2). On the contrary, DO 18 shows a rapid temperature increase followed only 200 years later by a rapid temperature decrease according to the and N profiles. Even if it is highly tempting to suggest, on the basis of common Greenland temperature patterns for DO 12 and 19, a common climatic mechanism, things are more complicated. Indeed, the marine records [3] place the onset of DO 12 after a large iceberg discharge from the Laurentide, the Heinrich event 5. Such event is recorded as a layer rich in ice rafted debris (IRD) and poor in foraminifera between 40°N and 55°N in the Atlantic [2]. According to the same marine records, DO 19 is not preceded by any Heinrich event, ruling out the association of a Heinrich event with a DO depicting the Greenland characteristics of DO 12 or 19. DO 19 is most probably followed by such an event (Heinrich event 6 occurs during the maximum of ice volume at the end of the Marine Isotopic Stage 4, roughly corresponding to DO 18, Fig. 1, [3]). In a similar way, if we expect DO 12 and 18 to be similar (based on the existence of a Heinrich event preceding the rapid surface-temperature increase), the air isotopic measurements performed over those events show that a simple association between the shape of a DO and the presence of a Heinrich event is not straightforward.
To end up with the variety of rapid events, the specificity of DO 23 and 24 should be highlighted. Their and N profiles depict high-frequency surface temperature variations (i.e., rapid cooling during interstadials) absent from the other profiles presented here. Such decadal to centennial climatic variability does not seem to be recorded in any marine records (no IRD signal [34]), suggesting that no strong icebergs discharges occurred at that time. We therefore suggest that this rapid climatic variability, occurring during interstadials, is most probably linked to hydrological-cycle processes at that particular climatic period, the glacial inception. It once again confirms that no common scheme can be deduced for the Greenland temperature evolution over a DO and that a direct link with the icebergs discharges as the only modulator of the thermohaline circulation activity is not obvious.
5 Conclusion
We presented here a recently developed palaeothermometry method that applies to the rapid climatic variability recorded in the Greenland ice cores. Whereas (i) the conventional method based on the profile is biased by hydrological processes and (ii) the borehole temperature inversion is unable to capture the rapid climatic variability, the measurements of air isotopes (nitrogen and argon) permit to infer the amplitude of rapid surface-temperature changes as well as the shape of the temperature scenario over DO. We illustrated this method on the recently drilled NorthGRIP ice core and found warming intensities of 10 °C for DO 23, 11 °C for DO 18 and 20 and up to 16 °C for DO 19 and 24. The temperature scenario over DO 19 could also be reconstructed and clearly confirmed that the profiles in the Greenland ice cores do not fully capture the shape of rapid temperature evolutions. Finally, on the basis of a complete comparison of the existing N records of DO in Greenland, we conclude to a wide variety of DO with different shapes and amplitudes as well as different links with the North Atlantic climatic patterns. We especially show that no clear association can be depicted between the existence of a Heinrich event or of another iceberg discharge event and the following amplitude and shape of a DO in Greenland. The climate over Greenland during the last glacial was then subjected to many different influences, such as the polar atmosphere and the extension of northern ice sheets that modifies the hydrological cycle. More definite conclusion should be drawn when a complete N/Ar record is performed over the full glacial period in the NorthGRIP ice core.
Acknowledgements
This work was supported by the French CNRS (PNEDC), the CEA and the Balzan Foundation. We thank the NorthGRIP and GRIP participants for their collaborative efforts. Bénédicte Minster helped with air isotopic measurements. A.L. is funded by a Lady Davis Fellowship and the Israeli Science Foundation.