

Version française abrégée
1 Introduction
Notre étude porte sur l'analyse des déplacements observés sur la zone de la gare Saint-Lazare, lors des travaux de réalisation hors eau de la gare souterraine Haussmann–Saint-Lazare du RER E. Les pompages, nécessaires lors des travaux, ont entraîné un faible tassement des terrains sus-jacents. L'amplitude et l'extension spatiale de tels déplacements verticaux ne sont pas facilement détectables avec les méthodes d'auscultation classiques (nivellement, mesures géologiques, géotechniques...), à cause de leur coût important et parce qu'elles ne s'adaptent pas toujours très bien aux obstacles urbains et ne donnent que des résultats locaux.
La technique d'interférométrie différentielle radar permet d'éviter certains de ces problèmes. Elle est utilisée depuis de nombreuses années pour un grand nombre d'applications géophysiques [14], incluant des subsidences de terrains et, en particulier, plus récemment, des subsidences en zone urbaine [1,6,7,10,11,15]. Cette méthode requiert l'utilisation d'images de radar à synthèse d'ouverture, acquises sur une même zone à différentes dates, qui sont combinées par deux pour construire des cartes de déformations. L'avantage d'étudier de larges zones urbaines comme Paris est que la cohérence y est préservée sur de longues durées, permettant ainsi de surveiller des mouvements lents. Le problème principal rencontré dans les villes est dû aux variations de conditions atmosphériques entre les deux acquisitions d'images utilisées pour former un interférogramme [8,9,18].
Notre précédente étude nous avait permis de détecter par interférométrie différentielle une zone de subsidence près de la station [7]. Nous montrons ici que l'interférométrie différentielle radar permet de suivre l'évolution temporelle des déplacements verticaux sur cette zone, et permet de distinguer trois phases principales directement liées à l'activité des pompages sur cette zone. La remontée des terrains a également été observée par interférométrie par Le Mouélic [11,12].
2 Déplacements observés par interférométrie différentielle radar
Nous avons utilisé une quarantaine d'images radar acquises par les satellites ERS-1 et ERS-2 entre 1993 et 1999. La contribution topographique dans les différents interférogrammes différentiels calculés a été éliminée à l'aide d'un MNT au pas de 25 m fourni par l'IGN. Tous les couples ont une ligne de base perpendiculaire inférieure à 100 m, afin d'éviter les effets topographiques résiduels et limiter la perte de cohérence géométrique.
Les acquisitions d'ERS-1 et ERS-2 permettent une bonne couverture temporelle des travaux de construction, excepté durant la période de subsidence : aucune image n'est disponible entre novembre 1993 et avril 1995 ; lorsque les pompages débutent, il est donc impossible de détecter avec précision le début du phénomène de subsidence.
Une des limitations principales de la méthode interférométrique provient de la variation des conditions atmosphériques entre les acquisitions d'images, qui peut introduire de larges variations de phase dans les interférogrammes résultants et être faussement interprétée comme de la déformation. Nous avons montré, dans une précédente étude, que la corrélation d'interférogrammes indépendants permettait d'éviter ce problème [7]. Grâce au nombre important d'images disponibles pour cette étude, nous avons ici la possibilité d'éliminer les couples avec des artefacts troposphériques importants. Nous pouvons, par ailleurs, réduire les distorsions atmosphériques en additionnant des interférogrammes indépendants [17].
Les interférogrammes différentiels indiquent clairement quatre périodes distinctes. La Fig. 1 donne un exemple de quatre interférogrammes correspondant à ces périodes. Le sens de variation de la phase, donné par la variation de la couleur (une augmentation ou une diminution vers le centre de la zone concernée) nous renseigne sur le type de déplacement : on peut ainsi discriminer une subsidence d'une remontée. Le premier interférogramme (Fig. 1a) correspond à la période de stabilité du sol parisien, avant que les pompages ne commencent : aucun signal significatif ne peut être observé. Sur le second (Fig. 1b), encadrant le début de pompages, on peut facilement détecter une tâche bleue localisée près de la gare Saint-Lazare : il s'agit donc ici d'une subsidence des terrains, liée au commencement des pompages. L'interférogramme correspondant à la période de pompage intensif et donc pendant les travaux de constructions d'Eole (Fig. 1c) ne montre à nouveau aucune variation de phase, confirmant ainsi qu'aucun déplacement de surface n'a eu lieu durant cette période. Le dernier (Fig. 1d) révèle une tache rouge à l'endroit même où nous avions observé la tâche bleue, et indique cette fois une remontée du sol, liée à la fin des pompages, aux environs de la gare Haussmann–Saint-Lazare, dont la construction est achevée.
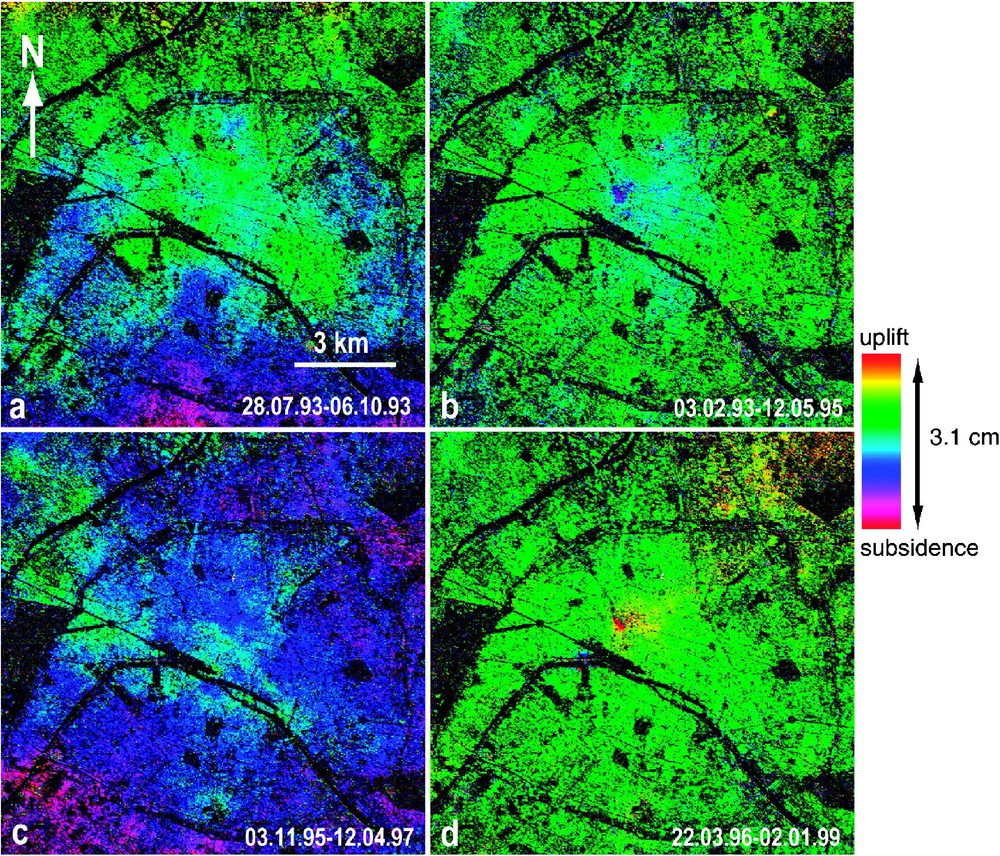
Differential interferograms covering four different periods. Dates of image acquisition are indicated. One complete colour cycle corresponds to 3.1 cm of vertical displacement. (a) Differential interferogram in 1993 showing no vertical displacements before the construction work. (b) Differential interferogram covering the period 1993–1995, showing the cumulate vertical displacement at the beginning of the construction work. (c) Differential interferogram showing no vertical displacement during the water pumping and the construction work. (d) Differential interferogram showing a vertical uplift due to the end of the construction work, and the slow recharge of the water tables (the water pumping stopped by mid 1997).
Interférogrammes différentiels couvrant quatre périodes différentes. Les dates des images radar sont indiquées. Un cycle complet de couleur correspond à 3,1 cm de déplacement vertical. (a) Aucun déplacement n'est visible avant les travaux de construction. (b) Interférogramme différentiel couvrant la période 1993–1995, faisant apparaître des déplacements au début des travaux. (c) Interférogramme différentiel montrant une période de stabilité durant les pompages et les travaux. (d) Interférogramme différentiel montrant une remontée due à la fin des travaux et la lente recharge des nappes.
Afin de déterminer l'étendue spatiale et l'ampleur des phénomènes, des cartes de déplacement total lors de la subsidence et lors de la remontée ont été construites (Fig. 2). Pour ce faire, nous avons utilisé, dans chaque cas, quatre interférogrammes indépendants, qui ont été dans un premier temps déroulés, en convertissant l'information de phase en déplacement vertical, puis sommés, afin de réduire le niveau de bruit atmosphérique. Chaque frange (cycle complet de couleur) dans un interférogramme différentiel représente 28 mm de déplacement le long de la ligne de visée du radar, soit 31 mm de déplacement vertical (nous faisons ici l'hypothèse que les déplacements sont purement verticaux). Grâce à cette procédure d'addition, la précision obtenue est de 4 mm. L'amplitude maximale atteinte pour la subsidence est de 1,7 cm ; elle est de l'ordre de 1,6 cm pour la remontée. La comparaison de ces amplitudes nous montre que le phénomène de remontée du sol compense celui de la subsidence, et montre ainsi la réversibilité de ces déplacements. Concernant l'étendue spatiale, on peut remarquer que la subsidence couvre une zone d'environ 800 m de large sur 1200 m de long, alors que la remontée concerne une zone un peu plus importante de 1800 m sur 2500 m. La forme générale de la zone de déformation est une ellipse d'axe WSW–ENE. La zone de déplacement maximal est formée de deux pseudo-ellipses plus particulièrement visibles sur la carte de remontée : l'une est allongée, orientée NNW–SSE. L'autre, plus petite, est située plus à l'est.
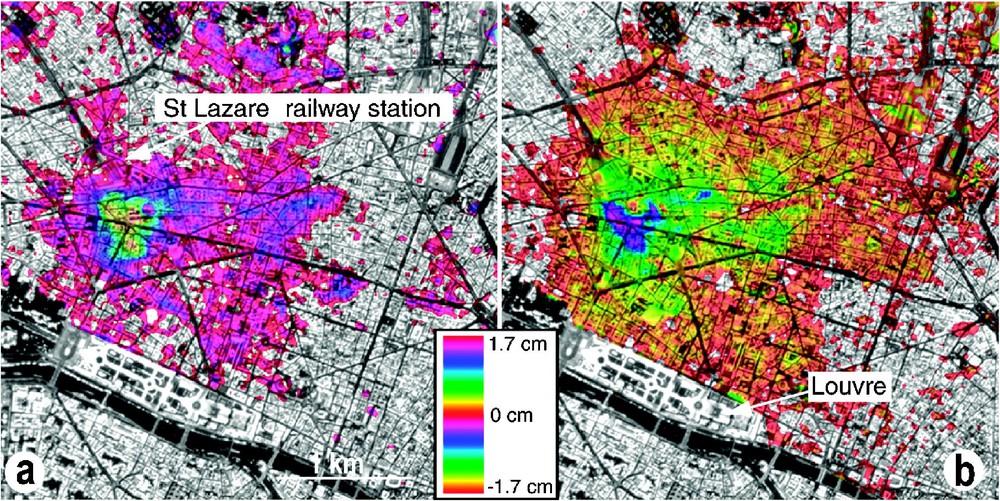
(a) Map of cumulate subsidence due to the beginning of water pumping: Intensity Hue Saturation composition using an aerial photograph of IGN (©IGN Paris 2001. Poster Paris ISSN BD Ortho®). (b) Map of cumulate uplift due to the end of water pumping and the slow recharge of the nappe (same HIS composition) (processing done by UMLV).
(a) Carte de subsidence totale due au début des pompages en eau. Composition intensité teinte saturation utilisant une photo aérienne de Paris de l'IGN (©IGN Paris 2001. Poster Paris ISSN BD Ortho®). (b) Carte de la remontée totale due à la fin des pompages et à la lente recharge de la nappe (même composition ITS).
Comme cela a été mentionné précédemment, aucune analyse précise de la subsidence ne peut être menée, en raison de l'absence de données en 1994. En revanche, concernant la période de remontée, nous pouvons examiner l'évolution des déplacements liés à la recharge en eau, durant la période juillet 1997–novembre 1999. Il apparaît que la remontée s'effectue en deux phases, avec des zones différentes atteintes successivement. La remontée débute entre novembre 1997 et janvier 1998. L'étendue des déplacements demeure modeste et localisée au-dessus de la zone de pompages. Le signal de déplacement semble stable jusqu'en juillet 1998, puis se propage vers le sud-ouest : on observe une remontée rapide, entre juillet et août 1998, d'une zone centrée approximativement à l'intersection de la rue Tronchet et de la rue des Mathurins, et qui dessine la figure géométrique sous-jacente à la remontée, à savoir une ellipse allongée orientée NNW–SSE. La surface de remontée augmente encore ensuite faiblement jusqu'en octobre 1998 : à cette date, l'extension des déplacements semble avoir atteint sa valeur finale.
3 Analyse des données de piézométrie et de comparaison de nivellement
Le suivi de 87 piézomètres entre novembre 1990 et juin 2000 permet de mettre en évidence les fluctuations des surfaces des nappes des alluvions modernes, du Lutétien et de l'Yprésien, qui composent l'aquifère multicouche du bassin de Paris, pendant toute la durée des travaux. Bien que les pompages SNCF aient été effectués dans la nappe du Cuisien (Yprésien), nous ne disposons que de quatre valeurs de piézomètres du Cuisien. Compte tenu de l'importance du réseau de piézomètres du Lutétien et de l'effet de drainance entre les nappes du Lutétien et de l'Yprésien [3,13], l'étude piézométrique est essentiellement effectuée sur le Lutétien.
Le graphique de suivi (Fig. 3) indique que la nappe des alluvions ne connaît aucune variation remarquable : cette nappe ne serait pas affectée par les pompages. Au contraire, les nappes du Lutétien et de l'Yprésien accusent une forte baisse (supérieure à −20 m) en mai 1994 et, inversement, une forte hausse, d'amplitude similaire, pour la majeure partie entre juillet et août 1998 (cette hausse débute pour certains piézomètres à partir de mars 1998). Toutes ces variations sont clairement d'origine anthropique : les variations observées en juillet 1991, juin 1992 et avril 1993 correspondent à des essais de pompages, et les périodes de brusques variations correspondent aux périodes de début et arrêt des pompages inhérents au chantier, afin d'abaisser la nappe pour effectuer le gros œuvre à sec.
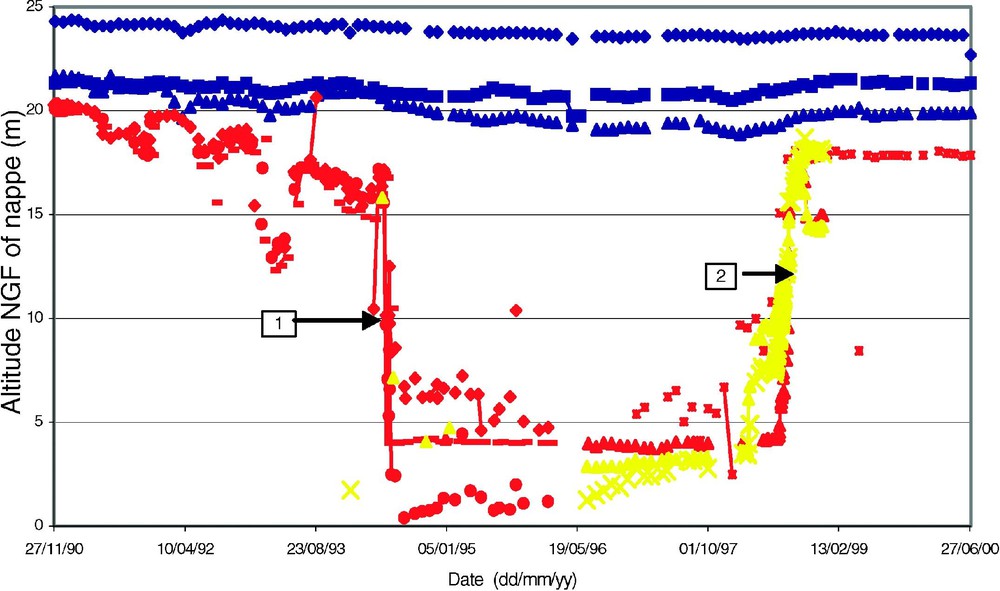
Piezometric monitoring of the different aquifers from November 1990 to June 2000. In blue: alluvium, in red: Lutetian; in yellow: Ypresian. 1: May–June 1994, 2: June–August 1998.
Suivi piézométrique des aquifères des 8e et 9e arrondissements : alluvions modernes, Lutétien et Yprésien de novembre 1990 à juin 2000. En bleu : alluvions, en rouge : Lutétien, en jaune : Yprésien. 1 : mai–juin 1994, 2 : juin–août 1998.
Nous avons également analysé 626 points de comparaison de nivellement. Ces points sont localisés dans un périmètre restreint autour de l'emprise de la nouvelle gare (limitation contractuelle de suivi 50 m à l'extérieur de l'emprise au sol du chantier souterrain).
Le suivi du nivellement de précision met également en évidence trois périodes majeures (Fig. 4) : de mai 1994 à avril 1995, une période de forte subsidence centimétrique avec un palier ; une période de stabilité, d'avril 1995 à juin 1998 ; enfin, une période de remontée, de juin à octobre 1998.
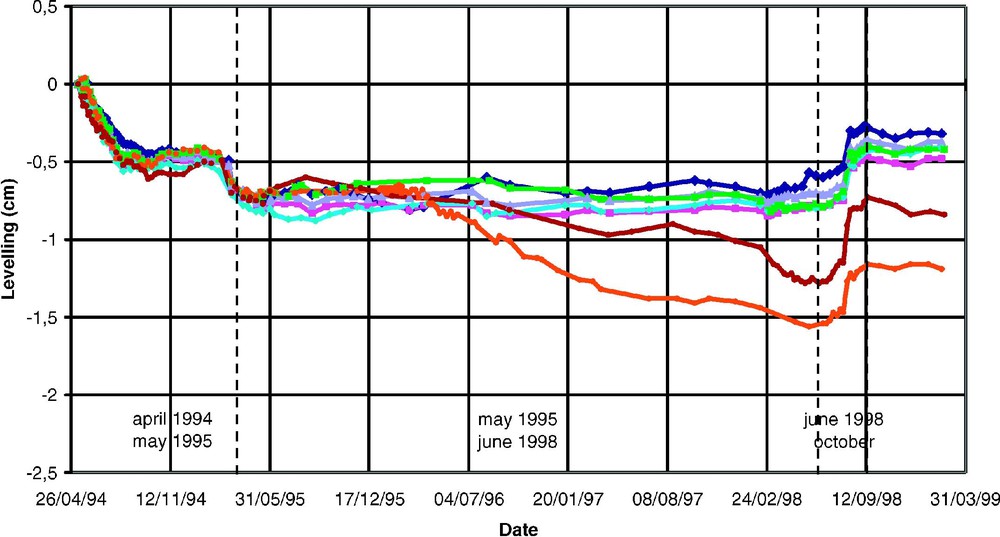
Evolution of several levelling points.
Évolution de quelques points de nivellement.
4 Discussion et conclusion
La confrontation des résultats obtenus par interférométrie différentielle avec les données de nivellement et les données piézométriques montre un bon accord et une bonne complémentarité entre ces différentes mesures.
Les mesures piézométriques confirment les importantes fluctuations de l'aquifère multicouche du bassin de Paris, dues aux pompages pendant la période des travaux. On note que les différentes périodes de fluctuation des nappes du Lutétien et de l'Yprésien (brusques variations, puis stabilité entre juin 1994 et mars 1998) enregistrées par les piézomètres sont sensiblement identiques à celles observées par interférométrie, notamment la forte hausse entre juillet et août 1998. Les points de comparaison de nivellement montrent également les mêmes périodes de variations.
Concernant l'extension spatiale du phénomène, les données piézométriques et interférométriques sont en bon accord, comme en témoigne la superposition des cartes de déformations obtenues par interférométrie et les variations de surface piézométrique (Fig. 5).
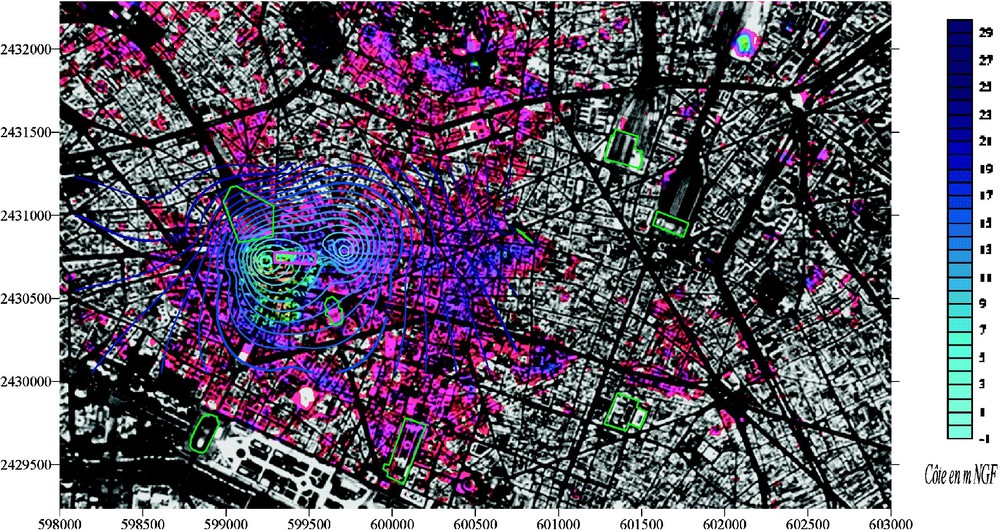
Superimposition of the map of subsidence obtained with DINSAR and piezometric surface of June 1994.
Superposition de la carte de subsidence obtenue par DINSAR et de la surface piézométrique de juin 1994.
Il s'avère cependant que l'interférométrie différentielle offre ici une meilleure estimation de l'étendue spatiale des phénomènes que le nivellement. Les données de nivellement enregistrent bien les variations topographiques observées par interférométrie, mais il apparaît clairement que la base du nivellement (localisée à plus de 50 m autour de l'emprise de la gare) est en fait située dans la zone en subsidence, comme le montrent les cartes de déplacements obtenues par interférométrie, étendue sous-estimée par le nivellement.
Par ailleurs, la comparaison entre les diverses données piézométriques, interférométriques et de nivellement permet de déterminer quelle est la nappe responsable des déplacements. Une remontée de la nappe du Lutétien n'entraîne pas de remontée de la surface (pas d'influence sur le nivellement), alors qu'une remontée de la nappe de l'Yprésien conduit à un déplacement de surface (Fig. 6).
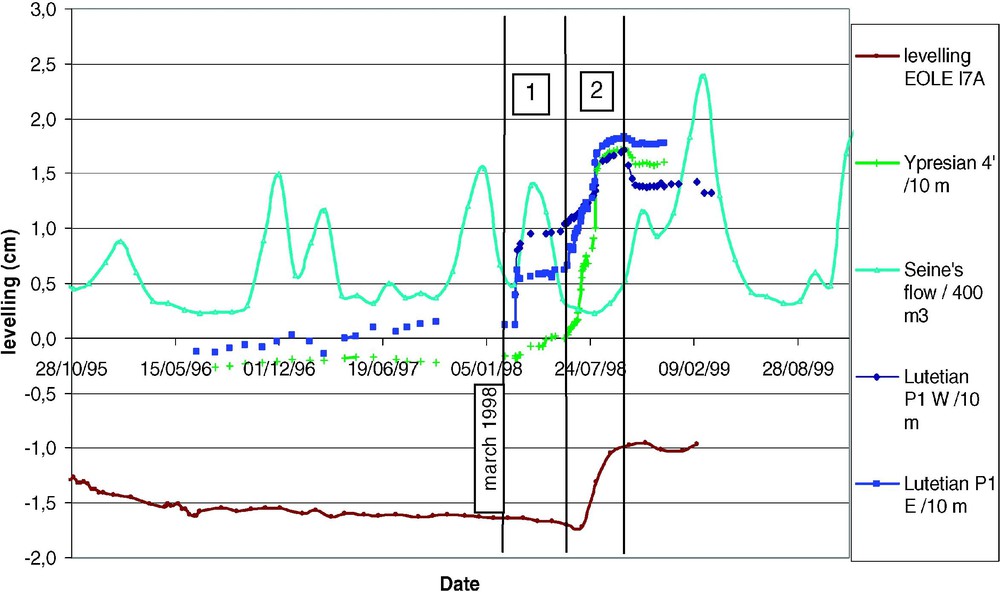
Comparison between levelling and piezometry: 1, rise of the Lutetian nappe; 2: rise of the Ypresian nappe.
Comparaison du nivellement et de la piézométrie : 1, remontée de la nappe du Lutétien ; 2, remontée de la nappe de l'Yprésien.
Cette étude des variations topographiques en contexte urbain à partir d'imagerie radar a permis de tester et valider la technique d'interférométrie différentielle en se focalisant sur une thématique de risques urbains : les affaissements liés aux pompages. La comparaison entre les diverses données piézométriques, interférométriques et de nivellement permet également de proposer des raisons du mécanisme de recharge de l'aquifère multicouche du bassin de Paris, ce qui pourrait contribuer à définir de nouvelles normes lors des pompages.
Nos travaux se poursuivent actuellement avec l'utilisation de la technique interférométrique plus récente dite des « points stables » (Permanent Scatterers) [4,5], qui s'avère prometteuse [2,16]. Le principe de cette technique réside dans la détection et l'enregistrement des déplacements du sol sur une grille de points (les PS). Elle permet d'utiliser toutes les images radar disponibles, ce qui assure une grande continuité et une haute répétitivité temporelle, et également de s'affranchir de la composante atmosphérique, augmentant ainsi la précision.
1 Introduction
Natural and anthropogenic hazards in urban areas will be a major concern in the next few years, and require a complete monitoring of cities in order to prevent possible deformation they may encountered, especially during construction works. Comprehension of these mechanisms is necessary to better prevent such urban risks and at least better protect population and buildings.
This study focuses on the construction of the Haussmann–Saint-Lazare–Condorcet underground railway station (French railway company) for the EOLE line. The important water pumping, done to keep the works in dry conditions, affected slightly the superjacent topography, as it is usually observed with such water pumping. However, the magnitude and the extension of such vertical displacement are not easily detectable with classical geological and geotechnical methods such as levelling comparisons, which are expensive, time consuming and with local results.
The technique of Synthetic Aperture Radar differential interferometry (DINSAR) can bypass some of those problems. Differential interferometry has been used for several years to obtain continuous displacement fields for many geophysical applications [14], including land subsidence, and in particular, more recently, subsidence in urban areas [1,6,7,10,11,15]. This method requires the use of SAR images acquired on the same area at different dates, which are combined by two to build deformations maps. The advantage studying large urban areas such as Paris is that the coherence is preserved through long time scale, allowing monitoring of slow motions. The major disadvantage is due to the varying atmospheric conditions between the two radar images used to form an interferogram, which can introduce artefacts on the resulting interferogram [8,9,18].
We focus below on the Saint-Lazare area in Paris, as our previous works allowed us to detect a subsiding area near the station [7]. We show here that DINSAR allows us to monitor the temporal variations of the vertical displacements on this specific area, and we examine the three main phases: subsidence, no displacement, and uplift, directly linked to the pumping activity on this area. The uplift has also already been examined by Le Mouélic [11,12].
We will describe the results obtained with DINSAR, and compare them with piezometric measurements, as well as levelling data.
2 Displacement observed by differential interferometry
We used about 40 radar images acquired by the ERS-1 and ERS-2 satellites between 1993 and 1999, and processed differential interferograms, removing the topographic contribution with a 25 m × 25 m DEM provided by the ‘Institut géographique national’. Interferometric pairs have been selected according to their perpendicular baseline (which might be small to avoid residual topographic effects and geometric decorrelation): they all have ‘good’ baselines, lower than 100 m. They have also been chosen according to the time period they cover, in order to examine the different temporal characteristics of the displacements.
ERS-1 and ERS-2 acquisitions allow a good temporal coverage of the construction work, except during the period of subsidence: no images are available between November 1993 and April 1995, when the pumping starts, so that it is impossible to detect with precision the beginning of the subsidence phenomenon.
One major limitation of the DINSAR method is the variation of the atmospheric conditions between the two image acquisitions, which can introduce large phase variations in the resulting interferograms and can be misinterpreted as deformation. Nevertheless, we showed in a previous study that correlating independent interferograms could encounter this problem. By choosing interferograms spanning the same time period (or containing the same displacements) and by correlating them, we can separate the artefacts and the displacement: the displacement, being common to the interferograms, will give a high rate of correlation.
Due to the high number of available interferograms in this study, we could eliminate those with strong tropospheric artefacts, easily identified because of their characteristic patterns, and keep the ones containing very low artefacts. For those interferograms, the atmosphere was very stable, so that we do not need to correlate them. Furthermore, in order to reduce the effects of atmospheric distortion, we have the possibility to stack independent interferograms [17].
The differential interferograms show clearly four different time periods. Fig. 1 gives an example of four differential interferograms on Paris corresponding to these periods. Sense of phase variation, given by the colour variation (an increase or a decrease towards the centre of the affected area) gives the type of displacement: one can discriminate a subsidence from an uplift. The first interferogram (Fig. 1a) corresponds to the period before the water pumping starts: no significant signal can be observed on it. On the second one (Fig. 1b), covering the beginning of pumping, one can easily detect a blue spot located near the Saint-Lazare station: this corresponds to a subsidence, related to the beginning of pumping. The interferogram corresponding to the period of intense water pumping and underground works (Fig. 1c) shows again no phase variation, confirming that no surface displacement occurred during this period of time. The last one (Fig. 1d) reveals a red spot at the same place we already observed the blue spot, and indicates a surface uplift related to the end of pumping, around the Haussmann–Saint-Lazare station, whose construction is finished.
Maps of cumulate subsidence and uplift have been generated (Fig. 2). For this, we unwrapped and stacked four independent interferograms, for which atmospheric artefacts are already of low amplitude, in order to reduce again the noise [17]. The amplitude of these two displacements can be obtained: assuming that all displacements are vertical, one fringe (complete cycle of phase) in a single differential interferogram represents 28 mm of displacement along the radar line of sight, or 3.1 cm of vertical displacement. Taking into account the atmospheric noise level, the precision we obtained with the stacking of interferograms is 4 mm. The maximum amplitude reached during the subsidence is 1.7 cm, whereas it is in the order of 1.6 cm for the uplift (Fig. 2). The comparison of those amplitudes shows that the uplift phenomenon compensated the subsidence one, and then shows the reversibility of the displacements. The spatial extension of the phenomena can also be determined: the subsidence is about 800 m large and 1200 m long, whereas the uplift concerns an area of 1800 m × 2500 m. The general shape of the deformation zone is a WSW–ENE-oriented ellipse, flattened on its eastern part. The area of maximum displacement (south of the station) is formed by two bowls, especially visible for the uplift period: one is elongated, oriented NNW–SSE. The other one, much smaller, is situated eastward.
As mentioned before, no precise analysis of the subsidence can be done, due to the lack of data in 1994.
Concerning the uplift period, we can try to examine the temporal evolution of the uplift during the recharge of the water. Three phases can be observed for this uplift, with different areas successively reached. Despite some bubbles easily attributable to atmospheric perturbations, the May 1996–November 1997 interferogram shows only a small signal of displacement on the specific area of interest, observed from July 1997 (January 1996–July 1997 interferogram). A significant signal appears on the September 1996–January 1998 interferogram, and increases on the July 1995–February 1998 one. This indicates that the uplift began between November 97 and January 98. Spatial extension of the deformation is quite small, localized above the pumping area. This signal seems to be stable until July 1998, then propagates toward the southwest: we observe a rapid uplift, between July and August 1998, of an area centred approximately at the intersection of ‘rue Tronchet’ and ‘rue des Mathurins’, and having the shape of a NNW–SSE ellipse. Surface of displacement grows again slightly until October 1998: on the January 1996–October 1998 interferogram, the extent of the displacement seems to reach the final one, as observed in Fig. 2b.
3 Analysis of piezometric and levelling data
The precise monitoring of 87 piezometers (done by SNCF and IGC) between November 1990 and June 2000 reveals major fluctuations of the top of the different water levels (alluvial, Lutetian, and Ypresian nappes) composing the multilayer aquifer of the Paris Basin during the underground works. The water pumping had been done in the Cuisian (Ypresian) nappe. Only the data of four piezometers are available in that aquifer. The piezometric monitoring is mainly done here using the high number of Lutetian piezometers and the drainage effect that exists between both Ypresian and Lutetian aquifers [3,13].
The water level evolution through time (Fig. 3) indicates no vertical changes in the alluvial aquifer due to water pumping, which means that this aquifer has no action on the topography. In contrast, the Lutetian and Ypresian aquifers show major modifications (more than 20 m of subsidence) in May 1994 and a rise or ‘surrection’ of similar amplitude when the water pumping stops, for a major part between July and August 1998 (for some piezometers this rise begins from March 1998).
Five major periods are distinguished from the piezometric point of view:
- – May 1992–May 1994: three small decreases of the Lutetian piezometric surface that correspond to the water pumping tests;
- – May 1994–June 1994: major subsidence of the piezometric surface of Lutetian and Ypresian aquifers;
- – June 1994–March 1998: stability during the construction work and water pumping;
- – March 1998–September 1998: major rise of the Lutetian and Ypresian piezometric surface back to the pre May 1994 level;
- – September 1998–June 2000: stability post underground work.
These variations are clearly from anthropogenic origin, as the observed small offsets of the Lutetian piezometric surface in July 1991, June 1992 and April 1993 correspond to the three water pumping tests, and the periods of major changes correspond to the beginning and the end of the water pumping.
We also analysed 626 points of levelling comparison done by the SNCF. These points are located in the influence area of the construction works estimated by the SNCF, in a restricted perimeter of 50 m around the new station. The monitoring of the levelling points shows clearly three major periods (Fig. 4):
- – May 1994–April 1995, period of high centimetric subsidence with a plateau. The whole area shows a global decrease of the topographic surface with a maximum of 1.7 cm near the ‘rue du Coq’;
- – April 1995–June 1998, period of stability, except for a few points showing a small subsidence from the second semester of 1996;
- – June 1998–October 1998, period of high uplift. This uplift is mainly characterised by two areas, showing a maximum displacement of 1.1 cm, and which are east–west oriented.
4 Discussion and conclusion
Comparison of the results obtained from interferometry with the piezometric and levelling data shows the good agreement and complementarity that exist between these different measurements.
Piezometric data confirm the important fluctuations of the multilayer aquifer due to water pumping during the construction works. The different periods of fluctuation of the Lutetian and Ypresian water tables monitored by the piezometers (major changes, and stability between March 1994 and March 1998) are quite the same as the one observed with interferometry, in particular the high increase in July–August 1998. Levelling data give also quite similar periods of variation.
The spatial extension of the phenomenon obtained with the piezometric data and interferometry shows again their good agreement: the superimposition of the maps of deformation obtained with DINSAR and the piezometric surface variations shows the excellent fit that exists between both (Fig. 5).
Differential interferometry offers a better estimate of the spatial extension of the displacements than the levelling. Levelling data show variations of the topographic surface, but it appears that the reference point is localised in the area of subsidence, as it can be shown with interferometry: the area affected by the deformation has been underestimated.
Furthermore, the comparison between the levelling and piezometric data allows us to confirm which water nappe is responsible of surface displacement. It appears (Fig. 6) that a rise of the Lutetian nappe does not lead to a surface uplift (no influence of the levelling), whereas a rise of Ypresian nappe leads to surface displacement, as observed by levelling variations.
This study in urban context allowed us to test and validate the SAR interferometry technique for a specific application: differential interferometry appears to be an efficient and operational tool for low-cost, large-coverage (compared with levelling) surface-deformation monitoring related to water pumping.
Comparison between the levelling and piezometric data allows us to propose some causes for the discharge/recharge mechanisms of the multilayer aquifer of the Paris Basin in the studied area, which may in the future allow us to define new specifications for water pumping in order to reduce surface deformation.
We are now working with the more recent Permanent-Scatterer technique [4,5], which appears very promising [2,16]. This method allows to detect and monitor surface displacements on a grid of points (PS), which is usually very dense in cities. It is possible to use all the available data on the area, and to eliminate the atmospheric artefacts. The new PS technique allows then for a full description of the time evolution of those single privileged targets (PS) with a better precision.
Acknowledgements
This study has been carried out in the framework of a project supported by the French Government and the CNES. We thank ESA and CNES for providing the radar images, IGN for the DEM. We are also grateful to the SNCF and IGC.