

Version française abrégée
1 Introduction
À Taiwan, de grands glissements de terrain se sont produits en secteur montagneux près de l'épicentre du séisme de Chi-Chi du 21 septembre 1999 (Fig. 1a), provoqués par ce séisme , qui a causé 2450 décès et de grandes destructions dans le centre ouest de Taiwan [2]. De tels séismes peuvent déclencher des milliers de glissements de terrains sur des surfaces de plus de 100 000 km2 [11]. Les facteurs lithologiques, séismiques, climatiques (typhons et fortes précipitations) accroissent le risque de glissement de terrain dans la partie montagneuse de l'île.

(a) Shaded topographic map of Taiwan. Surface rupture and focal mechanism of 1999 Chi-Chi earthquake shown, with solid star at the epicentre. (b) Shaded topographic map of Tsaoling region before 1999, with 100-m contour interval; frame shows studied area. (c) Simplified geological map and (d) geological cross-section of study area (see legend for details).
(a) Carte topographique ombrée de Taiwan. Trace de faille et mécanisme focal du séisme de Chi-Chi en 1999, avec étoile noire à l'épicentre. (b) Carte topographique ombrée de la région de Tsaoling (avant 1999), avec intervalle de 100 m des courbes de niveau ; le cadre indique le secteur étudié. (c) Carte géologique simplifiée et (d) coupe géologique du secteur étudié (détails dans la légende).
À Tsaoling (Fig. 1a–b), au moins cinq grands glissements de terrain se sont produits pendant les XIXe et XXe siècles [7–9,14]. Le séisme de Chi-Chi (1999) a déclenché un glissement de terrain qui a mobilisé environ 0,125 km3 de roches et de sols, qui ont créé un barrage naturel de 5 km de long sur la rivière Chingshui. Un cinquième du glissement de terrain a comblé la rivière de Chingshui, le reste a franchi la rivière et a atteint le versant opposé.
Nous avons utilisé un modèle numérique à haute résolution LiDAR [18,19] (Light Detection and Ranging, aéroporté), avec lequel la résolution horizontale atteint 1 m et la résolution verticale 0,15 m [15], pour produire un modèle numérique de terrain (MNT) de haute résolution à Tsaoling. Nous avons analysé les caractéristiques géomorphologiques de la cicatrice du glissement et de l'amas de débris, puis estimé le transfert de volume, en comparant les configurations antérieures et postérieures au glissement de 1999.
2 Le glissement de terrain de Tsaoling
Le séisme le plus destructeur du XXe siècle à Taiwan, le séisme de Chi-Chi, a frappé le centre de l'île le 21 septembre 1999 [10]. Il a été provoqué par une rupture le long de la faille de Chelungpu, un chevauchement majeur près du front de la chaîne de montagnes de Taiwan [1,4,13]. Des dizaines de milliers de bâtiments se sont effondrés, des équipements hydrauliques ont été endommagés, avec rupture de barrages, ponts, digues, levées et systèmes d'irrigation.
Ce tremblement de terre a déclenché deux glissements géants, à Chiufenerhshan et Tsaoling, tuant 39 et 29 personnes respectivement. Nous analysons celui de Tsaoling, à 30 km au sud-ouest de l'épicentre du séisme de Chi-Chi (Fig. 1a). Le village de Tsaoling est situé dans la vallée de la Chingshui (Fig. 1b), un affluent de la Choshui. Le substratum rocheux, pliocène, comprend le schiste de Chinshui, où le glissement s'est opéré, et la formation schisto-gréseuse de Cholan (Fig. 1c–d). Tsaoling est situé sur le flanc oriental d'un synclinal NNE–SSW.
Les glissements majeurs successifs et les destructions associées ont été répertoriés pendant les 140 dernières années dans la région de Tsaoling [8,16,17]. Ils ont été déclenchés par de fortes précipitations, comme en 1942, 1951 et 1979, ou par des tremblements de terre destructeurs, comme en 1862, 1941 et 1999. Des ruptures de barrages naturels créés par des glissements ont eu lieu en 1898, 1951, 1979 et 1999. Un séisme important (estimé à ) a déclenché le glissement de terrain le plus ancien connu à Tsaoling en 1862, et le barrage ainsi créé s'est rompu en 1898. Un autre séisme majeur a induit un glissement de terrain au même endroit en 1941, et de fortes précipitations l'ont réactivé, avec un barrage plus volumineux, en 1942. La rupture du barrage a causé de grands dommages en aval, tuant 137 personnes après plusieurs jours de fortes pluies en 1951. De fortes précipitations ont déclenché le troisième glissement de terrain en 1979, sans perte humaine, car les habitants à l'aval avaient été évacués. En raison du séisme de Chi-Chi en 1999, plus de 0,125 km3 de roche et de terre ont bloqué la gorge de la rivière de Chingshui sur une distance de 5 km. Un barrage de débris haut de 50 m en amont et de 150 m en aval s'est formé soudainement, et un lac d'une capacité estimée à 0,046 km3 au moins s'est développé. Le glissement de 1999 avait été précédé de mouvements précurseurs [5].
3 L'analyse volumétrique du glissement de terrain
Après le glissement de septembre 1999, la région du glissement de terrain de Tsaoling a été modifiée par l'érosion de la rivière, particulièrement pendant les typhons. Nous avons calculé le changement de volume en avril 2002, soit 2,5 ans après le glissement de terrain. Les techniques ayant changé, nous avons dû comparer des données de natures et de précisions différentes. Les modèles topographiques utilisés étaient le MNT Taiwan, dérivé des photographies aériennes de 1986 (Fig. 2a) et un MNT obtenu à partir de l'analyse LiDAR en 2002 (Fig. 2b). La résolution est d'environ 1 m (verticalement) et 40 m (horizontalement) dans le premier cas, 0,15–1 m (verticalement) et 2 m (horizontalement) dans le deuxième cas [15]. Par conséquent, les incertitudes majeures dans nos calculs tirent souvent leur origine du MNT Taiwan. Ces incertitudes vont de 6 à 20 % suivant les calculs, et sont pour la plupart de 9 %. Les photographies aériennes prises de 1986 à 1999, avant le séisme, indiquent des changements mineurs. La différence entre les modèles de 1986 et de 2002 (Fig. 2c) est principalement imputable au glissement de terrain de Tsaoling en 1999 et à l'érosion des 2,5 années suivantes.
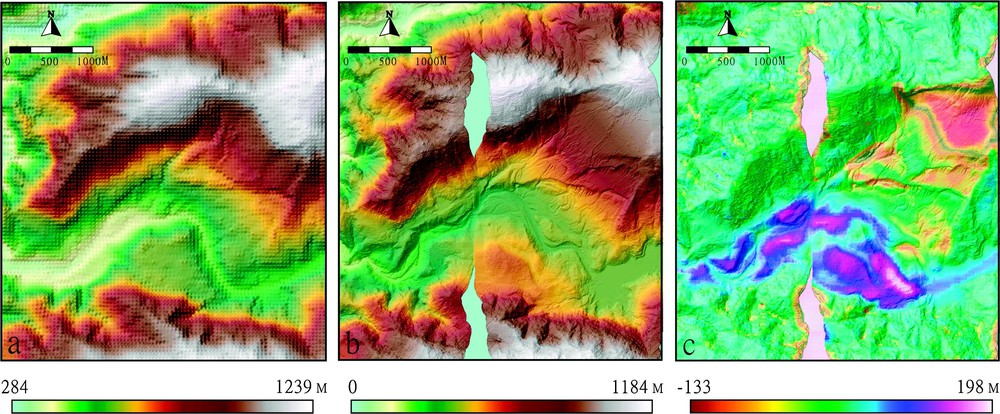
Topographic changes of the Tsaoling landslide induced by the 1999 Chi-Chi earthquake, based on different digital elevation models (DEM). Colour codes according to elevation for the first two images or to difference in elevation for the third image. (a) Taiwan 40-m DEM obtained from 1986 aerial photographs. (b) 2×2 m airborne-LiDAR-derived DEM, 2002, with area where images do not overlap in light blue. (c) Estimated volume change of the Tsaoling landslide, based on the difference between (a) and (b): unchanged topography in green, elevation excess in blue and purple, elevation deficit in yellow and orange. Note that some erosion before and after the 1999 landslide is incorporated in the calculation (see text).
Analyse des changements altimétriques liés au glissement de terrain de Tsaoling induit par le séisme de Chi-Chi de 1999, à partir de différents modèles numériques topographiques (MNT). Codes de couleur en fonction de l'altitude pour les deux premières images ou de la différence d'altitude pour la troisième image. (a) MNT 40 m de Taiwan, obtenu à partir de photographies aériennes de 1986. (b) MNT 2×2 m dérivé du LiDAR, 2002, avec domaine de non-recouvrement des images en bleu clair. (c) Estimation du changement de volume lié au glissement de Tsaoling, en fonction de la différence entre (a) et (b) : topographie inchangée en vert, excès d'altitude en bleu et violet, déficit d'altitude en jaune et orange. Noter que de l'érosion avant et après le glissement de 1999 est incorporée dans le calcul (voir le texte).
Le changement de volume lié au glissement de terrain de Tsaoling, immédiatement après le séisme de Chi-Chi, a pu être précisé par comparaison entre les modèles numériques de précision avant et après le glissement de terrain, réalisés par photogrammétrie [3]. Le volume de la cicatrice était d'environ 0,126 km3 et le volume d'accumulation d'environ 0,150 km3, soit une augmentation de volume de 19 % par décompaction pendant le glissement de terrain. Nous utilisons cette donnée co-sismique pour étudier l'effet de l'érosion postérieure par la rivière.
Notre calcul fondé sur la situation en avril 2002 a fourni un volume de cicatrice, (Fig. 3), d'environ 0,137 km3, soit 0,011 km3 de plus que la valeur co-sismique, et un volume d'accumulation, , d'environ 0,116 km3, soit 0,034 km3 de moins que la valeur co-sismique. Ces différences sont significatives. Elles indiquent l'érosion réalisée en 2,5 ans par enlèvement des débris du glissement par la rivière, soit . Il s'agit d'un maximum, car l'érosion de 1986 à 1999, quoique limitée, est incluse dans ce total. Le volume total de matériel accumulé avant érosion, , est de 0,161 km3. On écrit , où δ est le coefficient de décompaction pendant le glissement (Fig. 3b). La comparaison suggère une augmentation de volume de 17,5 % pendant le glissement, compatible avec l'estimation co-sismique (19 %).
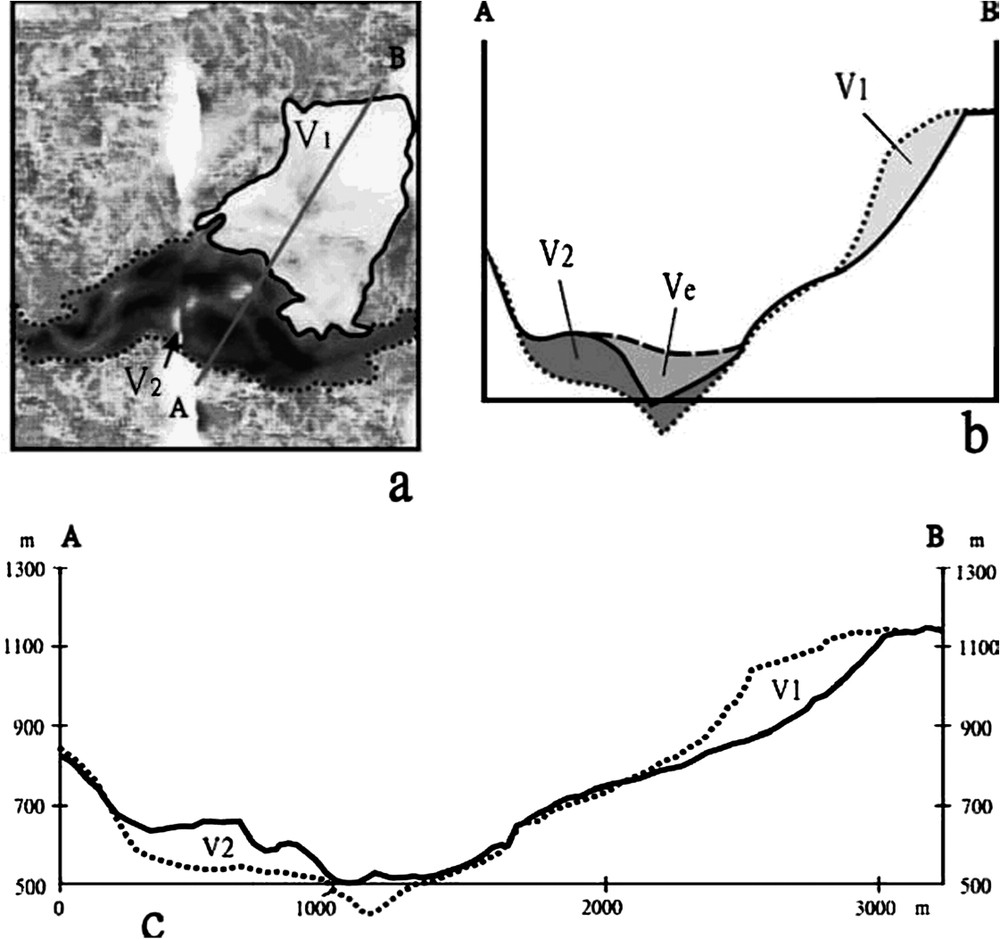
Explanation of volume change calculation, 1999 Tsaoling landslide. (a) Schematic map (in 2002) of the 1999 landslide area, with location of cross-section (A–B). (b) Schematic presentation of the cut, fill and eroded volumes (, and , respectively) in cross-section without scale; 2002 profile as solid line, 1986 profile as dotted line, late 1999 profile as dashed line. , δ being the coefficient of syn-sliding decompaction. (c) Topographic profiles in 1986 (dotted line) and 2002 (solid line).
Explication du calcul des changements de volume, glissement de terrain de Tsaoling en 1999. (a) Carte schématique (en 2002) de la zone de glissement de terrain de 1999, avec localisation de la coupe (A–B). (b) Présentation schématique des volumes arraché, accumulé et érodé ( et ), en coupe sans échelle ; profil de 2002 en trait continu, profil de 1986 en trait pointillé, profil de la fin 1999 en tirets. , δ étant le coefficient de décompaction pendant le glissement. (c) Profils topographiques en 1986 (pointillé) et en 2002 (continu).
Le climat subtropical de Taiwan joue un rôle important, avec en moyenne quatre typhons et une précipitation de 2515 mm par an, de même que les séismes fréquents et l'incision fluviatile rapide induite par le soulèvement actif [6]. Une étude récente en Nouvelle-Guinée a souligné l'effet de glissements de terrain déclenchés par les séismes pour l'érosion : 0,58 mm an−1, à comparer avec 0,2–0,4 mm an−1 pour les autres processus [12]. L'étude de 15 séismes historiques a fourni une relation simple entre le volume total V (en m3) de matériau glissé, et le moment séismique (en dyne cm), et prétendue extrapolable [12] : , pour .
Le moment séismique du séisme de Chi-Chi avoisine , selon les données CMT de Harvard. L'équation suggère donc un volume total d'environ 4,26 km3. Une étude d'images SPOT [14] a indiqué que le séisme de Chi-Chi avait déclenché 9272 glissements de terrain, couvrant une surface totale de 128 km2, indiquant une épaisseur moyenne de 33 m. Cette valeur est acceptable, suggérant que l'équation est valable en grossière approximation. Le changement du taux de dénudation dans le secteur épicentral fera l'objet d'une autre note.
4 Conclusion
Le glissement de Tsaoling illustre l'influence des facteurs géologiques sur le phénomène de glissement et l'importance de l'analyse pour évaluer le risque et planifier les ouvrages et gérer les ressources en eau. Depuis 1980, les investigations incluent télédétection, photogrammétrie, enquêtes de terrain, surveillance et essais de laboratoire [8]. Le glissement d'une masse d'environ 0,125 km3 est envisagé pour l'avenir. La construction d'un réservoir de rechange est discutée, mais la probable réactivation du glissement de Tsaoling affecte de tels plans.
Le modèle numérique altimétrique à haute résolution (MNT) dérivé des données aéroportées LiDAR nous a permis une analyse détaillée de l'éboulement destructif de Tsaoling, déclenché par le tremblement de terre de 1999. Les observations géologiques et morphologiques le long des dépôts de surface de glissement et d'avalanche ont amélioré la compréhension du processus d'éboulement et l'évaluation du volume d'éboulement. La combinaison de ces données récentes avec les données – moins précises – antérieures au glissement permet la détermination des changements volumétriques pendant et après l'événement catastrophique de 1999 à Tsaoling. En avril 2002, le volume de la cicatrice était d'environ 0,137 km3. Environ 8 % de ce volume reflètent l'érosion de septembre 1999 à avril 2002. Environ 29 % du volume d'accumulation de 0,116 km3 ont été enlevés par érosion pendant les 2,5 années qui ont suivi le tremblement de terre.
Il en ressort que le volume de la masse glissée évacué par le fleuve de Chingshui pendant ces 2,5 années avoisine 0,045 km3. Comparé aux chiffres habituels de l'érosion, ce grand volume montre l'efficacité du processus de glissement de terrain en tant qu'agent de dislocation qui facilite l'érosion ultérieure. Les propriétés mécaniques affaiblies de la masse glissée ont largement accru le taux d'érosion à long terme dans le secteur d'étude. La haute probabilité de répétition de tels événements mérite attention en ce qui concerne l'évaluation des risques. L'impact des glissements de terrain provoqués par le tremblement de terre destructeur de Chi-Chi sur les bilans de dénudation, à court, moyen et long terme, sera analysé ultérieurement.
1 Introduction
In Taiwan, large landslides occurred in the mountainous area near the epicentre of the 21 September 1999 Chi-Chi earthquake (Fig. 1a), triggered by the earthquake, which resulted in more than 2450 human casualties and widespread damage in central Taiwan [2]. Earthquake shaking is a major agent of landslide generation, with the largest earthquakes capable of triggering thousands of landslides throughout areas of more than 100 000 km2 [11]. In Taiwan, landslide hazard reaches high levels in the mountainous part of the island where argillaceous slate lithology, earthquakes, typhoons and heavy rainfall favour gravitational sliding.
In central Taiwan, the most representative landslide area is Tsaoling (Fig. 1a and b), where at least five major dip slope failures occurred during the 19th and 20th centuries [7–9,14]. The 1999 Chi-Chi earthquake triggered a catastrophic landslide, which mobilised about 0.125 km3 of rock and soil that slid across the Chingshui River and created a 5-km-long dam. One fifth of the landslide mass dropped into the Chingshui, the rest (about 0.1 km3) jumped over the river.
The establishment of digital elevation models (DEM) facilitated neotectonic and quantitative geomorphology studies in Taiwan. The most commonly used DEM has a horizontal resolution. The airborne LiDAR (Light Detection and Ranging) involves a new technology that uses a transmitted laser beam to reconstruct the morphology in detail [18,19]. Through combined use of laser transmitter with high repeating-pulse frequency (RPF) and high-speed scanning system, dense measurements of the terrain surface were obtained, giving a spatial resolution of up to 1 m horizontal and 0.15 m vertical [15]. The Global Positioning System (GPS) and Inertial Navigation Systems (INS) on board of aircraft allowed accurate positioning of the LiDAR data. Because the LiDAR laser pulse scans the surface at very high frequencies, up to 80 kHz, a DEM with a horizontal resolution, or even better, was routinely obtained.
We used the airborne LiDAR data to generate high-resolution DEMs near the Tsaoling landslide triggered by the 1999 Chi-Chi earthquake in west-central Taiwan, and to map geomorphological features along the sliding surface and avalanche deposits. We also estimated the landslide-related mass transfer by comparing the pre-landslide DEMs and our recent DEM.
2 The Tsaoling landslide
The most destructive earthquake of the 20th century in Taiwan, the Chi-Chi earthquake, struck the west-central island on 21 September 1999 [10]. It was caused by rupture along the Chelungpu Fault, a major west-vergent thrust near the front of the Taiwan mountain belt. A more than 90-km-long surface rupture developed (Fig. 1a), involving thrusting and left-lateral components [1,4,13]. The vertical offsets averaged about 2 m along the southern half of the Chelungpu fault and about 4 m along the northern segment, whereas horizontal offsets of 5 to 10 m were observed along the northern part of the major fault. Not only did tens of thousands buildings collapse, but also hydraulic facilities were severely damaged, including rupture and displacement of dams and bridges, distortion and tumbling of riverbanks and coastal levees, and devastation of irrigation systems.
This earthquake triggered two huge landslides at Chiufenerhshan and Tsaoling, killing 39 and 29 persons, respectively. We focus on the Tsaoling landslide, about 30 km southwest of the epicentre (Fig. 1a). The Tsaoling village is located in the valley of the Chingshui River (Fig. 1b and d), a tributary of the Choshui River, the largest river of Taiwan. The bedrock is Pliocene in age and belongs to the upper Chinshui Shale and the lower Cholan Formation (Fig. 1c and d). The Chinshui Shale, in which landslide detachment took place, consists of massive mudstone and shale, with intercalated fine-grained sandstone layers. The Cholan Formation, which conformably rests on the Chinshui Shale, is composed of fine-grained sandstone with variable amounts of shale. Tsaoling is located on the east flank of a NNE-trending syncline. The strata strike 030–070° (azimuth) with a dip 30–40°SE in the west limb of the syncline, 030–060° with a dip 40°NW in the east limb, and 140° with a dip 14°SW in the landslide area.
The occurrence of successive landslides and related destruction in the Tsaoling area has been documented for the past 140 years [8,16,17]. Historical catastrophic dip slope failures have repeatedly occurred, triggered by heavy rainfalls, as in 1942, 1951 and 1979, or by destructive earthquakes, as in 1862, 1941 and 1999. Ruptures of natural dams created by landslides took place in 1898, 1951, 1979 and 1999. A major earthquake with estimated triggered the oldest recorded landslide at Tsaoling in 1862; the natural dam thus created failed in 1898. Another major earthquake induced a second landslide at the same location in 1941, and heavy rainfall led to its reactivation, with a larger natural dam, in 1942. The landslide dam failed by overtopping and caused serious damage in downstream valleys, killing 137 people after several days of intensive rainfalls in 1951. A heavy rainfall activated the third landslide in 1979; no fatality was reported because downstream residents had been evacuated before dam failure. As a result of the Chi-Chi earthquake in 1999, more than 0.125 km3 of rock and earth masses blocked the gorge of the Chingshui River along a distance of 5 km. A debris dam with a height of 50 m upstream and 150 m downstream suddenly formed, and the Tsaoling Lake having an estimated capacity larger than 0.046 km3 developed.
The landslide resulted from failure of the Chinshui Shale that underlies the Cholan sandstone. From the engineering point of view, the Chinshui shale is a friable, silty mudstone with weak cementation that deteriorates readily upon wetting and drying. The slip surface of the 1999 landslide was smooth and nearly planar, parallel to bedding. It formed within alternating beds of fine sandstone and shale with ripple lamination, or in shale. The shale is weathered by slaking and probably by sulphuric acid, which is inferred to be a major cause of intermittent failure. The top margin of the 1999 landslide coincided with a V-shaped scarplet, clearly recognised on aerial photographs taken before the landslide. This indicates that this landslide had slightly moved before the 1999 event, providing precursory signal [5].
3 Volumetric analysis of the Tsaoling landslide
The Tsaoling landslide region continued to be modified due to severe river erosion, especially during rainstorms. We calculated the volume change 2.5 years after the event, that is the period from September 1999 to April 2002. Because of technical changes through time, we had to compare data that differ in nature and accuracy. The data sets used were the Taiwan DEM (Fig. 2a) derived from 1986 aerial photographs, and the local DEM (Fig. 2b) obtained from LiDAR analysis in 2002. The vertical resolution is 1–4 m (vertical) and 40 m (horizontal) in the first case and 0.15–1 m (vertical) and 2 m (horizontal) in the second case [15]. As a result, the major uncertainties in our calculations originated in the Taiwan DEM. These uncertainties range between 6 and 20% depending on the calculations, most of them being of 9%.
The aerial photographs taken from 1986 until the 1999 Chi-Chi earthquake indicate that little surface change occurred in the area during this period. Most of the recorded volume change, as indicated by the difference between the 1986 and 2002 models (Fig. 2c), resulted from decompaction during the 1999 Tsaoling landslide and erosion during the following 2.5 years.
The volume change of the Tsaoling landslide event shortly after the Chi-Chi earthquake could also be estimated, based on a comparison between the photogrammetry-derived pre- and after-landslide DEMs [3]. The calculated cut volume was about 0.126 km; and the fill volume was about 0.150 km3, which suggests a volume increase of 19% during the landslide event, as a consequence of the decompaction during the landsliding. This coseismic volume change provides a basis for studying volume change due to later river erosion.
Our calculation based on the situation in April 2002 revealed a cut volume, (Fig. 3), of about 0.137 km3, by 0.011 km3 larger than the coseismic value, and a fill volume, , of about 0.116 km3, by 0.034 km3 smaller than the coseismic value. These differences are larger than uncertainties, and hence significant. They reveal the amount of erosion that affected the landslide area after 2.5 years, because of the removal of a volume of landslide debris by the river, . This is however a maximum, because the erosion between 1986 and 1999, albeit limited, is included in this total. The excess volume of disrupted material before erosion, , is 0.161 km3. One may write , where δ is the syn-sliding decompaction coefficient (Fig. 3b). The comparison with the cut volume, 0.137 km3, suggests a volume increase of 17.5% during the landslide event. This ratio is smaller than, but consistent with, that inferred from coseismic volume changes, 19%. Note that the landslide materials coming down the slope during erosion had already undergone decompaction during the coseismic landslide event.
Of particular importance in this context are the subtropical climate of Taiwan with four typhoons and a mean precipitation of 2515 mm each year (on average), the frequent earthquakes and the rapid fluvial bedrock incision induced by active uplift [6]. A recent study in the Adelbert Range of New Guinea highlighted a dramatic increase in the long-term erosion rate following landsliding triggered by a 1970 earthquake, 0.58 mm yr−1 as compared with 0.2–0.4 mm yr−1 from other processes [12]. Based on the study of 15 historical earthquakes, a simple relationship was derived between total volume of landslide material V and seismic moment (in cubic metres and dyne cm, respectively), and claimed to be reasonably applicable to a wide variety of environments [12], , for .
The estimated seismic moment released by the Chi-Chi earthquake is about dyne cm according to the Harvard CMT data. The equation would suggest in this case a total earthquake-induced landslide volume of about 4.26 km3. A study of SPOT images [14] indicated that the Chi-Chi earthquake had triggered 9272 landslides, covering a total area of 128 km2, giving an average thickness of 33 m for these landslides. This value is reasonable (the Tsaoling landslide is thicker, but many landslides are thinner), suggesting that the equation is valid as a raw approximation. The change in denudation rate in the Chi-Chi earthquake epicentral area will be analysed in a forthcoming paper.
4 Conclusion
The Tsaoling landslide provides case examples to evaluate geological factors in landslide occurrence and the influence of landslide on water resource planning and hazard assessment. Investigations have been carried out since 1980, involving remote sensing and aerial photograph analyses, field surveys and in situ monitoring and laboratory tests [8]. Based on structural analysis, a tensile zone is expected to exist in the slope between 1050 and 1100 m in elevation, and a rockslide involving a mass movement of about 0.125 km3 in the future is possible. The construction of a replacement reservoir at the landslide site is discussed, but consideration of possible reactivation of the Tsaoling landslide raises obvious concerns about such plans.
The high-resolution digital elevation model (DEM) derived from the recent airborne LiDAR data enabled us to map and analyse in more detail than before the destructive Tsaoling landslide triggered by 1999 Chi-Chi earthquake. Geological and morphological observations along the sliding surface and avalanche deposits led to better understanding of the landslide process and estimation of the landslide volume. The LiDAR data allowed comprehensive investigation on spatial patterns and morphological features occurring along the sliding surface and fill area. Combining these recent data with the less accurate but numerous earlier data issued from aerial photographs, topographic maps and satellite images, we evaluated the volumetric changes before, during and after the 1999 Tsaoling catastrophic landslide event. In April 2002, the cut volume was about 0.137 km3. The comparison with coseismic estimates suggests that about 8% of this volume reflect erosion from September 1999 to April 2002. About 29% of the fill volume, 0.116 km3, have been removed by erosion during the 2.5 years following the earthquake.
The volume of landslide evacuated by the Chingshui River during these 2.5 years is thus estimated to be up to 0.045 km3. With respect to usual amounts of erosion, this large volume shows how effective the landslide process may be, as an agent of rock mass disruption that facilitates subsequent erosion. The weak mechanical properties of the landslide mass significantly increased the long-term denudation rate in the study area. The study of the Tsaoling landslide reveals that the probability for repeated major landslide events is very high, which deserves careful consideration as far as natural hazard mitigation is concerned. The impact of landslides caused by the destructive Chi-Chi earthquake on erosion budgets and denudation rates over the short, medium and long-term will be analysed in further studies.
Acknowledgements
The LiDAR raw data were provided by the Agricultural and Forestry Aerial Survey Institute of Taiwan. This research was supported by National Science Council of Taiwan grant NSC 90-2116-M-001–030 and by Taiwan–France cooperation in Earth Sciences (French Institute in Taipei and National Science Council of Taiwan), and by the French CNRS (Pics Taiwan).