

Version française abrégée
1 Introduction
Le karst de Haute-Normandie est typiquement binaire. Les plateaux crayeux sont recouverts par des formations superficielles (argile à silex et lœss), qui constituent une couche relativement imperméable. Lors des événements pluvieux, les eaux de ruissellement sont concentrées et s'infiltrent localement au travers des bétoires. Cela induit aux exutoires karstiques des crues turbides et des chutes de la conductivité électrique. Le transport particulaire est un processus complexe, pouvant impliquer, à l'échelle de l'événement pluvieux, du dépôt et de la remise en suspension.
Les autocorrélations de longues chroniques de débit et de conductivité électrique sont de bonnes méthodes pour étudier le transport de la phase dissoute en aquifère karstique [11,15,17]. Ces analyses de chroniques à long terme mettent en évidence les inerties des systèmes, prenant en compte à la fois les écoulements diffus et les écoulements par conduits.
Les études concernant le transport des phases dissoutes et particulaires sont rares : Williams [23] en rivière, en étudiant les hystérésis (C= concentration en sédiments et Q= débit), propose différents scénarios de transport ; Massei et al. [18], par la comparaison du transport dissous et particulaire en système karstique, distinguent la turbidité autochtone de la turbidité allochtone ; Bouchaou et al. [4] utilisent les analyses spectrales de turbidité et débit à l'échelle pluriannuelle, pour montrer qu'il n'y a pas de relation entre dissous et particulaire à cette échelle de temps.
Notre cas d'étude montre que le couplage du transport dissous et particulaire, à courte échelle de temps, permet de mettre en évidence les processus de transport comme le dépôt, la remise en suspension ou le transfert direct, et ainsi de comprendre le fonctionnement hydrodynamique des systèmes karstiques.
2 Matériel et méthodes
Trois exutoires karstiques, représentant les différents fonctionnements hydrodynamiques, ont été sélectionnés parmi 30 sites étudiés dans le département de l'Eure (Fig. 1). Chaque site est équipé d'une sonde de turbidité, d'une sonde de conductivité électrique et d'une sonde de température. Les données sont enregistrées à un pas de temps de 5 min. Les pluviomètres du réseau Météo-France enregistrent les précipitations à un pas de temps de 24 h et le pluviomètre de la ville d'Evreux enregistre les précipitations à un pas de temps de 1 h (Fig. 1).
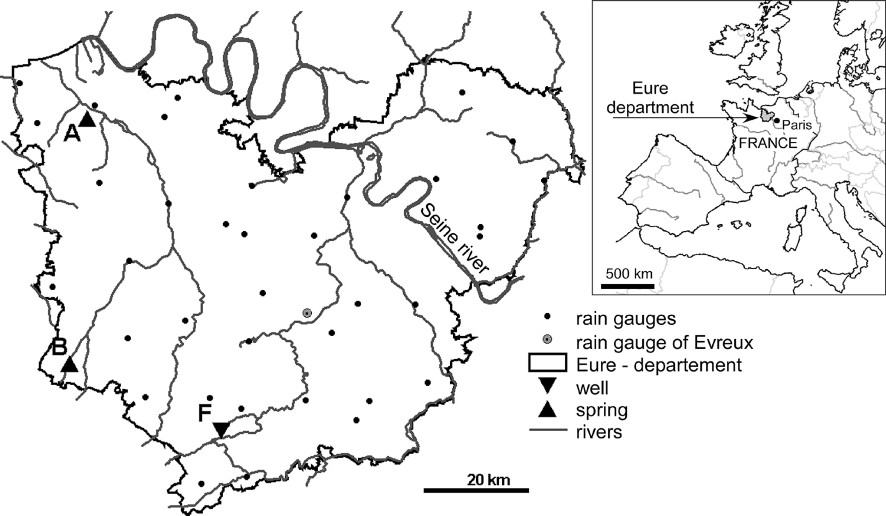
Map of the study area: springs, wells, and rain gauges.
Zone d'étude : forage, sources et pluviomètres.
Les chroniques de mesures sont ensuite traitées par autocorrélation. L'utilisation des analyses spectrales en hydrologie a été bien développée par de nombreux auteurs [5,17]. Les autocorrélations quantifient la dépendance linéaire de valeurs successives durant une période de temps. L'effet mémoire (temps correspondant à une valeur de 0,2 de la fonction d'autocorrélation) est un paramètre quantitatif mesurant l'inertie du système.
Les hystérésis [23] permettent de décrire les différents scénarios de transport des phases solides et dissoutes. Cette méthode a été adaptée à notre étude en étudiant les hystérésis (turbidité–chute de conductivité électrique) deux des cinq classes de Williams [23] sont ici observées : (i) hystérésis orthograde – la montée de turbidité précède la chute de la conductivité électrique, indiquant de la remise en suspension et du dépôt – et (ii) hystérésis rétrograde – la chute de conductivité précède la montée de turbidité, indiquant une remobilisation par transfert de pression (Fig. 2).
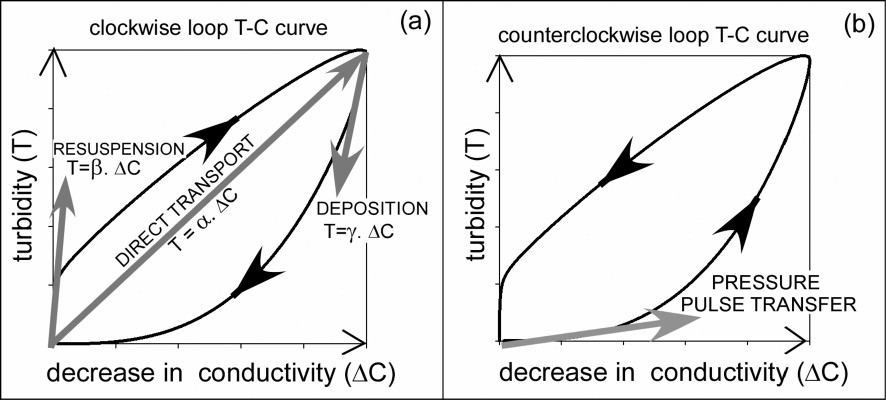
Classes of T–C relations, based on Williams [23]. (a) Clockwise T–C relation: the increase in turbidity precedes the decrease in electrical conductivity. Evidence of resuspension and deposition on the basis of a T–C curve. α is the mean slope, β is the slope of the T–C curve at the beginning of the response, and γ is the slope at the beginning of the recession. (b) counter-clockwise T–C relation: the decrease in conductivity precedes the increase in turbidity.
Classes de relations T–C, d'après Williams [23]. (a) Relation T–C orthograde : la montée de turbidité précède la chute de conductivité électrique. Mise en évidence de remise en suspension et dépôt. α est la pente moyenne, β est la pente en début de réponse et γ est la pente de début de récession. (b) Relation T–C rétrograde : la chute de conductivité électrique précède la montée de turbidité.
3 Résultats
Les chroniques de turbidité, conductivité électrique et pluie sont étudiées sur une période particulièrement pluvieuse de 35 j (Fig. 3). Deux périodes, correspondant aux événements pluvieux majeurs, sont analysées. Bien que le signal d'entrée soit homogène sur les trois sites, la forme des réponses est différente. Le site A reproduit bien le signal de pluie, tandis que les réponses des sites B et F sont plus étalées et se recouvrent dans le temps.
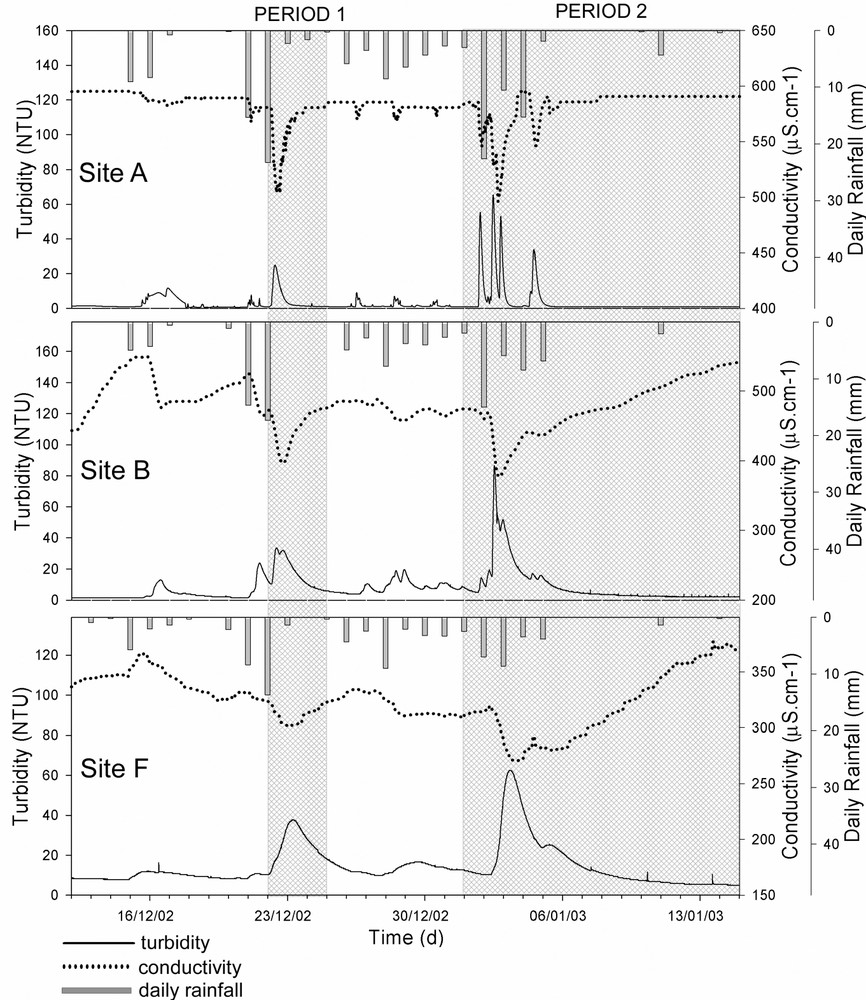
Turbidity and conductivity records at a 10-min time step, and daily rainfall at a 24-h time step from 11 December 2002 to 15 January 2003. Two wet periods were investigated: Period 1 (22–25 December 2002) and Period 2 (1–15 January 2003).
Chroniques de turbidité et de conductivité électrique au pas de temps de 10 min et pluie journalière au pas de temps journalier du 11 décembre 2002 au 15 janvier 2003. Deux périodes pluvieuses sont dégagées : période 1 (du 22 au 25 décembre 2002) et période 2 (du 1er au 15 janvier 2003).
Les autocorrélations sont effectuées à courte échelle de temps (35 j) et permettent de montrer l'inertie du transport dans les conduits : l'infiltration rapide uniquement (Fig. 4). Les effets mémoire pour la turbidité varient de 0,7 à 1,8 j et, pour la conductivité électrique, de 1,1 à 3,4 jours. Les hystérésis sont présentées sur la Fig. 4.
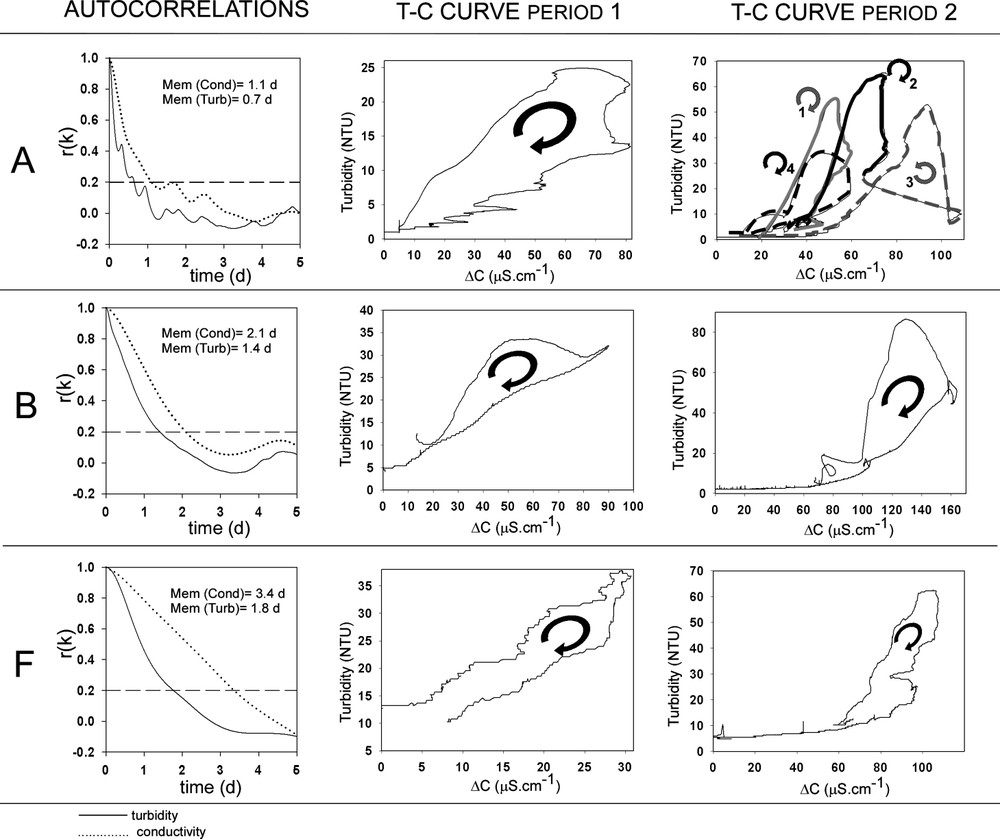
Turbidity and conductivity autocorrelations from 12 December 2002 to 15 January 2003 and T–C curves for Period 1 (22–25 December 2002) and Period 2 (1–15 January 2003).
Autocorrélogrammes des chroniques de turbidité et de conductivité électrique (du 12 décembre 2002 au 15 janvier 2003) et relations T–C pour la période 1 (du 22 au 25 décembre 2002) et la période 2 (du 1er au 15 janvier 2003).
4 Discussion
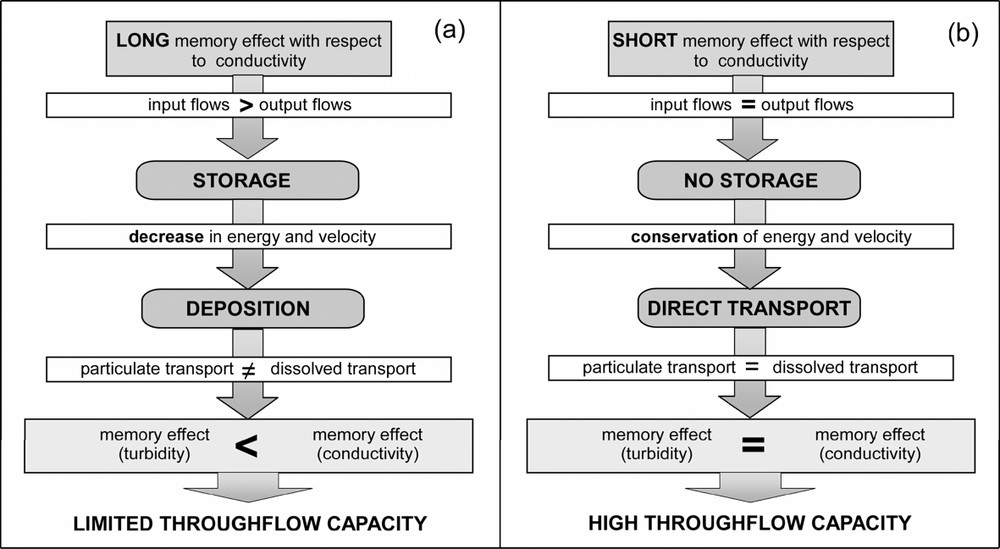
Les réponses en conductivité électrique sont généralement plus étalées et ont un effet de traîne plus important que les réponses en turbidité. Les effets mémoires sont plus importants pour la conductivité électrique que pour la turbidité. Le transport de la phase dissoute est plus inertiel que le transport de la phase particulaire. Le croisement des autocorrélations avec l'observation des hystérésis a permis de dégager deux types de fonctionnement hydrodynamiques (Fig. 5) :
- (i) lorsque l'effet mémoire en conductivité est important (B et F), il y a stockage et donc baisse de l'énergie, ce qui implique un dépôt de particules. Les transports des phases dissoutes et particulaires sont alors différents. La capacité d'écoulement du système est limitée ;
- (ii) un court effet mémoire en conductivité électrique (A) indique qu'il n'y a pas (ou que peu) de stockage, conservation de l'énergie et donc pas de dépôt. Les transports dissous et particulaires sont alors similaires et les effets mémoire faibles. La capacité d'écoulement du système est importante.
Hydrodynamic functioning through the karst network.
Fonctionnement hydrodynamique dans le réseau karstique.
Les hystérésis sont pour la plupart orthogrades, montrant du dépôt et de la remise en suspension. Le site A présente, durant le deuxième épisode, quatre pics de crue, les deux premiers et le dernier orthogrades et le troisième rétrograde. Les crues 1 et 3 sont présentées sur la Fig. 6. Le site A est très peu inertiel et est soumis à quatre impulsions de pluies successives. La troisième impulsion de pluie survient alors que le système n'a pas encore évacué les eaux de la seconde impulsion ; les conduits contiennent encore de l'eau de surface. De plus, il n'y a pas de matériel disponible pour la remise en suspension (site peu inertiel, donc pas de dépôt). La troisième impulsion de pluie se traduit par un hystérésis rétrograde : un transfert de pression dans le système permet la vidange de la crue précédente, impliquant alors une chute de la conductivité avant la montée de turbidité (arrivée des particules de surface). Un tel changement d'hystérésis ne peut avoir lieu qu'à deux conditions : (i) des évènements pluvieux suffisamment proches pour que les réponses se recouvrent et (ii) une inertie faible du système.
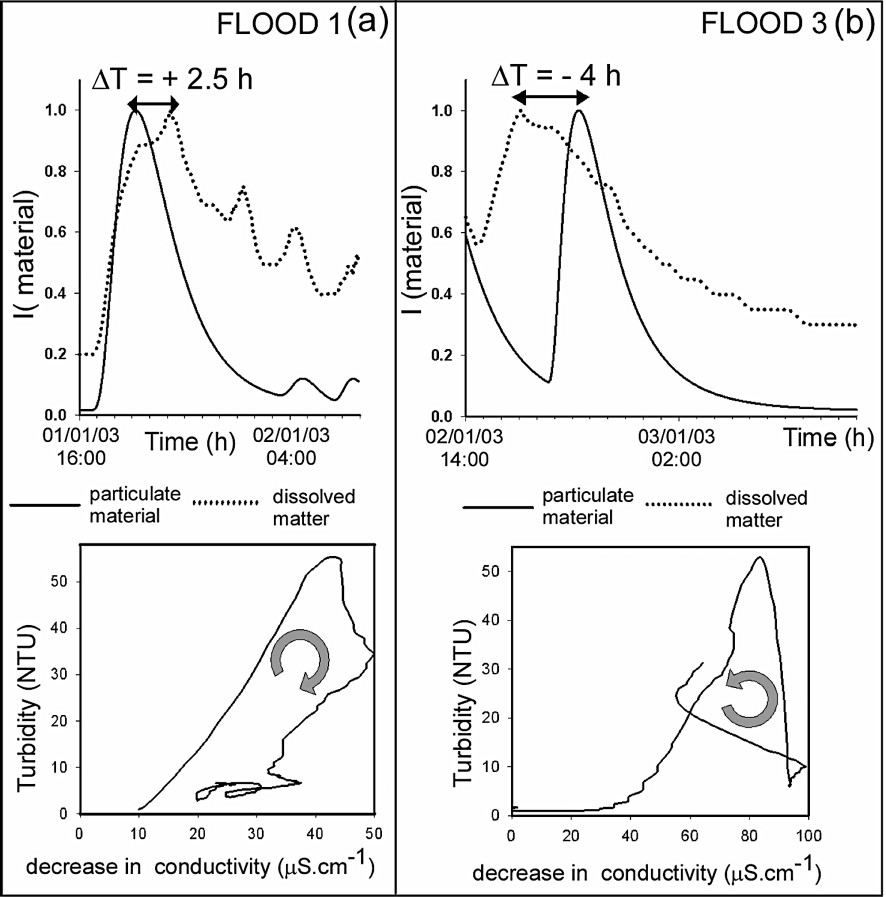
Turbidity and conductivity as tracers for suspended and dissolved solids transport at spring A, Period 2. I (material) corresponds to the normalized turbidity and to the normalized conductivity . (a) Event 1: the turbidity peak precedes the dissolved peak by 2.5 h and the T–C curve is clockwise. (b) Event 3: the turbidity peak lags the dissolved peak by 4 h and the T–C curve is counter-clockwise.
Turbidité et conductivité électrique : traceurs du matériel particulaire et dissous à la source A, période 2. I(material) correspond à la turbidité normalisée et à la conductivité électrique normalisée . (a) Événement 1 : le pic de turbidité précède le pic de matériel dissous de 2,5 h et l'hystérésis T–C est de type orthograde. (b) Événement 3 : la turbidité est en retard de 4 h sur la conductivité électrique et l'hystérésis T–C est de type rétrograde.
5 Conclusion
L'analyse couplée des chroniques de turbidité et de conductivité permet de comprendre le fonctionnement hydrodynamique des systèmes karstiques. Les autocorrélations permettent d'estimer l'inertie des transports dissous et particulaires. Lorsque le système a une capacité d'écoulement suffisante, les transports dissous et solides sont semblables et il n'y a pas ou que peu de dépôt et de remise en suspension. Dans le cas d'un système à capacité d'écoulement limitée, les particules sont alors déposées, les transports dissous et particulaires sont alors très différents.
1 Introduction
The Cretaceous chalk aquifer is the main water resource for the ‘Haute-Normandie’ region (France), which has been demonstrated to have karstic characteristics [6,18–20]. The chalk plateaus are covered with thick deposits of clay-with-flints and loess. During rain events, turbid surface runoff infiltrates through sinkholes, resulting in an increase in turbidity and a decrease in conductivity at wells and springs. The transport of the particulate phase is a complex process that involves deposition and resuspension at the event scale. The associated relevance for water quality, in particular for public drinking water supplies [2,8] underscores the importance of understanding suspended solids transport at the event scale.
Measurements of conductivity are an indication of the transport of dissolved material through karst [1], and autocorrelations of discharge and conductivity time series are valuable tools for studying aqueous phase transport in karst [11,15,17]. This type of analysis quantifies the inertia of the system, as it reflects its global functioning (both diffuse and conduit flow).
Few studies have investigated the relation between the transport of the dissolved phase and of suspended solids. Most of these studies have involved river systems. Williams [23] compared the transport of the dissolved and particulate phases in a river by sediment concentration-discharge () relations. In karst, Massei et al. [18] used conductivity records at the event scale to separate turbidity with an autochthonous origin from that with an allochthonous origin. Bouchaou et al. [4] used spectral analyses of turbidity and discharge at a multi-year time scale to show that there was no relationship between the two.
Here we couple the investigation of both dissolved phase and suspended solids transport over short time scales, which gives a new insight into the hydrodynamics of the investigated karst system. The short time scale allows us to focus on conduit flow, as the karst systems respond rapidly. The considered input signal consists of the same rain event; the difference in the responses between the different sites is an evidence of the differences of organization of the karst systems and their hydrodynamic functioning [22].
This study aims at showing that the coupled approach of dissolved and suspended solids transport by means of curves and autocorrelations gives evidence of the transport processes (deposition, resuspension, direct transport) through the karst network and allows understanding of the karst hydrodynamics.
2 Study sites and methods
2.1 Hydrogeological setting
The ‘Haute-Normandie’ region is very rural, with little urbanization, and most of the area is used for farming and livestock. The climate is maritime, with average temperatures of 10 to 12 °C and an annual rainfall of 650 to 1100 mm. The hydrologic network is typical of a karstic zone, with mostly low-order streams [10], as most of the flow is through the subsurface. The aquifer thickness varies from 50 to 300 m. The watersheds of the three sites are small, with an average surface area of a few tens of square kilometres.
The karst in this area is binary: the chalk plateaus are covered with clay-with-flints resulting from weathering of the chalk [12–14], and Quaternary loess [16]. These superficial layers constitute a fairly impervious cover of 5-to-40-m thickness over the chalk substratum. As a result, surface runoff infiltrates locally through sinkholes that penetrate the impervious layer into the chalk. Concentrated infiltration of surface water has favoured the development of the karst drainage structure, resulting in the rapid response to rain events observed at springs and wells. Transport through the aquifer has been estimated from 50 to 300 m h−1 [6,7,21]. This velocity corresponds to conduit transport, the flow velocity in porous media being of about 8 m h−1 [3].
2.2 Experiments
For this study, 30 natural (springs) or artificial (wells) karst outlets were instrumented for the measurement of turbidity, conductivity, and temperature throughout the Eure county (∼6000 km2). Three sites representative of the various types of hydrodynamic functioning were selected (Fig. 1). They are located in the same aquifer although they belong to three different karst hydrosystems. They have rapid responses to rain events (less than 24 h). Sites A and B consist of springs, with a mean discharge of 43 and 54 m3 h−1, respectively. Site F consists of a 25 m deep well-bore. The standing and pumping water levels are 8 m and 10 m below surface, respectively. This well is connected to the conduit network and the discharge rate is about 50 m3 h−1. Data were recorded at a 5-min time step. Rainfall data gathered at a daily time step by the Météo-France network were used, along with rainfall recorded at the Évreux city at a 1-h time step (Fig. 1).
2.3 Methods
Two methods were used to analyse the data: the autocorrelations and the curves.
2.3.1 Autocorrelations
The use of spectral analyses in hydrology was developed by Mangin [17] and Box et al. [5], who reasoned that the autocorrelation functions quantify the linear dependence of successive values over a time period. The correlogram estimates the memory of the system:
| (1) |
| (2) |
2.3.2 curves
Williams [23] in studying the relation between the sediment concentration (C) and discharge (Q) for river floods, established five classes of relations describing the five possible scenarios of transport of the dissolved elements and particulate solids. We adopted this method to karstic hydrogeology. relations are replaced by relations, where T is the turbidity (representing the suspended solids concentration) and C is the electrical conductivity, representative of discharge for our systems. For this study, two of Williams's five relations are relevant (Fig. 2):
- (i) the clockwise loop curve, reflecting an increase in turbidity preceding a decrease in conductivity; and
- (ii) the counter-clockwise loop curve, reflecting a decrease in conductivity preceding an increase in turbidity.
In the case of the clockwise curves, resuspension and deposition may be observed (Fig. 2). At the beginning of the flood, when the increase in turbidity is more important than the decrease in conductivity () resuspension of sediments previously deposited occurs. At the end of the flood, when the decrease in turbidity is more important than the increase in conductivity (), deposition of particulate matter within the karst network occurs.
The analysis of relations results in improved understanding of dissolved elements and suspended solids transport in response to rain events by highlighting the sedimentological processes occurring: direct transport, resuspension, or deposition.
3 Results
The time series for turbidity, conductivity, and rainfall used for this study are of 35-day duration. This period was unusually wet with cumulative rainfall ranging from 90 to 150 mm, depending on the site. We analysed two periods corresponding to two major rain events (Fig. 3).
3.1 Time series
The sites A, B, and F respond to all rain events, and the responses are more or less proportional to the input signal (rainfall). The shapes of the responses differ, however. Response at site A corresponds well to the rainfall signal, whereas responses at sites B and F are superposed in time; e.g., site F has only one peak for Period 2, reflecting superposition of the responses to each rain impulse.
3.2 Autocorrelations
Autocorrelation functions for turbidity and conductivity were calculated for the 35-day period. This type of analysis at a short time scale allows estimation of the inertia and hydrologic behaviour of the rapid infiltration features of the systems, i.e., transport of dissolved and solid material through the conduits (the overall functioning of the system, including diffuse infiltration, is not considered).
First, the autocorrelation function of the input signal (rainfall) is determined. This autocorrelation function has no peaks between 0 to 5 days. Memory effects for turbidity and conductivity are observed during the first five days following the rain event (Fig. 4). Comparison of the memory effects for the input signal (rainfall) and the output signal response (turbidity and conductivity) indicates that the autocorrelation of the response is not a function of the length of time between the rain events. The memory effects presented by the autocorrelograms vary from 1.1 to 3.4 days for conductivity and from 0.7 to 1.8 days for turbidity. The memory effect for conductivity is always greater than or equal to that for turbidity.
3.3 curves
curves were constructed for both periods (Fig. 4). For site A, the curve type varies from one event to the next. For Period 1, the curve is a clockwise loop; for Period 2, the curves are clockwise loops for the first two events, a counter-clockwise loop for the third event, followed by a clockwise loop for the fourth event. curves for site B and F are systematically clockwise loops.
4 Discussion: transport through the karst network
A karst aquifer can be seen as an open system with a boundary defined by the catchment limits, and with input, throughput, and output flows, mechanisms, and controls [9]. There is no physical limit separating the input system from the throughput system, or the throughput system from the output system, i.e., the karst system can be regarded as a kind of continuum.
The input signal corresponds to surface runoff and is thus a function of rainfall and soil saturation. For the three study sites, the catchment size, morphology, and soil properties are similar. The cumulative rainfall varies from 100 to 150 mm; however, the greatest responses are observed for the lowest cumulative rainfall (see, e.g., site F). Thus the difference in cumulative rainfall cannot be responsible for the differences in the responses, and the rainfall signal can be considered as homogeneous. If the inputs are homogeneous, the differences in the respective responses at each site are evidence of the differences in their internal organization and hydrodynamic functioning [22].
The shapes of the turbidity and conductivity responses are different (Fig. 3), indicating a difference in the transport of dissolved and suspended solids. The conductivity peaks are usually wider and more asymmetric than those of turbidity, and the recession is shorter for turbidity than for conductivity. Thus visual inspection of the time series indicates that transport of dissolved material has more inertia than transport of suspended solids.
In hydrology, autocorrelations are generally applied to time series data spanning several years, with the objective of describing the long-term functioning of the system [4,11,15,17]. Here we analyse autocorrelations at a short time scale to highlight the conduit flow through the karst network. Comparison of the memory effects gives insight into (i) the inertia for dissolved solids versus that of suspended solids, and (ii) the degree of inertia exhibited by the different sites. The memory effects determined at short time scales for the different sites can be compared to each other, but cannot be compared to those that might be calculated using a long-term time series, for example one or several hydrologic cycles.
The memory effects for turbidity are always shorter than or equal to those for conductivity. The duration of the decrease in conductivity is comparable to the duration of the increase in discharge. As interpreted by Mangin [17], a memory effect in discharge (analogous to conductivity in our case) is related to storage of surface water within the karst network. We thus propose two types of transport (Fig. 5). When the memory effect for conductivity is long (sites B and F), water is going into storage and the transport energy is decreasing, resulting in deposition of suspended solids. Transport of the dissolved and suspended solids are different (Fig. 5a), indicating a limited throughflow capacity. Alternatively, a short memory effect for conductivity (site A) indicates that there is little or no water going into storage, energy is conserved, and thus there is no deposition of suspended solids. Dissolved and suspended solids transport are quite similar and memory effects are short (Fig. 5b), indicating a high throughflow capacity.
Most of the observed curves are clockwise, indicating that resuspension and deposition are occurring. Sediment previously deposited in the karst network can be resuspended by a pressure pulse transfer in the conduit system and a velocity increase caused by a rain event before the arrival of surface water [18].
The greater ΔT, the more resuspension is occurring in the downstream part of the system. Conversely, when resuspension occurs in the most upstream part of the system, the autochthonous and allochthonous particles mix and are discharged simultaneously.
In most cases, the sites present only one type of curve for all events. However, at site A in Period 2, clockwise and counter-clockwise loops are both observed (Fig. 4). The breakthrough curves for dissolved elements and suspended solids are presented in Fig. 6 to detail this curve change. For event 1, the curve is clockwise and ; for event 3, the curves is counter-clockwise and . The third rain event occurs soon after the second (less than 1 day afterward) when the system has not yet fully recovered (conductivity is still low). This new rain event has a flushing effect, so that the conductivity peak occurs earlier than the turbidity peak. Usually, a flushing effect causes resuspension of particles, resulting in an increase in turbidity. At site A, the turbidity memory effect is very short (0.7 day), indicating that there is little or no deposition, and therefore there is no particulate matter available to be resuspended.
To obtain a change in type, two conditions must be fulfilled: (i) the time between the two rain events must be short enough so that the responses are superposed; and (ii) the inertia of the system must be low so that no deposition occurs (which would otherwise be removed after a new rain event).
5 Conclusion
The coupled analysis of turbidity and conductivity time series at a short time scale improves our understanding of transport processes in the karst network. The autocorrelations and curves demonstrate that transport of dissolved elements is different from that of suspended solids, as suspended solids can undergo resuspension and deposition.
Examination of the conductivity autocorrelation allows evaluation of the throughflow capacity of the systems. The curves indicate, first, that for systems with a long memory effect for conductivity, water is being stored in the conduits, resulting in deposition of suspended solids. The throughflow capacity is not sufficient for rapid drainage, and as a result, the memory effect for turbidity is shorter than that for conductivity. Second, the curves indicate that for a short memory effect for conductivity, the throughflow capacity is sufficient for direct transport to occur with no or very little deposition and resuspension. The transport of the dissolved and solid phases is more or less simultaneous. As a result, the memory effects are of the same duration for conductivity and turbidity.
This work, from a methodological point of view, by the comparison of dissolved elements and suspended solids, demonstrates a method for analysing transport processes: deposition, resuspension or direct transfer, and for understanding the hydrodynamic functioning of karst systems.
Acknowledgements
The authors would like to thank the Seine-Normandie Water Authority and the ‘Conseil général de l'Eure’ (France) for financial support and Prolog Ingenierie and the ‘Compagnie générale des eaux’ for technical support. We gratefully thank Dr B.J. Mahler for attentive corrections, and two reviewers (Dr Nathalie Dorflinger and Dr Valérie Plagnes) for their helpful comments.