

Version française abrégée
De nombreuses études ont montré, ces dernières années, la capacité de l'altimétrie satellitaire à mesurer les niveaux d'eau des fleuves et des plaines inondées [4,9,10,15]. Le débit est un paramètre plus incertain que les hauteurs d'eau, mais indispensable pour estimer des bilans d'eau ou de matière. Dans cette étude, nous présentons une application de l'altimétrie satellitaire à l'estimation du débit du fleuve Amazone.
À l'aide de données de débit, déduites d'une relation d'étalonnage et de mesures de niveau d'eau in situ (dans la suite on appellera ces données : débits « in situ ») et de mesures de niveau d'eau basées sur l'altimétrie du satellite Topex/Poséidon (T/P), nous calculons une courbe d'étalonnage sur la période de recouvrement des deux types de mesures, puis utilisons cette courbe et les données altimétriques pour reconstruire une série temporelle de débits aux époques pour lesquelles il n'y a pas de débits « in situ ». Cette approche est identique à celle classiquement utilisée pour calculer les débits « in situ », mais ici on utilise les hauteurs d'eau altimétriques au lieu des hauteurs d'eau in situ. Trois sites ont été considérés (Fig. 1) : Manacapuru (fleuve Solimões), Jatuarana (proche de la confluence du Solimões et du Rio Negro) et Óbidos (fleuve Amazone). Les données de débit « in situ » proviennent de l'agence de l'eau brésilienne (ANA). Elles sont disponibles sur Internet [21]. Ces mesures « in situ » couvrent les périodes 1996–2001 pour Manacapuru, 1993–1999 pour Jatuarana et 1992–1996 pour Óbidos. La Fig. 2 montre les débits pour chacune des trois stations. Ces débits sont dominés par un signal saisonnier, auquel se superpose un signal interannuel. Nous avons analysé 10 années (1992–2002) de données T/P et calculé les niveaux d'eau de l'Amazone aux intersections entre les traces satellite et le fleuve. La Fig. 3 montre, sur fond d'images SAR (Synthetic Aperture Radar) du satellite japonais JERS, les intersections des traces du satellite T/P les plus proches des stations in situ (Manacapuru, Jatuarana et Óbidos, situées à des distances respectives de 140, 25 et 130 km des traces T/P). Sur la Fig. 3, les fenêtres rectangulaires délimitent les points de mesure T/P considérés (indiqués par les points blancs) pour construire les courbes de niveau d'eau. Pour l'intersection située à la confluence du Rio Negro et du Solimões, seules les mesures de la zone 1 ont été considérées, les autres étant trop bruitées. La Fig. 4 présente, pour les trois intersections T/P–fleuve, les séries temporelles de niveau d'eau pour 1992–2002. Pour les années communes aux mesures de débit in situ et de niveau d'eau T/P, nous avons calculé une relation empirique entre le niveau déduit des mesures T/P et le débit estimé aux stations in situ par courbes d'étalonnage (Fig. 5). Nous avons distingué les périodes de hautes eaux, de basses eaux, et de montée/baisse de niveau. La Fig. 6 présente, pour les trois stations, les courbes de débit reconstruites à partir des données T/P, ainsi que les différences avec les débits in situ. On note que les meilleurs résultats sont obtenus pour la station Jatuarana, la déviation standard associée étant de 5550 m3 s−1, ce qui représente 4% du débit annuel moyen. Pour Manacapuru et Óbidos, les déviations standard sont respectivement de 100 m3 s−1 (7% du débit annuel moyen) et de 19 400 m3 s−1 (17% du débit annuel). Nous avons également calculé le débit annuel moyen à Jatuarana et comparé les valeurs in situ avec celles déduites de T/P pour chaque année de 1993 à 1999 (Table 1). Cette comparaison indique que le débit annuel moyen estimé à partir des données T/P diffère des valeurs « in situ » de 6% pour Óbidos et pour Jatuarana. Ces résultats montrent que la précision des estimations du débit de l'Amazone à partir des données T/P est, dans certains cas, comparable aux précisions classiques des données de débit « in situ » issues des courbes d'étalonnage et de mesures de niveaux d'eau in situ.
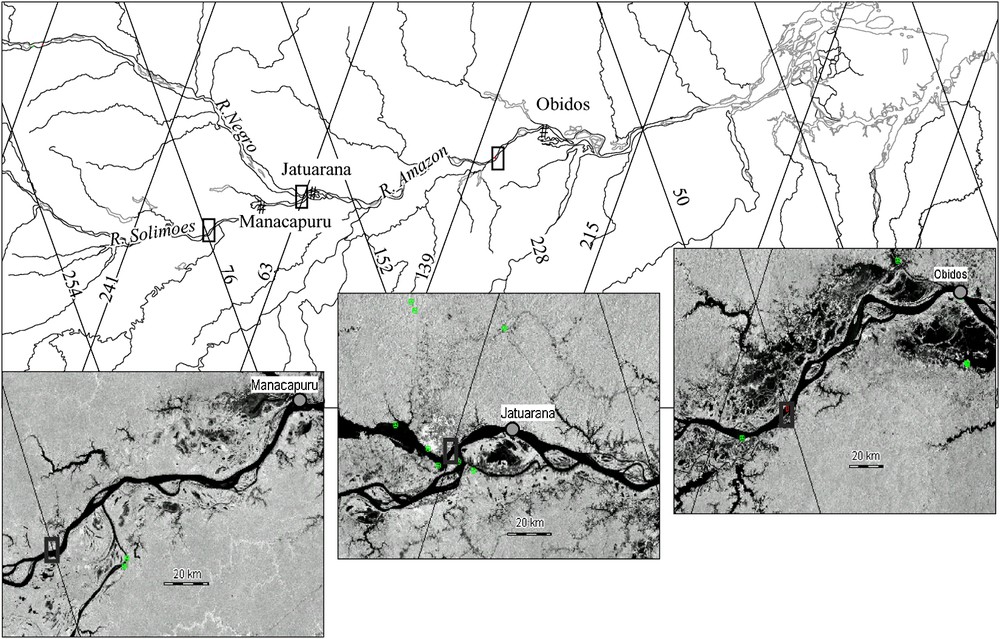
T/P tracks (straight solid lines) and gauging stations location. The areas of interest are presented more in details as black rectangles on the background of the radar images from the JERS satellite. Please note that these rectangles do not represent the actual geographical selection of data (see Fig. 3).
Traces du satellite T/P et position des stations de mesure de débit in situ. Le détail des zones d'intérêt est présenté en dessous sur fond d'images radar du satellite JERS. À noter que les rectangles ne coïncident pas exactement avec la zone de sélection géographique des données (voir Fig. 3).
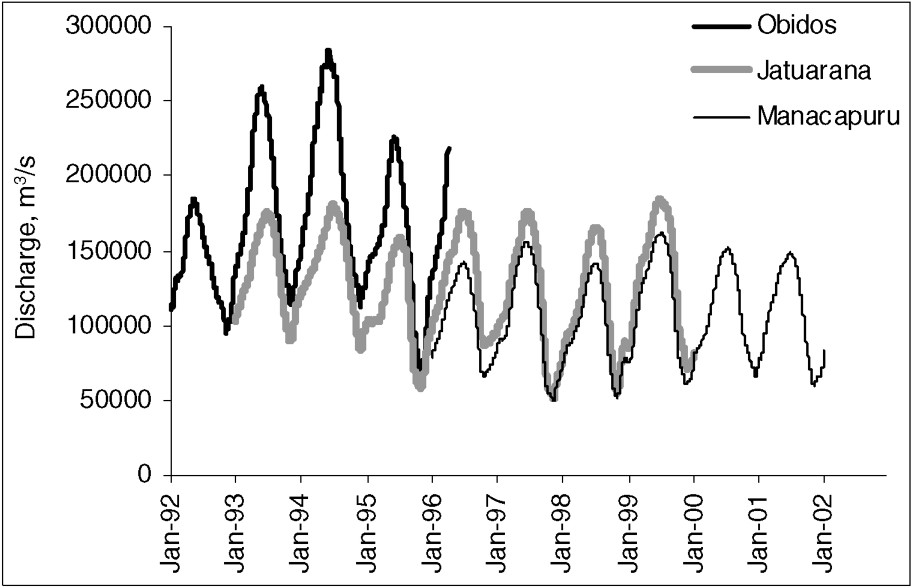
In situ discharge time series at the Manacapuru, Jatuarana and Óbidos stations.
Séries temporelles de débit in situ pour les stations Manacapuru, Jatuarana et Óbidos.
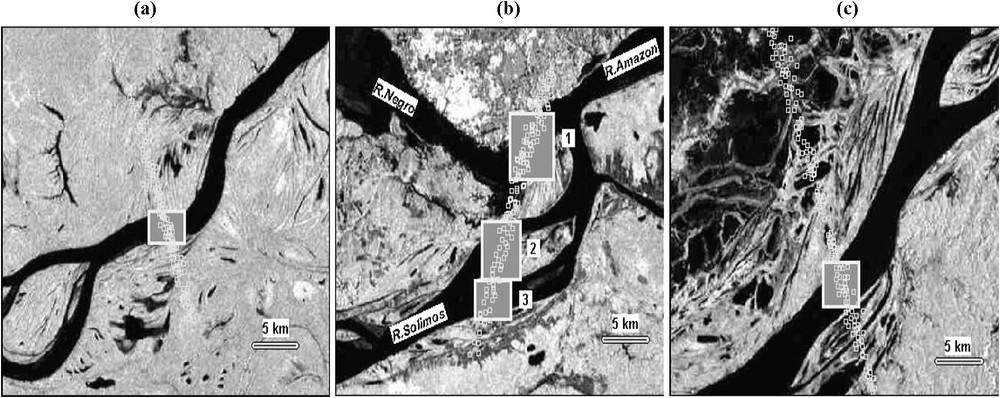
Geographical selection of altimetric data for track 76 near Manacapuru (a), track 63 near Jatuarana (b) – numbers denote various zones considered – and track 228 near Óbidos (c).
Sélection géographique des données altimétriques pour la trace 76 près de Manacapuru (a), la trace 63 près de Jatuarana (b) – les chiffres montrent les zones considérées – et la trace 228 près d'Óbidos (c).

T/P water-level time series (solid grey lines) and associated standard deviation for each 10-day period (black lines): (A) track 76 near Manacapuru, (B) track 63 near Jatuarana, (C) track 228 near Óbidos.
Séries temporelles de niveau d'eau d'après T/P (lignes en gris foncé) et déviation standard associée pour chaque période de 10 j (lignes noires) : (A) trace 76 près de Manacapuru, (B) trace 63 près de Jatuarana, (C) trace 228 près d'Óbidos.
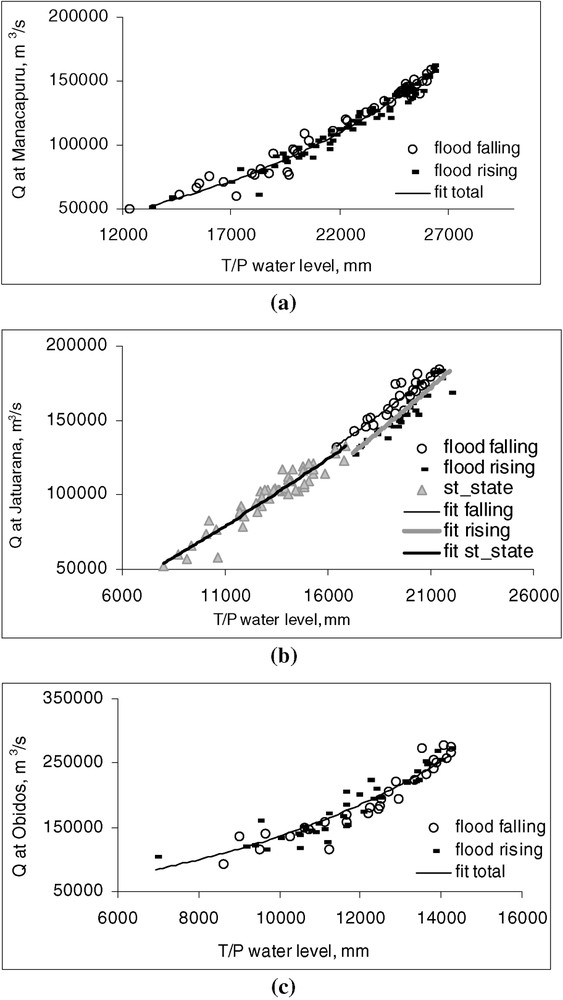
Rating curves between T/P water level and in situ discharge: (a) track 76 and Manacapuru, (b) track 63 and Jutuarana, (c) track 228 and Óbidos. Various dots denote various hydrological phases.
Courbe de tarage entre niveaux d'eau mesurés par T/P et débits in situ : (a) trace 76 et Manacapuru, (b) trace 63 et Jatuarana, (c) trace 228 et Óbidos. Les points indiquent les différentes phases du régime hydrologique.

T/P-based discharge time series and in situ data (upper plots), and residuals (lower plots): Manacapuru (A), Jatuarana (B), and Óbidos (C).
Séries temporelles de débit d'après T/P et mesures in situ (courbes du haut) ; résidus (courbe du bas) : Manacapuru (A), Jatuarana (B) et Óbidos (C).
Mean annual discharge (in km3) at Jatuarana based on in situ and T/P data for 1993 through 1999, and difference between the two (in % of the in situ annual mean)
Débit annuel moyen (en km3) à Jatuarana, déduit des mesures in situ et calculé avec les données T/P pour 1993–1999, et différence entre les deux (en % de la valeur annuelle in situ)
| Year | 1993 | 1994 | 1995 | 1996 | 1997 | 1998 | 1999 |
| ‘In situ discharge’ | 4239 | 4413 | 3486 | 4119 | 3736 | 3562 | 4205 |
| T/P-derived | 4217 | 4405 | 3568 | 4099 | 3902 | 3615 | 4166 |
| Difference in % of the ‘in situ’ annual mean | 0.5 | 0.2 | −2.4 | 0.5 | −4.4 | −1.5 | 0.9 |
1 Introduction
Application of satellite altimetry for studies of large river systems is now a rapidly developing field (e.g., [1,4,8–10,15]). Most of existing altimeter-based studies on river basins have been so far limited to the comparison of satellite-derived water levels with in situ observed levels. However, for hydrological studies river discharge is a much more useful parameter than water level. Thus the next logical step is an attempt to use satellite river level data for calculation of river discharge. In a previous study, we showed that altimetry data can be used for calculating discharge and applied the method to one of the largest Arctic rivers: the Ob' River [15].
Here we present another example of the use of TOPEX/Poseidon (T/P) satellite altimetry for estimating discharge at several sites along the Amazon River. We establish empirical relationships (rating curves) between satellite-derived water levels and river discharge data available over limited time spans (several years) at in situ gauging stations. We further use the rating curves for computing discharge over the 10-year time span of T/P altimetry data (1992–2002).
2 Data used
2.1 In situ data
The Amazon River is monitored by the Brazilian Water Agency (ANA). For the period of analysis (1992–2002) of the TOPEX/Poseidon (T/P) data, there are about 150 gauging stations for which daily level and discharge data are available, and for some of them, additional information (e.g., morphology parameters of the river channel, rating curves, etc.). Note that discharge data in the ANA database are obtained from stage–discharge relationships (rating curves). In the following we call these discharge data ‘in situ’ discharge, although we are aware that these are not direct discharge measurements. Three in situ stations, located in the proximity to the T/P tracks were selected for this study (Fig. 1): (1) Manacapuru on the River Solimões, located 140 km downstream from the T/P ground track 76; (2) Jatuarana on the Amazon River, 25 km downstream from the Rio Solimões and Rio Negro confluence and about 30 km downstream from the T/P track 63; and (3) Óbidos, on the Amazon River, located about 130 km downstream from the T/P track 228. In situ discharge data were taken from the ANA database on the Internet [21]. When selecting these stations, we have looked at the length of in situ time series of daily discharge data (at least three seasonal cycles) as well as the amount and quality of the available T/P data at the nearby river/track intersection [4,18]. The available discharge data cover the periods 1996–2001 for Manacapuru, 1993–1999 for Jatuarana and 1992–1996 for Óbidos.
At the three selected stations, the amplitude of the seasonal water level cycle is relatively high and progressively decreases downstream from 13 m at Manacapuru to 7.5 m at Óbidos [19,20]. During the time span of analysis (variable from one station to another), the mean annual discharge (Q) was 106 400 m3 s−1 at Manacapuru (over 1996–2001), 128 600 m3 s−1 at Jatuarana (over 1993–1999) and 168 200 m3 s−1 at Óbidos (over 1992–1996). The seasonal Q variability is comparatively not as high as level changes, maximal discharge being only 2–3 times larger than the minimum value. Interannual Q variations are also small, in the order of 20–30% of the annual values. The low water period of the seasonal cycle is short: it starts in October–December and lasts for 2–3 months only. Then the discharge increases gradually, reaching its highest values in June–July. The water depletion is gradual and lasts for 3–5 months. Fig. 2 shows the discharge time series for the three stations.
2.2 Satellite data
We used 10 years (1992–2002) of altimetry data from the TOPEX/Poseidon (T/P) satellite. The data consist of range values from radar echoes and averaged values at 1 s interval, corresponding to along-track ground spacing of 596 m and 5.96 km, respectively. The T/P satellite is on a 10-day repeat orbit. The 10-year T/P dataset analysed covers the period from September 1992 to August 2002. As of September 2002, T/P moved to a new orbit, with different ground tracks than those presented in Fig. 1. Environmental and geophysical corrections of the altimeter range measurements relevant to the Amazon region have been applied [2]. Water heights are referred to the JGM3/OSU95A geoid surface [2].
We first define a ‘virtual’ station corresponding to the intersection of the T/P track with the river. All data included inside the virtual station are then considered. In order to minimize the potential contamination of the T/P altimetry radar signal by land reflections, and at the same time to retain a sufficiently large number of altimeter measurements on water, we have performed a geographical selection of the data (see Fig. 3). For the purpose of precisely locating the satellite track river intersection, we used Synthetic Aperture Radar (SAR) images of the JERS-1 satellite [12].
The ground track 63 (see track numbers on Fig. 1) is the closest track for the stations of Manacapuru and Jatuarana. It passes nearby the confluence of the Solimões and Rio Negro rivers and crosses both of them. This area has many islands, river arms, levees and oxbow lakes. This complex morphology perturbs the altimetric signal and leads to noisy water-level time series. In order to reduce the noise, we have considered three separated areas (Fig. 3b). Area 1 is on the Rio Negro River. We have excluded all T/P measurements covering bays, islands and arms. Area 2 is on the Solimões River and includes points over the left river arm and over the head of island. Area 3 is on the right branch of the Solimões River. The water-level time series from area 2 are very noisy, especially during the low-water period. The water-level time series from area 3 are less noisy, but the number of altimetric measurements (10–15 per year) is insufficient for the calculation of river discharge. It is over area 1 that the water-level time series is best quality (Fig. 4b) and we no longer consider areas 2 and 3.
Although the Manacapuru station is closer from track 63 than from track 76 (see Fig. 1), we further considered the water-level time series at the T/P track 76 intersection with the Solimões River for computing the discharge at Manacapuru (see Fig. 3a), since as discussed above, the area 3 of the T/P track 63 crossing the Solimões River is too noisy and suffers many data gaps. The width of the river at the crossing with the T/P track 76 is 2.5 km. It is a little narrower than area 3 on track 63, but the time series is more complete.
For the Jatuarana station, we used the data over area 1 of T/P track 63 over the Rio Negro channel (Fig. 3b). This area is constantly affected by the backwater phenomenon [16], and most likely the level regime here is completely dependent on that of Solimões. We have checked that the satellite-derived water level over area 1 is synchronous with in situ water level data collected at the Jatuarana station, located 30 km downstream on the Amazon River. In [5] the water level measured on Rio Negro at Manaus have been used to reconstruct long term water-level time series as far as at the Óbidos gauge station. The river channel at the track 63 is not as wide (2.2 km), but T/P crosses it obliquely, so that the intersection has a 6-km length. This width of intersection significantly improves the quality of available T/P data, decreasing the standard deviation and increasing the number of observations. The T/P track 228 (near Óbidos) has a 4-km intersection with the Amazon River, with a large flooded plain on the left bank. We selected only the T/P measurements over the main river channel. Small portions of dry land can contaminate the altimetric signal over the river, resulting in the deterioration of the satellite-derived water-level time series. We also did not use the T/P measurements over the vast flood plain, because the water regime here can differ from that of main channel, especially during the low-water period.
We have applied two filtering techniques to the T/P data. First we have selected every data and excluded all values exceeding statistical criteria of . Then we have estimated the water level for each T/P track–river intersection. The second filtering step consisted of removing data points deviating by more than 2 m from the best fitting straight line. Some of the deleted data could be real, as for example caused by the backwater or tide (for track 228). In classical hydrological analyses, such outliers are tested against addition information and some specific correction methods are used. Here we simply excluded these outliers. As a result we obtained water-level time series with 20–30 representative data per year (Fig. 4).
3 Level-discharge relations
The river discharge is typically determined from the functional relation between water level (or stage) and measured discharges. This relation, named ‘stage–discharge rating’ or ‘rating curve’, is specific to each gauging station and its development is regulated by the different national and international standards such as [17]. In practice, for one gauging station, there could be several relationships corresponding to different hydrological regimes. Therefore the first step for the development of level-discharge relation is to evaluate all available data against monotony. If the data are dispersed, then a detailed analysis of the relation is required. As a rule, the data are split into sub-series for different time periods (seasons) or different level ranges, and then are subjected to separate processing.
There are two possible approaches to calculate the discharge at a given point from the satellite-derived level data. The first one is to use the official rating curve for a given in situ point. For this purpose we should establish the relationship between in situ and T/P-derived water level measurements and then apply the rating curve. Here we used another approach, consisting of establishing a direct relationship between (i) T/P-derived level at the T/P-river intersection and (ii) observed discharge at the gauging station (we denote such relationship as ). This approach allows us to avoid additional errors that can result from the additional step of using in situ water level data, especially those related with the time lag between level changes at ground track/river intersection and in situ gauging station.
The diagrams are presented in Fig. 5. This figure shows that, for the Manacapuru station, the rating curve has mainly a monotonous character during all hydrological phases (Fig. 5a). The curve for Jatuarana (Fig. 5b) is divided initially into two segments: (i) when the water is within the channel and (ii) when the water flows over the banks. The epoch at which water starts to flood the plain was determined as an inflection point from the analysis of the water level–river width diagram (not shown here). Then the split of the dataset into several branches reveals a phenomenon of hysteresis (or looped relationship). In general, the hysteresis takes place when the water slope on the rising limb of the hydrograph differs from that on the falling limb. In a classical case, the slope, and consequently the discharge, is higher at the period of flood rising. The backwater phenomenon, that is typical for the Rio Negro mouth at Manaus, results in an inverted relationship. The same type of behaviour is noted in the diagram, where the discharge values at the same level are higher during the period of flood falling than flood rising. The plot for the Óbidos station is more scattered (Fig. 5c). We suppose that this higher dispersion has two main causes: (a) the influence of ocean tides that rise along the Amazon River up to 1000 km upstream [14] and (b) higher dispersion of the T/P water level measurements (see Discussion section).
A regression analysis was applied to obtain the best fitting rating curves. The rating curves were approximated by parabolic or power functions. Data for Jatuarana (T/P track 63) were separated into three periods, as explained above, and corresponding adjustment was applied to each period. In order to quantitatively estimate the improvement of the Q calculation using three functions instead of only one, we also considered a single power function. Q at Manacapuru and Óbidos was computed using a single relationship without splitting the data into different hydrological regimes. Callède et al. [6,7] have evaluated complex stage-discharge relationship at Óbidos, and concluded that the errors resulting from the use of a single relationship could be neglected compared with the other sources of uncertainty.
4 Results
The T/P-derived discharge time series are presented in Fig. 6 for the three stations. In Fig. 6 are also shown the residual curves (differences between in situ and T/P-derived discharge). The best results were obtained for the Jatuarana station. For this station, the mean accuracy of daily T/P-based Q is about 4%, i.e., the same order of magnitude as in situ Q accuracy based in the classical approach (use of the rating curve between in situ stage and discharge data) [11,13]. The standard deviation of the residuals is 6500 m3 s−1, i.e. about 5% of the mean annual discharge. For 95% of the modelled discharge data, errors do not exceed 10% of in situ discharge. Using three rating curves instead of a single one decreases the standard deviation of the residuals to 5550 m3/s (4% of the mean annual discharge). This improvement is mainly related to a decrease of the residuals during the period of water depletion.
Low residuals are also obtained at Manacapuru where the standard deviation is 7100 m3 s−1 (7% of the mean annual discharge). Discharge at Óbidos has the highest errors, the standard deviation amounting 19 400 m3 s−1 (17% of the mean annual discharge). This results from the lower correlation between at track 228 and discharge at Óbidos, as explained in Section 2.
The deterioration of the satellite water level measurements during the low-water season along the Amazon River was previously noticed by de Oliveira Campos et al. [10]. Such deterioration, well visible on tracks 76 and 228, leads to lower accuracy of the T/P-based discharge during this period of the year. On the other hand, we found neither significant gaps nor decrease of the T/P data quality in September–December at track 63. Probably, the length of the T/P–river crossing (of 6 km), as well as the geographical data selection performed here, excluded noisy data during the low-water season.
In order to assess applicability of satellite data for calculation of annual discharge values we have computed from the T/P-based discharge data an annual mean water flow for each year between 1993 and 1999 for the stations with the worst (Óbidos) and best (Jatuarana) relationships established. We further compared these values to the in situ mean annual discharge (see Table 1 for Jatuarana). We note that, in terms of annual averages, the mean differences between T/P-based and in situ discharge is less than 6% for Óbidos and 1.5% for Jatuarana.
5 Discussion
What are the factors affecting the satellite-based discharge accuracy? Errors can originate from two sources. One source is the uncertainty associated with the satellite water level measurement. Previous investigations [10], as well as this study, found a decrease in accuracy of T/P water level measurements over the Amazon during the low water season. This observation likely results from the contamination of vegetated areas, sand beaches and dry land reflections in the reflected radar signal. The second source of errors is related to the uncertainty in the water level-discharge relationship. The main limiting factor here is the distance between satellite track and the in situ gauging station, resulting in non-synchronous variations of water level. In some cases, water-level time series from T/P and from the gauging station can be totally incompatible because of important differences in the water regime. For example, at Óbidos, on the Amazon River, we initially planned to use other tracks that lie further downstream from the station and which have more data. But it turned out that they were not suitable as they are strongly affected by tributaries and tides. So we only considered the upstream track that is farther away from the station but better corresponds to the water regime of this station.
In this work, we simplified the classical hydraulic corrections to the rating curve by splitting the data onto various hydrological phases. At Óbidos station, this simplification led to an overestimate of the water discharge at the flood peak, seemingly as a result of the water storage and water loss in the vast floodplain that lies between the track and the gauge station. However, to properly account of this, additional studies are necessary. It is certainly possible to assess further estimations of the uncertainties associated with the proposed method with more complete in-situ data records. Another source of uncertainty may be the temporal interpolation of T/P measurements, available every 10 days, but it is likely to be much smaller than the one resulting from the rating estimation.
Nevertheless, these first results show that the accuracy of the Amazon River discharge estimated from the T/P data is on the order of 4–17% (daily values) and 0.5–4% (mean annual values). As we noted above, further developments will certainly improve the accuracy of monitoring of large rivers from satellite altimetry. First of all, retracking of raw altimetry waveforms (e.g., [3]) will significantly increase the accuracy of the altimetry-based water levels as well as the number of usable data.
Acknowledgements
We wish to thank Franck Mercier from CLS, Toulouse, France, for providing wet tropospheric corrections data.