

1 Introduction
This study aims to implement a statistical-regressive model designed to simulate the seasonal and interannual biogeochemical budgets, with a special focus on carbon, at the scale of the Amazon River basin. Global riverine transport of organic carbon yields a total export to the oceans of around 600 (± 300) Tg C yr−1 (Meybeck, 1982) and contributes significantly to the global carbon budget. Based on a 7-year monitoring program (1994–2000, HIBAM project), Moreira-Turcq et al. (2003a) estimate that the Amazon River exports, at the outlet of Óbidos: 32.7 Tg C yr−1 organic carbon, distributed into 27.5 Tg C yr−1 coming from the dissolved organic fraction, and 5.2 Tg C yr−1 from the particulate organic fraction. This is quite different from the assessments based on CAMREX results (Bustillo et al., 2011): 34.5 Tg C yr−1 distributed into 21 Tg C yr−1 DOM and 13.5 Tg C yr−1 POM (12 from silt-clay fraction FPOM, 1.5 from sand fraction CPOM). Dissolved inorganic carbon supplies on average, at the outlet of Óbidos, 37 Tg C yr−1, distributed into 10 Tg C yr−1 coming from CO2 and 27 Tg C yr−1 from HCO3−. Amazonian rivers are supersaturated with respect to CO2, resulting in large gas evasion fluxes, evaluated to 550 Tg C yr−1 for the whole Central Amazonia (Richey et al., 2002), including the downstream reaches of the Amazon's tributaries. The same was observed for methane whose emission rate was evaluated at 1.3 Tg C.yr−1 for the main stream Solimões/Amazon floodplain (54–70°W) by means of microwave remote-sensing (Melack et al., 2004). Thus, the Amazon River carbon budget represents a very significant component of the global carbon cycle.
During the last four decades, many scientific projects were carried out to investigate the nature and magnitude of processes driving the compositions and fluxes of carbon towards the ocean and towards the atmosphere: the Alpha-Helix program (Univ. California, San Diego: Amazon expedition in 1967 and 1976–1977), the Carbon in the Amazon River Experiment (CAMREX, Univ. Seattle: 1982–1991), the Large-Scale Biosphere-Atmosphere Experiment in Amazonia (LBA, with Brazilian research teams: 1995–2005), Hydrology and Geochemistry of the Amazon Basin (HIBAM, managed by a French IRD team: since 1995). All this research contributed to characterize more accurately the forms, sources and dynamics of organic materials in the Amazonian rivers, recognizing that riverine organic substances might influence significantly water quality, fisheries production and global carbon budget (Hedges et al., 1986).
The Amazon River covers ca. 7% of exoreic continental areas, and drains around 6,300 km3/a (Berner and Berner, 1987). It represents on average 17% of the global flow discharge towards the ocean. Its contribution to global fluxes of dissolved species (5.4%) and particulate materials (6.6%) is also significant. The climatic forcing related to ENSO events and surface sea temperature leads to important interannual variability of moisture transport not only in the Amazon River basin (Marengo, 2005), but also on the whole intertropical belt as inferred from satellite observations which provide new insights on the distribution of humidity and on the role of cloud systems in the monsoon circulation patterns (Roca et al., 2010). This modulates the amount and distribution of rainfall, and subsequently the discharge of the Amazon River. The periodicity of surface climate variability, well documented by Marengo (2004), promotes large seasonal and interannual variations of hydrological (Molinier et al., 2009), geochemical (Devol et al., 1995) and sedimentary (Dosseto et al., 2006) budgets. Recent land-use changes, related to the deforestation of the Amazonian rainforest, tend to alter the budgets of exportation of the basins (Markewitz et al., 2001), at least at the scale of small catchments. This was extremely well documented for the Ji-Parana River and its tributaries (state of Rondônia, Brazil) through the intensive monitoring of inorganic (Biggs et al., 2002) and organic variables (Bernardes et al., 2004) aiming to assess the consequences of land-use changes on the compositional characteristics of river water. Except for the increasing trend detected by Martinez et al. (2009) for the Amazon suspended sediment discharge, the impacts attributable to anthropogenic forcing are not yet perceivable at the scale of the whole Amazonian basin due to the buffering action of lowland areas and stream corridors which obliterate the perturbations observed upstream (Tardy et al., 2009). As a matter of fact, the climatic forcing appears to be the key factor driving the mass balance variability of the Amazon River basin.
However, the nonuniqueness of the relationship between mass balances and river flow, due to the variable regional input and to the well-known hysteretic shape of the chemograph with respect to hydrograph (Tardy et al., 2005), does not facilitate the discharge-derived prediction of biogeochemical fluxes. It is therefore necessary (1) to reconstitute chemical signals at the outlet of the major tributaries which provide fairly stable hydrogeochemical patterns, and then (2) to simulate the chemical signal of the Amazon River, using empirical equations describing in-stream diagenesis (Bustillo et al., 2010) in view to modulate incoming signals.
The question is now to make explicit the impact of climate variations on the biogeochemical response (fluxes and concentrations) of the Amazon basin. To achieve this purpose, we present here a statistical-regressive model, taking into account four sources of variability: variable regional input, variable hydrological input, river processes and river-floodplain connectivity. The calibration of this model relies on the data from (1) the CAMREX (1982–1991) dataset, available on Pre-LBA CD-ROM (Richey et al., 2008) and from (2) the multiyear time-series of Marchantaria (Devol et al., 1995), located between Manacapuru and Manaus (Solimões River, upstream area is 2.15 M km2).
The dataset used in this study is presented in the next section. Then, the processes controlling the biogeochemical variability of the Amazon River with respect to fluxes and concentrations are identified and discussed. In the fourth section, the scientific bases of the statistical-regressive model are presented, and the results are analyzed in the fifth section.
The originality of this contribution is that the relative importance of several relevant factors and/or processes on the variability of chemical signals observed in the Amazon River is assessed by means of a robust modelling approach linking hydrological and biogeochemical information. It is of interest because it provides tools to forecast and/or diagnose rather straightforwardly the changes of biogeochemical fluxes and concentrations (or signals) related to climate changes, land-use changes, and/or floodplain management.
2 Data set
A huge database related to the sampling and analytical programme called CAMREX (1982–1991), was developed over eight cruises (+ five on a restricted range of parameters) at the outlet of seven major tributaries (1): Iça, Japura, Jutai, Jurua, Purus, Negro and Madeira and (2) along the Amazon River at the eleven following stations: Vargem Grande, Santo Antonio do Iça, Xibeco, Tupe, Jutica, Anori, Itapeua, Manacapuru, São Jose da Amatari, Paura and Óbidos (4,619,000 km2), the latter being the outlet of the studied area. Thus, it becomes possible to compare inputs (or incoming signals) by tributaries and outputs (or outgoing signals) by the Amazon River at different locations along the main stream (Fig. 1). In this study, the samples from cruises 9 to 13 were not used because the chemical parameters required for modelling purposes were not all analyzed. One of the greatest interest of the CAMREX database resides in the very large quantity of analyzed parameters: major ions (Na+, K+, Ca2+, Mg2+, HCO3−, SO42−, Cl−, concentrations given in μM), organic species: dissolved organic carbon (DOC, mg/L), dissolved inorganic carbon (DIC, μM) and particulate organic carbon (POC, mg/L), with a distinction between the fine fraction (POCF, size < 63 μm) and the coarse fraction (POCC, size > 63 μm), suspended sediments (mg/L): with a distinction between the fine fraction (FSS, 0.45 μm < size < 63 μm) and the coarse fraction (CSS, size > 63 μm), biogenic species: SiO2 (μM), dissolved organic nitrogen (DON, μM), NO3− (μM), NH4+ (μM), dissolved phosphorus (PO4, μM) and total phosphorus (Pt, mg/L), particulate organic nitrogen (PON in the fine – PONF – and coarse–PONC–fractions, given in mg/L), dissolved gases (O2 and CO2, μM), pH, alkalinity, isotopic data for river water (δ18O, ‰ SMOW) and carbon species: δ13C (‰, PDB) for dissolved inorganic carbon [DIC] = [HCO3−] + [CO2] + [CO32−], POCF and POCC. The available data collected during contrasting hydrographic stages correspond to depth-integrated, discharge-weighted composite water samples (Richey et al., 1986). According to Quay et al. (1992), and based on replicate analyses (n = 3) of the same sample, the precisions of the measurements (± SD) were: ± 1.5% for fine materials (FPOM, FSS), ± 3.0% for coarse materials (CPOM, CSS), ± 3.0% for dissolved inorganic carbon, and ±0.1 ‰ for δ13C of FPOM, CPOM and DIC. The discharge measurement, exposed thoroughly by Richey et al. (1986), consists in measuring the depth-integrated mean flow velocity of each vertical profile with equal-width increment between verticals and boat positioning based on shipboard observation with a sextant monitoring angles from a three-marker baseline on the shore. Eighteen verticals were prescribed for the Amazon cross-section, but it was mentioned that most of discharge calculations converged to less than 1% of the discharge defined by 18 profiles by about 12–14 verticals. By aggregating all the potential sources of errors (imprecision for width, depth and velocity measurements), Richey et al. (1986) stated that the 95% confidence interval for discharge does not exceed 5% when using the CAMREX procedure. The dataset, extracted from Richey et al. (2008), is indeed exceptional because of the sampling strategy that allows the calculation of accurate mass balances over a very wide spectrum of parameters.
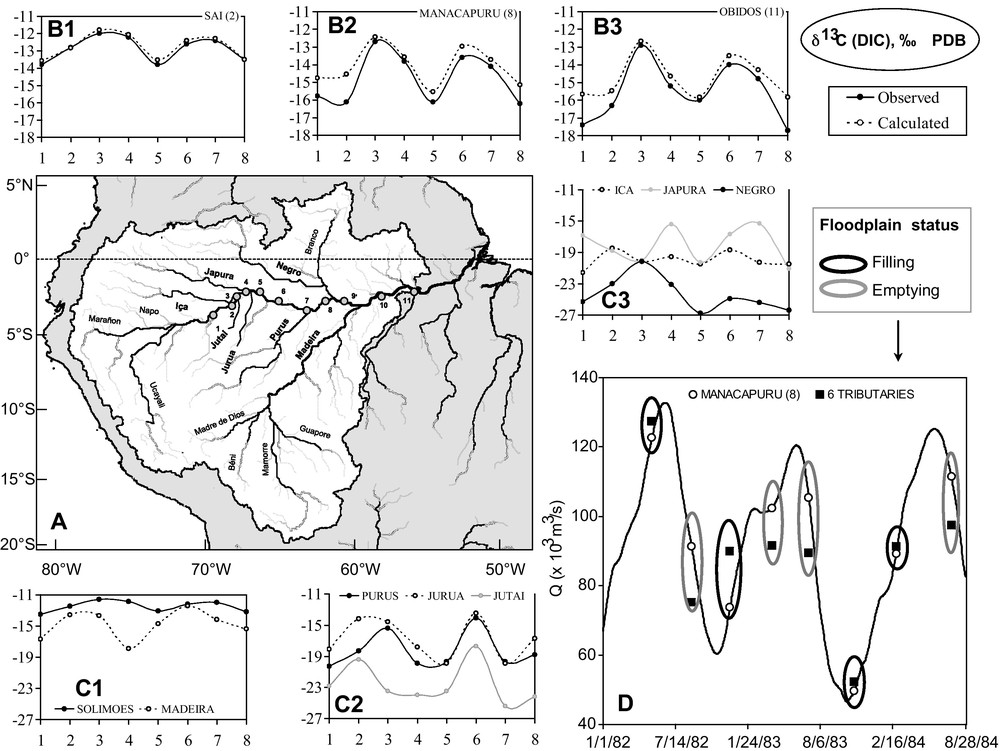
View of (A) the Amazon River basin and the sampling stations location of the main tributaries (bold) and along the Amazon River: (1) Vargem Grande, (2) Santo Antonio do Iça, (3) Xibeco, (4) Tupe, (5) Jutica, (6) Itapeua, (7) Anori, (8) Manacapuru, (9) São Jose da Amatari, (10) Paura, and (11) Óbidos; of the intercruise fluctuations of δ13C (DIC) at three sampling stations (B1 to B3) along the Amazon River (calculated by combining tributaries inputs vs. observed) and at the outlet of the main tributaries (C1 to C3); and of (D) the variations of discharge (observed at Manacapuru vs. the sum of six tributaries located upstream) providing insight on the nature of river-floodplain exchanges (filling vs. emptying).
Vue (A) du bassin de l’Amazone et localisation des stations de contrôle à l’exutoire des principaux affluents (gras) et le long du cours principal de l’Amazone : (1) Vargem Grande, (2) Santo Antonio do Iça, (3) Xibeco, (4) Tupe, (5) Jutica, (6) Itapeua, (7) Anori, (8) Manacapuru, (9) São Jose da Amatari, (10) Paura, et (11) Óbidos ; fluctuations de δ13C (DIC) pour 3 stations (B1 à B3) le long du tronçon fluvial étudié (valeurs calculées en combinant les signaux des affluents vs. valeurs observées) et à l’exutoire des principaux affluents (C1 à C3) ; et (D) fluctuations de débit (observations à Manacapuru vs. 6 affluents amont) donnant une indication sur la nature des échanges entre le cours principal et ses marges (remplissage vs. vidange).
3 Factors driving water composition variability
The water composition variability was shown to be related to (1) the geographic distribution of water sources (Bustillo et al., 2010), (2) to their variable contributions to stream flow (Tardy et al., 2005), (3) to in-stream biogeochemical processes (e.g. Quay et al., 1992), and (4) to the hydrological budget of the floodplains driving sediment dynamics (Meade et al., 1985) and gas emissions towards the atmosphere, more particularly carbon dioxide CO2 (Richey et al., 2002) and methane CH4 (Devol et al., 1988; Melack et al., 2004).
3.1 Regional sources of variability
The variable geographic origin of the river flow is recognized to be a major factor driving the variability (Bustillo et al., 2010) of chemical signals. This is due to the heterogeneous distribution of soils, rocks, relief and vegetation cover on the basin. A very common illustration is provided by black-water and white-water rivers whose chemical properties differ considerably with respect to salinity, sediment load and mineralogical feature (Gibbs, 1967). Actually, the heterogeneous distribution of climate characteristics (rainfall, temperature, relative humidity, potential evapotranspiration, etc.) leads to nonsynchronized flood waves at the scale of the basin (Fig. 2). Usually, the propagation of rain waves is early in the southern part of the basin and delayed in the northern part. The time-lag between northern and southern areas is ca. three months. Consequently, the contribution of southern rivers (Madeira, Purus, and Juruá) arrives earlier than rivers draining northern areas (Negro, Japurá, Iça). Because northern and southern basins drain areas of very distinct characteristics, chemical signals impulsed in each area are very different: low nutrient concentrations, low TDS, low sediment load and high [DOC] for black-water rivers coming from north vs. high nutrient concentrations, high TDS, high sediment load and low [DOC] for white-water rivers coming from south. This generates a chemical dissymmetry between rising and falling water stages of the Amazon River.
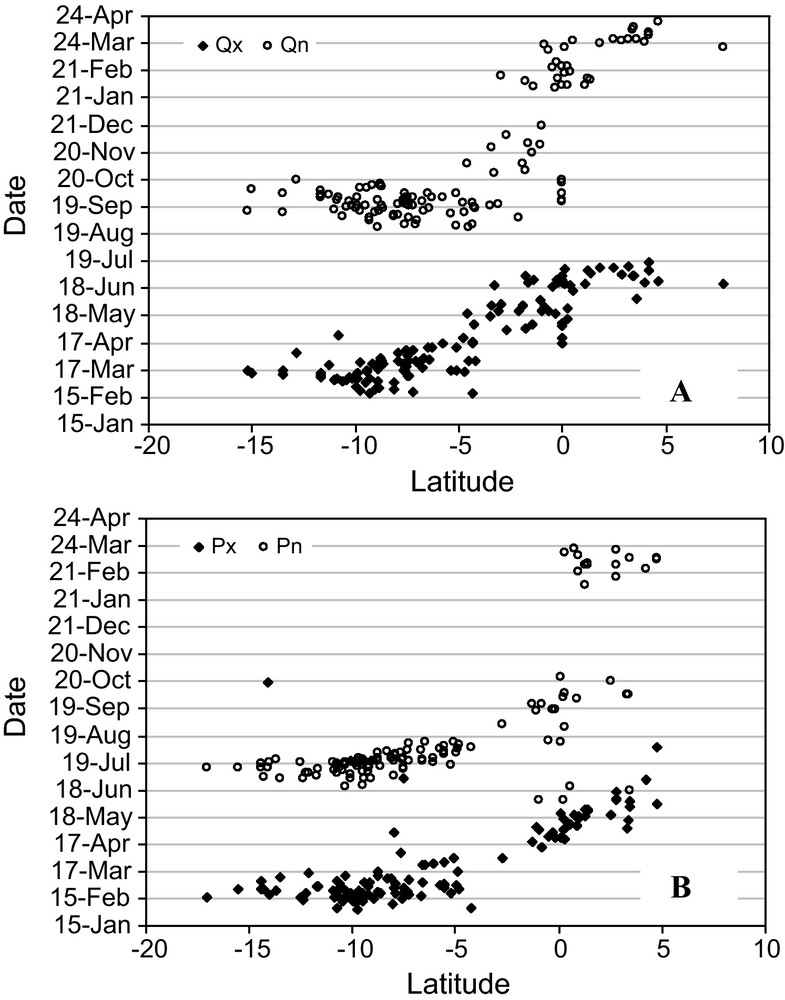
Relationship between the date of occurrence of maximum (x) and minimum (n) daily discharge (Qx and Qn, see A), daily rainfall (Px and Pn, 30 days moving average, see B), and the latitudinal position of the watershed barycentre. Data calculated over the period 1974–2003 (1 averaged data by Julian day and by station) for 200 Amazonian river basins (ANA database, www.hidroweb.ana.gov.br).
Relation entre la date d’occurrence moyenne du débit journalier maximum (x) et minimum (n) : Qx et Qn (A), de la pluviosité journalière (Px et Pn, moyennes mobiles à 30 jours, cf. B), et la latitude du centre de gravité du bassin versant considéré. Données calculées sur la période 1974–2003 (1 valeur moyenne par jour et par bassin) à partir de 200 cours d’eau amazoniens (base de données ANA, www.hidroweb.ana.gov.br).
Using the multiyear time-series chemical data set of Marchantaria (n = 108; period: 1983–1993; Devol et al., 1995) located on the Amazon River, the variability of chemical signals related to the variable contribution of three regional sources (Andes, major tributaries and local source) could be roughly appreciated for 24 parameters. The chemical characteristics of these three regional sources were established by means of multilinear regressions (Table 1). These indicate that a significant part of variability (0 to 50%) is associated with variable contributions of regional inputs. The contribution of the Andes imprints very characteristic chemical signals: sediment-laden waters and high concentrations of sediment-associated species (FPOM, CPOM), high TDS, high pH, high level of dissolved O2, low CO2 content, and high [NO3−]. The tributaries impulse chemical signals exactly opposite to those impulsed by the Andes. Finally, the contribution of local sources leads to intermediate contents, except for SiO2 (high content), phosphorus (dissolved and particulate, low contents) and alkalinity (low value).
Caractéristiques chimiques moyennes des écoulements issus des Andes (Solimões à Vargem Grande), des affluents (Iça, Jutai, Japura, Jurua, Purus) et des apports hydrologiques locaux (calculés par différence entre les sorties et les entrées = Solimões + 5 affluents) à la station de Marchantaria (2 147 000 km2). Valeurs calculées à partir des données de suivi à Marchantaria (Devol et al., 1995).
| 0.45 μm < Size Fraction < 63 μm | Size Fraction > 63 μm | |||||||||||||
| Unit | m3/s | % | mg/L | % weight | μM | molar | mg/L | % weight | μM | molar | ||||
| Variable | Qj | Qj/Qt | FSS | %C | %N | FPOC | FPON | C/N | CSS | %C | %N | CPOC | CPON | C/N |
| Andes | 45252 | 47.0 | 382 | 0.8 | 0.2 | 304 | 39.8 | 5.9 | 13.5 | 2.4 | 0.1 | 58 | 3.1 | 18.9 |
| Tributaries | 39651 | 41.2 | 6 | 1.4 | 0.1 | 52 | −1.2 | 12.9 | 84.9 | −0.5 | 0.0 | 14 | 0.7 | 20.4 |
| Local | 11316 | 11.8 | 54 | 2.2 | 0.3 | 139 | 16.9 | 7.4 | −3.9 | 2.1 | 0.1 | 12 | 0.3 | 19.7 |
| r2 | – | – | 0.41 | 0.46 | 0.48 | 0.17 | 0.23 | 0.16 | 0.11 | 0.10 | 0.12 | 0.18 | 0.26 | 0.00 |
| Unit | – | μM | ‰ PDB | μM | ||||||||||
| Variable | pH | O2 | CO2 | DIC | δ13C (DIC) | Alk | Na+ | K+ | Ca2+ | Cl− | NO−3 | SO42− | HPO42− | SiO2 |
| Andes | 7.7 | 249 | −12 | 841 | −11,1 | 854 | 215 | 26 | 331 | 107 | 28 | 76 | 0.6 | 148 |
| Tributaries | 6.2 | 61 | 332 | 761 | −17,4 | 428 | 60 | 20 | 146 | 15 | −7 | 21 | 1.1 | 142 |
| Local | 6.8 | 142 | 141 | 460 | −16,5 | 319 | 120 | 16 | 74 | 54 | 14 | 27 | 0.5 | 169 |
| r2 | 0.39 | 0.19 | 0.13 | 0.19 | 0,2 | 0.37 | 0.26 | 0.42 | 0.62 | 0.18 | 0.28 | 0.29 | 0.05 | 0.16 |
At the scale of each subbasin, each local area exhibits a variable response-time depending on the soil characteristics (mainly depth and structure), morphology (slope, river network, and distance to the outlet) and climatic hazard. Taking explicitly into account this variability implies to implement a distributed hydrological model, coupled to GIS tools. Preliminary results from Victoria (2010) and Bustillo (2007), relying on the application of the macro-hydrological VIC model (Liang et al., 1994) on the whole Amazon basin, and forced by the climate dataset CRU05 (New et al., 1999), clearly outline the difficulty of the approach, mainly due to the poor precision of rainfall data and soil depth estimations. Thus, it was decided to take each major subbasin as a whole, and to consider primarily their discharge at the outlet, usually available. If not, the discharge may be assessed from satellite-derived water levels (TOPEX altimetry, Zakharova et al., 2006).
3.2 Hydrological sources of variability
The heterogeneities within each subbasin, related to the variable contribution of hydrological sources (runoff components), is a major factor of flux and concentration variability. The rainfall water can take numerous pathways before reaching the streams: overland flow, shallow subsurface flow and groundwater. The conditions encountered by water along flowpaths control biogeochemical processes that determine stream water chemistry. The compositional seasonality of the stream water is intrinsically related to the variable contribution of hydrological sources to the river flow: for example, the flood events (i.e. related to surface quickflow) are responsible for up to 99% of suspended matter annual input to the Berre Lagoon, in France (Gouze et al., 2008). Several methods were attempted to identify end-members and to capture their characteristics. To achieve this purpose, hydrograph separation methods are commonly implemented, including chemical tracers (Mortatti, 1995; Tardy et al., 2005), isotopic tracers (Mortatti et al., 1997), digital recursive filtering (Eckhardt, 2005; Gonzales et al., 2009), spectral analysis (Spongberg, 2000), PCA-based methods (Chaves et al., 2006; Christophersen and Hooper, 1992; Hooper et al., 1990) and distributed hydrological modeling such as VIC 3-L (Victoria, 2010). Therefore, it is possible to determine at each time step the specific discharge of each runoff contributing to river flow. An iterative procedure was proposed by Bustillo (2005) and Bustillo et al. (2011) to determine the most likely solution, as a function of geochemical criteria (minimization of squared errors between observations and simulations, over a wide selection of chemical parameters) and hydrological criteria (adequacy with digital recursive filters). This methodology was successfully applied to the Amazon River and its main tributaries and allowed the identification of three hydrological sources: early direct runoff RS, delayed floodplain emptying RI and baseflow RB. The chemical contrasts between each runoff are unequivocal and for most of the parameters, the seasonal variations of chemical composition in the river water can be interpreted as the result of the mixture in variable proportions of constant composition reservoirs (Tardy et al., 2005; Tardy et al., 2009). In some cases, the fluxes are clearly nonconservative, because of in-stream diagenesis, lateral exchanges or sedimentation vs. remobilization patterns. The gases (CO2, O2), nutrients (NO3−, NH4+, HPO42−), coarse suspended sediments (sand fraction) and coarse particulate organic matter (POCC and PONC) do not exhibit a conservative behavior, and consequently, classical mixing models do not apply reliably (Bustillo et al., 2010). However, the compositional variations are strongly related to the hydrological conditions: river flow, direction of lateral exchanges between the main stream and the floodplains (Bustillo et al., 2010). The floodplain runoff, given by RI, constitutes an adjustment tool accounting for the nonconservativity of fluxes, and therefore, forecasting the seasonal and interannual variability of these nonconservative parameters is unproblematic. For the other considered parameters, at the scale of subbasins, the variable contribution of hydrological sources is the key factor driving compositional fluctuations in the river water (Tardy et al., 2009).
3.3 In-stream transformations: biotic and abiotic processes
The long residence time in the stream network and the supply of unweathered sediments, in aquatic environments with high temperatures (28–30 °C) and oxidative conditions, promote the occurrence of biotic and abiotic processes that might alter substantially the chemical signals imprinted upstream, in soils and headrivers. As the fluxes are not perfectly conservative, end-member mixing models do not apply strictly, more particularly because the floodplains act as a natural fluvial filter of land-to-ocean fluxes (Meybeck & Vörösmarty, 2005). It is the case for major cations (Na+, K+, Ca2+, Mg2+) released by chemical weathering of incompletely weathered sediments deposited in floodplains for instance (Martinelli et al., 1993). Bioactive elements such as NO3−, NH4+, HPO42−, SiO2 but also organic molecules and gases (O2, CO2, CH4, N2O) undergo important transformations along their course in streams: biological uptake (e.g. nutrient enrichment test in Calado lake from Setaro & Melack, 1984) and/or release (e.g. using 18O/16O in dissolved O2 as a tracer of respiration and photosynthesis: Quay et al., 1995), biomass production (Wissmar et al., 1981), sorption/desorption (e.g. mixing zone of the Negro-Solimões confluence: Moreira-Turcq et al., 2003b), outgassing (Devol et al., 1988; Richey et al., 1988), photooxidation (Amon & Benner, 1996), etc. The situation is comparable for sediments and associated POC, definitely discharge-dependent for the coarse fraction CSS and POCC while FSS and POCF dynamics in the lower Amazon are unambiguously driven by longitudinal (floodwave propagation and backwater effect) and lateral hydraulic gradients (Meade et al., 1985).
Because the chemical composition of the Amazon River water cannot directly be inferred from the simple mixture of waters provided by major tributaries, an attempt is thus made to account for those processes arising in the river. Two methods are investigated: (1) description of baseflow composition changes as a function of the hydrobiological regime (Bustillo et al., 2010) and (2) statistical-regressive modelling taking into account the hydrological balance of floodplains. Considering the case of the Amazonian floodplain lake called “Lago de Curuai” located close to Óbidos, it was shown (Bonnet et al., 2008; Maurice-Bourgoin et al., 2007) from in situ and satellite data acquired between 1997 and 2003, that the Amazon River dominated the inputs of water to the flooded area, accounting for about 77% of the annual total input; rainfall and runoff account for about 9 and 10%, respectively, while seepage from the groundwater system accounts for only 4%. It results that, as a first approximation, the water budget of the floodplains can reasonably be assessed from the variations of the river flow. Moreover, when comparing the input by major tributaries with the output recorded at Óbidos, Moreira-Turcq et al. (2003a) found that the amount of organic carbon increased (about 4 Tg C yr−1 i.e. + 12%), suggesting that important sources of autochthonous organic carbon may exist in the lower reaches of the Amazon River. These inputs were attributed to adjacent floodplain lakes, with intermittent supply related to the pattern of river-floodplain water exchanges (Bustillo et al., 2010).
4 Modelling strategy
The modelling strategy consists in assessing the water composition variability related to the temporal contributive variations of regional and runoff sources, then accounting for nonconservative fluxes associated with in-stream transformations and river-floodplain connectivity.
4.1 Hydrograph separation
The reconstitution of hydrograph separation aims to revisit the interpretation given to the fluctuations of the river flow by the calibration of specific hydrological relationships for each reservoir RS, RI and RB. The composition of each individual runoff: RS (direct runoff), RI (delayed floodplain emptying) and RB (baseflow) is assessed by a linear programming method, according to the protocol detailed by Bustillo (2005). It fundamentally consists in optimizing the discharges QRS, QRI and QRB so that (1) the simulated concentrations of 12 representative parameters, obtained by multilinear regression, minimize the mean relative squared error between modelled and observed data and that (2) QRS (t) + QRI (t) + QRB (t) = Qt (t). The reference values ascribed to QRS, QRI and QRB are those obtained by multilinear regression, with optimised sets of QRS (j,t), QRI (j,t) and QRB (j,t) for each station (index j). Several methods are tested to reconstitute QRS (j,t), QRI (j,t) and QRB (j,t) as a function of the only available parameter measured continuously, namely the river discharge Qt (j,t), estimated by means of frequently calibrated stage-discharge relationships.
4.1.1 Linking Qk (j,t) and Qt (j,t + n)
The simplest way to achieve this purpose is to adjust linear regressions between Qk (j,t) (k = RS, RI and RB) and Qt (j,t), using the optimized set of Qk (j,t):
Qk (j,t) = A(j) × Qt (j,t) + B(j) (1)
Then, we calibrate similar equations by taking into account a phase shift (n months, with–3 ≤ n ≤ + 3):
Qk (j,t) = A (j,n) × Qt (j,t + n) + B (j,n) (2)
Next, linear combinations including Qt (j,t + n-1), Qt (j,t + n) and Qt (j,t + n + 1) are tested:
Qk (t) = A (j,n − 1) × Qt (j,t + n − 1) + A (j,n) × Qt (j,t + n) + A (j,n + 1) × Qt (j,t + n + 1) + B (j,n) (3)
with–2 ≤ n ≤ + 2. The best adjustments are obtained for n = 2 in the case of the surface runoff RS, n = − 2 for the delayed floodplain emptying RI and n = 0 for the baseflow RB, indicating that (1) the peak of RS precedes of around 2 months the peak of river flow, (2) RI is delayed by 2 months with regard to the river flow while (3) RB exhibits its peak concomitantly with the total discharge. These lag-times (−2 for RS; 2 for RI; 0 for RB) are selected for linear combinations.
4.1.2 Digital filtering methods
This approach consists in performing auto-recursive hydrograph filtering, following the procedure proposed by Bustillo (2005), and adapted from Eckhardt's baseflow index (2005):
QRB (j,t) = KRB (j) × Qt (j,t) + [1− α RB (j)] × QRB (j,t−1) (4)
QRI (j,t) = KRI (j) × [Qt (j,t)–QRB (j,t)] + [1−α RI (j)] × QRI (j,t − 1) (5)
QRS (j,t) = Qt (j,t)–QRB (j,t)–QRI (j,t) (6)
where KRI (j) and KRB (j) are the recharge coefficients for RI and RB respectively at the jth station, α RI (j) and α RB (j) are the emptying coefficients for RI and RB respectively, while [1 − α RI (j)] and [1 − α RB (j)] designate their respective recession coefficients (method called F1). An alternative approach, called F2, consists in adjusting directly QRS (j,t) instead of QRI (j,t):
QRB (j,t) = KRB (j) × Qt (j,t) + [1 − α RB (j)] × QRB (j,t − 1) (7)
QRS (j,t) = KRS × [Qt (j,t)–Qt (j,t − 1)–QRB (j,t) + QRB (j,t − 1)] + [1 − α RS (j)] × QRS (j,t − 1) (8)
QRI (j,t) = Qt (j,t)–QRB (j,t)–QRS (j,t) (9)
This procedure leads to the reallocation of the river flow rise (after subtracting the part coming from RB) to the early surface runoff. Yet, the modelling of falling water appears inappropriate because it tends to exacerbate its emptying rate. That is why we propose a third digital filtering method (called F3): it consists, for rising water, to adjust QRS (j,t) and to estimate QRI (j,t) by difference and conversely, for falling water, to adjust QRI (j,t) and to estimate QRS (j,t) by difference.
4.2 Integrating the inputs from upstream tributaries
At the confluence of large rivers, for which the draining areas contributing to the total discharge are submitted to phase-shifted hydroclimatic regimes, the procedures which consist in reconstituting the components of river flow by analysing only the total river flow tends to fail. Considering the 11 sampling stations located along the Amazon main stream, the composition of the river water at the station x and at time t, noted Cix(t), was estimated by integrating inputs from the major tributaries:
| (10) |
4.3 In-stream transformations
To assess the relative importance of autotrophy vs. heterotrophy on the water chemistry, the hydrobiological index IBIO = [O2]–[CO2] was defined (Bustillo et al., 2010). This synthetic index, corresponding to the difference between dissolved gas composition of O2 and CO2 in the water, enabled to assess the metabolic balance between autotrophy and heterotrophy in the fluvial system: IBIO > 0 indicates that photosynthetical patterns predominate and conversely, IBIO < 0 indicates that heterotrophy is the dominant hydrobiological pattern. Biologically-mediated processes were recognized to modify more specifically the composition of the baseflow. We assumed that the chemical composition of the baseflow RB fluctuated in accordance with IBIO so that:
[C]RB (j;t) = [Co]RB (j) + KBIO (j) × IBIO (j;t) (11)
where [Co]RB is the concentration in the baseflow before transiting in the lower fluvial reaches. KBIO ≈ 0 for chemical species exhibiting a nearly conservative behaviour such as Na+, Cl−, etc… and KBIO ≠ 0 for bioactive elements such as NO3−, CO2, etc. Therefore, it is necessary to evaluate IBIO (j;t) variations to improve the chemical characterization of RB and subsequently the assessment of and biogeochemical budgets. The evaluation of IBIO (j;t) requires the concomitant evaluation of [CO2] and [O2]. In most of the cases, the dissolved gas composition of river water depends on the water turbidity (appreciated by FSS), on the river flow (Qt) and on the discharge of the floodplains, tracked by ΔQt/Qt = (Qt(t+1)–Qt(t-1))/Qt(t) involving the discharge of the month Qt(t) and those of the next month Qt(t+1) and last month Qt(t-1). Actually, the water turbidity controls the yield of aquatic photosynthesis: sediment-laden waters promote IBIO < 0. Moreover, the river flow determines the extension of flooded areas where the organic matter decay is promoted. If the river flow is low, the residence time of water in streams tends to lengthen while organic substrate is almost nil so that photosynthesis prevails: IBIO > 0. Finally, the intermittent filling/emptying of the floodplains (appreciated by ΔQt/Qt), where heterotrophic regime prevails, tends to modify the dissolved gas composition of streams, by releasing CO2 and removing O2. Because of the well-known interrelations of these factors, we chose to calibrate the following equations:
| (12) |
| (13) |
4.4 Correction related to river-floodplain connectivity
This correction applies to the chemical composition of the Amazon River main reach. Due to the impossibility of determining the default of hydrological and chemical budget within the major tributaries (where there is only one monitoring station at the outlet), the procedure exposed here cannot be applied to them. The variation of chemical composition, noted ΔCijk, between theoretical (calc) and observed (obs) values is related to two factors: the river flow at the xth sampling station: Qt (xk), and the default of water balance in the floodplains WBFxk.
| (14) |
| (15) |
| (16) |

Mean simulated variations of (A) [Na+], (B) [DOC], (C) [FSS], and (D) [O2] as a function of the river outflow (Qt, mm.yr−1: x-axis) and the floodplain water balance WBF: y-axis. The fluctuations simulated over an annual cycle, at the station of Óbidos, by means of the statistical-regressive model, and accounting for river-floodplain connectivity, are represented by arrows, setting in evidence: (A) [Na+] concentration pattern associated with low water stage (path 1); (B) [DOC] concentration associated with falling water (path 4→1) and low water stage (path 1); (C) remobilization of silt-clay sediments (FSS) linked to floodplain emptying and high river flow (path 3→4); (D) [O2] depletion related to rising water stage (path 2) and high river flows (path 3). The hydrological sequence is: (1) lowest water with WBF = 0 → (2) rising water, with outflow < inflow (WBF < 0) → (3) highest water, with WBF = 0 → (4) falling water, with WBF > 0 (floodplain emptying) → (1) lowest water.
Variations moyennes simulées de (A) [Na+], (B) [DOC], (C) [FSS], et (D) [O2] en fonction du débit (Qt, mm.yr−1 : abscisse) et du bilan hydrologique des plaines d’inondation WBF : ordonnée. Les fluctuations simulées au cours d’un cycle annuel moyen, à la station d’Óbidos, par ajustement d’un modèle statistique rendant compte de la connectivité entre le fleuve et ses marges, sont représentées par des flèches qui mettent en évidence : (A) un effet de concentration de [Na+] associé aux étiages (path 1) ; (B) un effet de concentration de [DOC] pendant la décrue (path 4→1) et l’étiage (path 1) ; (C) remobilisation de sédiments fins (FSS) associée à la vidange des plaines d’inondation et aux forts débits (path 3→4) ; (D) diminution des teneurs en O2 dissous pendant la montée des eaux (path 2) et le pic de crue (path 3). La séquence hydrologique est : (1) étiage avec WBF = 0 → (2) montée des eaux avec débit de sortie < débit d’entrée (WBF < 0) → (3) pic de crue, avec WBF = 0 → (4) décrue avec WBF > 0 (vidange des réserves alluviales) → (1) étiage.
The default of water balance WBF implicitly takes into account lateral exchanges between floodplains and alluvial aquifers, on the one side, and the river main channel on the other side. It is particularly the case for POCC and CSS which are sequentially released to the river when floodplains dry up (Bustillo et al., 2010), i.e. when WBFx,k > 0.
4.5 Contribution to the water composition variability
For each parameter, four sources of variability were identified: (1) geographic source contribution, (2) hydrological pathway, (3) in-stream biogeochemical processes and (4) hydrological budget of the floodplains. Here, their respective contribution to the total variability of chemical signals in the Amazon River water is assessed. First, we have simulated the theoretical composition of the Amazon River at Manacapurú, São Jose da Amatari, Paurá and Óbidos assuming that the variable geographic source contribution is the only source of variation, called interbasin variability. Hence, as a first approximation, the chemical variability within subbasins, called intrabasin variability, is neglected. We suppose that the chemical composition of tributaries is constant and that the chemical variability in the Amazon River depends on the variable contribution of these tributaries to the Amazon flow. Simulated concentrations are compared to observed ones. The Explained Variance coefficient (EVC) (e.g. Franchini et al., 1996) was calculated to evaluate the goodness of fit and to assess the contribution of each source of variations on the compositional chemical variability in the Amazon River:
| (17) |
Step 1. The compositional variations associated to the interbasin variability (noted ) are simulated by discharge-weighting of the contributions of the n main tributaries located upstream from the sampling station, considering that their individual concentrations are temporally constant:
| (18) |
Step 2. The compositional variations associated with the intrabasin variability (noted ) are simulated by discharge-weighting the contributions of the n main tributaries located upstream from the sampling station, considering that their individual concentrations are temporally variable:
| (19) |
Step 3. The variability explained by in-stream biogeochemical processes is defined here as the gain of the Explained Variance Coefficient associated with the incorporation of IBIO x,k = [O2]x,k–[CO2]x,k as a covariate:
| (20) |
Step 4. Finally, the variability explained by the water budget of the Amazonian hydrosystem (floodplains and main reach) is defined in this study as the gain of EVC associated to the incorporation of two hydrological descriptors, namely WBF and Qt, to describe the compositional variations of the chemical parameter i at the sampling station x at time t:
| (21) |
It must be kept in mind that the calculations are based on observed concentrations and discharges in the tributaries and not by the outputs of mixing models. As a result, the so-called intrabasin variability (step 2) constitutes an upper limit of that which would be obtained on the basis of hydrograph separation methods. Likewise, IBIO (step 3) is calculated from observed [O2] and [CO2] in the main stream, meaning that the variability attributed to in-stream biogeochemical processes is an upper limit of that which would be obtained on the basis of estimated IBIO.
5 Results and discussion
5.1 Compared performances of hydrograph separation procedures
The comparison of the methods relies on their individual fitting capability to estimate QRS (j,t), QRI (j,t) and QRB (j,t) obtained by the reference hydrograph separation. The correlation coefficients R2 of each procedure are presented (Table 2). The indices n (–3 ≤ n ≤ + 3) correspond to the time-lag (n given in months) between Qt and Qk used to perform the linear calibration. The values which are underlined stand for maximum R2 for this kind of procedure. It is remarkable that maximum R2 is obtained for n = 2 in the case of RS, n = 2 in the case of RI and n = 0 in the case of RB. The largest phase shifts are obtained on climate contrasted basins such as Purus, Jurua and Madeira river basins. The results obtained by linear combination of Qt (t + n) deliver most of the time very good correlation coefficients (see column entitled LC). Auto-recursive methods are also quite efficient, and more particularly the mixed approach F3 consisting in adjusting (i) RI and RB during falling water, and (ii) RS and RB during rising water. The goodness of fits provides, a posteriori, a validation of end-member mixing models whose outcomes appear consistent from an hydrological point of view, except for the Japura, Iça and Negro Rivers for which RB and RS are poorly explained.
Comparaison des coefficients de corrélation (R2) entre QRS, QRI, QRB, et Qt, obtenus selon différentes procédures de calcul, aux exutoires des huit principaux affluents de l’Amazone : Solimões à Vargem Grande (VGr), Iça, Jutai (Jut), Japura (Jap), Purus (Pur), Negro (Neg), et Madeira (Mad).
| Time lags (n, expressed in month) | Filtering methods | ||||||||||
| QRS | −3 | −2 | −1 | 0 | 1 | 2 | 3 | (LC) | F1 | F2 | F3 |
| VGr | 0.11 | 0.02 | 0.03 | 0.35 | 0.59 | 0.64 | 0.38 | 0.63 | 0.50 | 0.35 | 0.57 |
| Iça | 0.00 | 0.01 | 0.02 | 0.03 | 0.52 | 0.27 | 0.54 | 0.53 | 0.58 | 0.54 | 0.65 |
| Jut | 0.06 | 0.01 | 0.09 | 0.28 | 0.57 | 0.44 | 0.07 | 0.48 | 0.57 | 0.43 | 0.50 |
| Jur | 0.27 | 0.17 | 0.00 | 0.23 | 0.21 | 0.50 | 0.45 | 0.56 | 0.21 | 0.77 | 0.94 |
| Jap | 0.01 | 0.01 | 0.14 | 0.50 | 0.01 | 0.04 | 0.01 | 0.20 | 0.18 | 0.03 | 0.29 |
| Pur | 0.38 | 0.04 | 0.01 | 0.10 | 0.67 | 0.69 | 0.50 | 0.73 | 0.61 | 0.74 | 0.69 |
| Neg | 0.01 | 0.17 | 0.49 | 0.93 | 0.68 | 0.16 | 0.05 | 0.95 | 0.75 | 0.63 | 0.74 |
| Mad | 0.34 | 0.04 | 0.08 | 0.67 | 0.77 | 0.74 | 0.35 | 0.89 | 0.71 | 0.83 | 0.86 |
| QRI | −3 | −2 | −1 | 0 | 1 | 2 | 3 | (LC) | F1 | F2 | F3 |
| VGr | 0.14 | 0.08 | 0.14 | 0.17 | 0.00 | 0.14 | 0.34 | 0.47 | 0.26 | 0.19 | 0.36 |
| Iça | 0.01 | 0.00 | 0.30 | 0.16 | 0.07 | 0.01 | 0.00 | 0.52 | 0.55 | 0.01 | 0.02 |
| Jut | 0.22 | 0.37 | 0.72 | 0.80 | 0.23 | 0.01 | 0.17 | 0.71 | 0.79 | 0.33 | 0.57 |
| Jur | 0.11 | 0.35 | 0.90 | 0.71 | 0.36 | 0.02 | 0.15 | 0.94 | 0.90 | 0.74 | 0.67 |
| Jap | 0.00 | 0.24 | 0.67 | 0.81 | 0.30 | 0.01 | 0.00 | 0.84 | 0.88 | 0.13 | 0.62 |
| Pur | 0.59 | 0.81 | 0.78 | 0.71 | 0.05 | 0.08 | 0.34 | 0.81 | 0.85 | 0.91 | 0.85 |
| Neg | 0.01 | 0.06 | 0.27 | 0.70 | 0.53 | 0.19 | 0.07 | 0.35 | 0.37 | 0.05 | 0.26 |
| Mad | 0.15 | 0.57 | 0.90 | 0.65 | 0.30 | 0.00 | 0.14 | 0.90 | 0.92 | 0.91 | 0.91 |
| QRB | −3 | −2 | −1 | 0 | 1 | 2 | 3 | (LC) | F1 | F2 | F3 |
| VGr | 0.00 | 0.04 | 0.26 | 0.35 | 0.29 | 0.28 | 0.08 | 0.54 | 0.14 | 0.14 | 0.14 |
| Iça | 0.00 | 0.22 | 0.03 | 0.21 | 0.02 | 0.02 | 0.00 | 0.08 | 0.43 | 0.43 | 0.43 |
| Jut | 0.27 | 0.32 | 0.35 | 0.65 | 0.01 | 0.05 | 0.29 | 0.42 | 0.42 | 0.42 | 0.42 |
| Jur | 0.02 | 0.06 | 0.19 | 0.35 | 0.01 | 0.00 | 0.00 | 0.32 | 0.07 | 0.07 | 0.07 |
| Jap | 0.11 | 0.02 | 0.01 | 0.03 | 0.04 | 0.07 | 0.02 | 0.05 | 0.02 | 0.02 | 0.02 |
| Pur | 0.09 | 0.35 | 0.47 | 0.50 | 0.15 | 0.00 | 0.04 | 0.48 | 0.48 | 0.48 | 0.48 |
| Neg | 0.01 | 0.02 | 0.26 | 0.30 | 0.18 | 0.05 | 0.06 | 0.52 | 0.23 | 0.23 | 0.23 |
| Mad | 0.13 | 0.01 | 0.28 | 0.67 | 0.71 | 0.44 | 0.10 | 0.76 | 0.11 | 0.11 | 0.11 |
5.2 Comments on chemical tracing
The variations of the stream waters chemical composition along a hydrological cycle is sometimes modelled as a dilution of some source water (baseflow) by varying volume of some other water type (quickflow). This approach relying on the mixing of two hydrological sources is sometimes efficient for small rivers, but it appears rarely valid for large rivers (Mortatti, 1995). The methodology applied by Tardy et al. (2005) enables to identify three hydrological sources. It relies on the use of chemical tracers, chosen to be fine suspended sediments (FSS) and Na+. These two parameters were supposed to exhibit a nearly conservative behavior in the streams. Actually, this assumption is not completely valid for FSS which undergo deposition and remobilization patterns. In the case of black-water rivers, most of FSS undergoes sedimentation so that surface runoff signal is strongly altered. It is probably more appropriate to choose DOC as tracer instead of FSS because quickflow (surface runoff and subsurface flow) are highly enriched in DOC compared to the slower and deeper flowpaths that contribute to baseflow. This justifies to estimate QRS (j,t), QRI (j,t) and QRB (j,t) by means of linear programming methods implying more than two tracers (e.g. Bustillo, 2005), or by means of PCA-based methods (e.g. Hooper et al., 1990) in order to minimize the impact of analytic errors and to improve the robustness of the assessments.
It should also be kept in mind that large river basins are spatially organized. Consequently, whatever the actual flowpath contributions to river flow, the variable regional contribution promotes important compositional fluctuations. As a matter of fact, the chemical tracing does not provide rigorously a picture of the soil vertical organization for the large river basins spatially organized (i.e. with mountains, piedmonts, low plains). Instead, it delivers an insight on the basin regional organization: (1) RS tracks the contribution of upstream areas, providing sediment-laden water; (2) RB tracks the contribution of subterranean water characterized by high TDS (where chemical weathering is the most active) and low sediment load; (3) RI, whose expression is delayed in time, tracks the contribution of saturated areas (fluvial corridors, floodplains), mainly located downstream, and usually provides low sediment load and low TDS.
RI is thus assimilated to a storage reservoir bordering the river network, fed concomitantly by RS and RB during rising water, and releasing water when local hydraulic conditions are favorable, i.e. mainly during falling water while adjacent water reserves are still high as river water level decreases.
5.3 Autotrophy vs. heterotrophy
Fig. 3 synthetizes the parameters of multilinear equations relating CO2 and O2 to the most significant physical drivers of river ecology: the water turbidity (approached by FSS), the river flow (Qt) and the contribution of the floodplains (tracked by ΔQt/Qt) to the streamflow. This analysis indicates that [CO2] is very low when the river flow is low to moderate and when waters are free of turbidity (FSS = 0); conversely, under these conditions, [O2] is high, indicating that aquatic photosynthesis prevails. Since the rise of turbidity indicates increasing contribution of surface runoff to the river flow, and seeing that this surface runoff drains upper layers of soils which constitute oxygenated environments, it can be concluded that the influence of turbidity is not univocal. That is the reason why, in some cases, the decrease of water transparency is more than compensated by the input of quickflow RS, close to air saturation (α2 > 0 for Rios Iça, Jutaí, Jurua, Japura, Madeira) and in other cases, not compensated (α2 < 0) due plausibly to high oxygen demand from transported carbon: high DOC for the Negro and the Solimões Rivers, high POCF for Solimões and Purus Rivers. The influence of turbidity on O2 contents is not significant for the sampling stations located along the Amazon River studied reach (−0.5 < α2 < 0.1).

Parameters of multilinear equations relating CO2 and O2 to the most significant physical drivers of the river ecology: the river-floodplain connectivity (tracked by ΔQt/Qt, see A), the river flow (Qt, see B), and the water turbidity (approached by FSS, see 3 C). Correlation coefficients R2 were established (3D) for CO2 and O2 (1) at the outlet of the major river basins: Iça, Jutai (Jut), Jurua (Jur), Japura (Jap), Purus (Pur), Negro (Neg), and Madeira (Mad), and (2) along the Amazon River main stream: Vargem Grande (VG), Santo Antonio do Iça (SAI), Itapeua (Ita), Manacapuru (Man), and Óbidos (Obi).
Paramètres de la régression linéaire multiple reliant les teneurs dissoutes en CO2 et O2 aux principaux facteurs de contrôle de l’écologie aquatique : la connectivité entre le cours principal et ses marges (suivi par ΔQt/Qt, voir A), le débit (Qt, voir B) et la turbidité (approximée par la charge solide fine FSS, voir C). Les coefficients de corrélation R2 (3D) des ajustements multilinéaires ont été établis pour CO2 et O2 (1) à l’exutoire des principaux affluents : Iça, Jutai (Jut), Jurua (Jur), Japura (Jap), Purus (Pur), Negro (Neg), et Madeira (Mad), et (2) le long du cours principal Amazonien : Vargem Grande (VG), Santo Antonio do Iça (SAI), Itapeua (Ita), Manacapuru (Man), et Óbidos (Obi).
The relationships between the dissolved gas composition of water and the discharge appear much easier to decipher. [CO2] increases (β1 > 0) with the river flow (Qt) while [O2] decreases (β2 < 0), indicating that the yield of aquatic photosynthesis drops when the discharge rises. Moreover, we notice that dissolved gas composition of river water is closely linked to the rate of variation of discharge. For a given discharge, [CO2] is higher during falling water (γ1 < 0) than during rising water. Conversely, [O2] is higher during rising water (γ1 > 0). Actually, the discharge of the floodplains and wetlands which border rivers drain water enriched in CO2 and depleted in O2 because organic carbon is specifically and intensively mineralized in stream corridors (Mayorga et al., 2005), which mainly feed river flow during falling water (Richey et al., 1989; Alsdorf et al., 2010).
5.4 River-floodplain connectivity
The results are discussed in light of synthetic 2-D diagrams (Fig. 4). These diagrams provide a qualitative insight on river diagenesis as a function of the discharge time-series and the default of discharge balance WBF. Four parameters were selected for illustrative purpose: Na+, DOC, FSS and O2. Based on a calibrated set of parameters (αix, βix, γix and δix), the mean annual fluctuations at the station of Óbidos were represented. These diagrams show that seasonal concentration patterns of these parameters are not only influenced by the river flow (x-axis) but also by the contribution of the floodplain to the river flow. DOC and O2 exhibit comparable patterns marked by increasing concentration (for a same discharge value) for a floodplain emptying pattern. This suggests that floodplains are sources of DOC and O2 for the fluvial system. However, most of the variability is associated with dilution patterns for rising discharges. It is more contrasted for Na+ whose surface response might secondarily be influenced by the timing of early alluvial groundwater inputs. Conversely, the fluctuations of silt-clay suspended sediments (FSS) appear to be equally influenced by the discharge and by the water balance of the floodplains. FSS exhibit an unexpected hysteretic C-Q shape marked by higher concentrations during floodplain emptying, due to the flushing effect of the Negro River (Dunne et al., 1998) whose flow peak is delayed with respect to those of the other tributaries.
5.5 Contribution to variability of the four factors
Fig. 5 presents the values of the Explained Variance coefficient (EVC) calculated at four stations (sorted from upstream to downstream) located on the Amazon River main stream: Manacapurú, São Jose da Amatari, Paurá and Óbidos. The values obtained for EVC and presented in Fig. 5 are cumulative. For each couple [station; parameter], four EVC values are established, corresponding to the successive incorporation of tested factors in the modelling process. EVC commonly exhibit values > 75%.

Explained Variance Coefficient (EVC) calculated for 33 chemical parameters (including S+ and S− = sum of cations and anions) at four sampling stations (Manacapuru, São Jose da Amatari, Paura and Óbidos) and related to four sources of variations: (1) interbasin variability, related to the geographic origin of contributing runoffs, (2) intrabasin variability related to the nature of contributing runoff components, (3) that related to-stream diagenesis (+ IBIO), and (4) that associated with the water budget of the floodplains (+ water budget). Data represented correspond to the accumulated explained variance: inter, then inter + intra, and finally inter + intra + I BIO or inter + intra + water budget.
Coefficient de variance expliquée (EVC) calculé pour 33 paramètres physicochimiques (incluant S+ et S− = somme des cations et des anions) au niveau de quatre stations de contrôle (Manacapuru, São Jose da Amatari, Paura and Óbidos) et associé à quatre sources de variabilité : (1) interbassin, associée à l’origine géographique des écoulements contributifs, (2) intrabassin, liée à la nature des composantes d’écoulements contributives, (3) celle liée à des processus biotiques diagénétiques (+ IBIO), et enfin (4) celle associée au bilan hydrologique des plaines d’inondation (+ water budget). Les données représentées correspondent à la variance expliquée cumulée : inter, puis inter + intra, et enfin inter + intra + I BIO ou inter + intra + water budget.
EVC related to variable geographic source contribution is most of the time < 40%. Conversely, it is worth noting that variable geographic source contribution explains more than 80% of the total variability for Ca2+ and HCO3−, and more than 50% of Mg2+ and Cl−. The interbasin variability of these parameters is much greater than the intrabasin variability (mainly related to hydrological source) and moreover, these chemical species exhibit a nearly conservative behavior in the river. Complementarily, it should be mentioned that most parameters exhibit high determination coefficient and low Nash-Sutcliffe coefficients (data not shown). It is typically the case for δ13C (DIC), CO2, O2, pH, NO3− for example. Here, the variable geographic source impulses a chemical signal which tends to be amplified by hydrological source and in-stream diagenesis (Bustillo et al., 2010), because the biogeochemical processes arising downstream are prolonging those operating upstream from the confluence with the Amazon River main stream.
The variability related to hydrological pathways, called intrabasin variability, is appreciated by comparing the simulated (tributaries-derived) and observed composition of the Amazon River water. Its contribution to the overall variability of concentrations is very significant. In some cases, the simulated data variance is larger than the observed one, indicating that the chemical signals imprinted upstream tend to be buffered downstream. It is the case for Ca2+, HCO3−, SO42−, DOC, DIC, FSS, CSS, POCF, POCC, δ13C (POCC), PONF and PONC.
Then, incorporating the influence of in-stream biogeochemical processes enables to improve the amount of explained variability with respect to chemical signals in the Amazon River water. Most of EVC are greater than 90%, except for SO42−, CSS, POCC, δ13C (POCC), PONC and POCC/PONC. Actually, the model of in-stream diagenesis integrates interbasin and intrabasin variability, in addition to the variability impulsed by in-stream processes. As expected, the part of variance explained by the models typically rises as we add a new factor. It is therefore possible to identify successively the variation due to each factor. For example, taking the case of Na+ at Manacapurú, Fig. 5 indicates that 4% of the variability is due to interbasin variability, 69% (0.69 = 0.73–0.04) is related to intrabasin variability and 23% (0.96–0.73) to fluvial processes. In peculiar and limited cases, (inter + intrabasin) variability is lower than the interbasin one (e.g. Ca2+ at Paurá), probably due to interaction effects that jumble out the chemical signals imprinted by geographic source variability. Among the two river factors influencing chemical signals of the Amazon River, namely hydrobiological processes and floodplain water balance, the latter is clearly the most impacting. It might be due to the fact that the seasonally-structured hydrological response of the floodplains impulses to a large extent [CO2] and [O2] variations in the main channel; since the water coming from the floodplains is typically depleted in O2 and concentrated in CO2; the water balance of the floodplains implicitly determines the imprint of hydrobiological processes arising there. Hence, the variability ascribed to the water balance of the floodplains integrates also a part of variability related to hydrobiological processes. The case of Na+ deserves to be discussed more thoroughly. Indeed, half of the increase observed on EVC (compared to inter + intra variability), ascribed to river processes, is related to IBIO while the release vs. sequestration of Na+ is recognized to be fundamentally an abiotic process. This gain observed on EVC unduly attributed to IBIO is actually due to the fact that the water budget of the floodplains (WBF) influences simultaneously IBIO and [Na+]. Consequently, the increase of explained variability related to the addition of IBIO as a potential source of variation should not be interpreted in terms of causality relationships between IBIO and [Na+]. The actual driving factor is the WBF, as shown by Bustillo et al. (2010): the floodplains are sites where the chemical alteration of the unweathered deposited sediments is very active, so rising contribution of floodplains to the overall water budget of the Amazon River promotes thus increasing [Na+] in the main channel.
The contribution to the total variance of (1) geographic source variation (interbasin), (2) hydrological source variation (intrabasin) and (3) river processes, differs considerably from a parameter to another. For Ca2+ and HCO3−, most of the variance is related to geographic source (60% to 93%); while the hydrologic source and the river processes have little impact on these parameters. Although less marked, comparable trends are observed for DOC, Mg2+, FSS, POCF, PONF and O2. The case of δ18O deserves to be mentioned because most of the variance is attributed to a single factor, i.e. hydrological source (> 97%), indicating that interbasin variability and river diagenesis do not impact significantly δ18O signals in the Amazon River water. River processes seem to have a higher impact (10–30% of total variance) on [Na+], [Cl−], pH, [NO3−], [HPO42−], [CO2], POCF/PONF, DOC/DON, DON, δ13C (DIC), δ13C (POCF), δ13C (POCC), CSS and POCC. In turn, for CSS and POCC for example, the combination of these three sources of variations does not explain the variability of the chemical signals, attributed to that of the river surface slope (e.g. on the Madeira River, main provider of suspended sediments: Martinelli et al., 1988; on the Solimões River at Marchantaria: Devol et al., 1995) which might vary considerably due to the concomitance of large stage variations (up to 10 m) and very shallow thalweg slope (2–4 cm/km) that promote backwater effects (Meade et al., 1991).
6 Conclusion
This paper presented a statistical-regressive modelling attempt of the hydro-bio-geochemical functioning of the Amazon basin. Its objective was to simulate and later predict the biogeochemical budget of the river, and its relation with climate changes and anthropogenic actions. Although applied to a site (the Amazon basin), the objective consisted in implementing a new method in view to simulate the geochemical fluxes and to explain the origin of their variability.
The methodological framework proposed in this paper might perhaps look somewhat crude. However, simple statistical-regressive relationships were shown to be able to capture most of the variability of chemical signals observed in the Amazon River. These are: (1) the geographic distribution of water sources and (2) their variable contributions to stream flow, (3) the in-stream biogeochemical processes, and (4) the hydrological budget of the floodplains. Combining these four factors is therefore highly recommended in order to simulate accurately the variability of the chemical signals in the water of the Amazon River.
The river processes occurring in the stream network of the tributaries are implicitly simulated by means of the hydrobiological index IBIO = [O2]–[CO2]. The factors driving the variability of [O2] and [CO2] could be determined: these are the water turbidity, the streamflow and the contribution of floodplains to the streamflow. It should be underscored that the chemical signals observed in the downstream reach prolong and sometimes accentuate those imprinted upstream, forming a continuum of similar processes arising almost simultaneously.
The hydrological budget of the floodplains, tracked by the relative difference between lagged inflow and instantaneous outflow (WBF), enables to capture between 0 and 50% of the compositional variability (mean: 25%) and as such, it provides much better results than those from hydrobiological indices (see Fig. 5). Therefore, this parameter can be a substitute to the hydrobiological index, provided that it is routinely estimated for the tributaries by means of robust routing procedures (e.g. Hayami Kernel function: Naden et al., 1999; lag and route with floodplain module: Vörösmarty et al., 1989). The measurements of water storage, using gravimetric and imaging satellite methods (e.g. GRACE, JERS-1) open appealing perspectives to tackle the question of floodplain hydrological balance (Alsdorf et al., 2010) and its monitoring.
Finally, by combining only river discharge and river-floodplain water balance, and provided that semi-automatic hydrograph separation methods are implemented to ascertain boundary conditions upstream from the studied reach, 20 to 99% (mean: 85%) of the compositional variability of the Amazon River can be captured. As such, this work opens the way to nondeterministic modelling approaches (e.g. artificial neural network), using at least (1) the runoff components (QRS, QRI, QRB), (2) the discharge of the floodplains (WBF), and ideally (3) the hydrobiological index (IBIO) as inputs to assess the concentration of the Amazon River and its tributaries, the latter defining upstream boundaries. These outputs might then be interpreted by means of a process-based model, constrained by chemical, sedimentary and isotopic balances, as proposed by Bustillo et al. (2011). The implementation of more mechanistic approaches to simulate river-floodplain exchanges for the Amazon River and also for its tributaries, in complement to frequently updated outputs from non-deterministic models, might constitute a reasonable way (1) to relocate upstream boundaries beyond the confluences of the main tributaries with the Amazon main channel, and (2) to assess the long-term trends and variations of biogeochemical fluxes, potentially impacted by land-use and climate changes.
Acknowledgements
Financial support for Vincent Bustillo was provided by the Fundação de Amparo a Pesquisas do Estado de São Paulo (FAPESP) by way of the post-doctoral fellowship no. 2005/58884-5 associated to the project entitled “A large-scale synthetic model applied to the Hydroclimatology and Eco-Geodynamics of the Amazon River basin”. Professor Marcelo Bernardes and two anonymous reviewers are acknowledged for their helpful comments. The authors are very indebted to Professor Ghislain de Marsily, associate editor of C.R. Geoscience, for his insightful suggestions that contributed indeed to improve the quality of this manuscript.