

1 Introduction
East of the Azores triple junction, the limit between the Eurasian and the African plates in the Atlantic is an aseismic transform fault, which is nevertheless well defined by offsets of magnetic anomalies and bathymetric alignments. However, further to the east, in the Atlantic–Mediterranean transition, the contact between the plates changes to a diffuse transpressive seismic plate boundary, comprising a wide band of active deformation (e.g., [30,32]).
More precisely, this domain is a complex zone comprising different structures such as the Alboran Basin, the Betic and Rif orogens, the Gulf of Cadiz or the Atlas Mountains. The whole zone is affected by shallow and intermediate seismicity [7,39], although some deep earthquakes of great magnitude have occurred near Granada [8] (Fig. 1). A number of studies have been carried out in the area: seismic reflection/refraction profiles (e.g., [3,11,46]), seismic tomography (e.g., [5,6,9,28]), gravity modelling (e.g., [18,52]) and heat flow [12,37,40]. These studies show a thin crust and lithosphere under the easternmost part of the Alboran Basin, with a steep thickening towards the Betic and Rif arcuate thrust belt [52]. Recent integrated lithospheric models along 2D profiles indicate a rather flat lithosphere–asthenosphere boundary in the southwestern Iberian margin [13] and a pronounced lithospheric thickening beneath the Gulf of Cadiz [58]. The crustal root beneath the Atlas Mountains (e.g., [27,55]) is not thick enough to support isostatically the high topography and a thin, hot, lower density lithosphere is invoked in order to achieve full isostatical compensation [15,45,49,58]. Seismic tomography studies depict a positive P-wave velocity anomaly at 350–400-km depth beneath the Betics, Rif, and Alboran Basin, which dips to the southeast [9], but the resolution of these models is low in the Gulf of Cadiz, due to poor seismic station coverage.
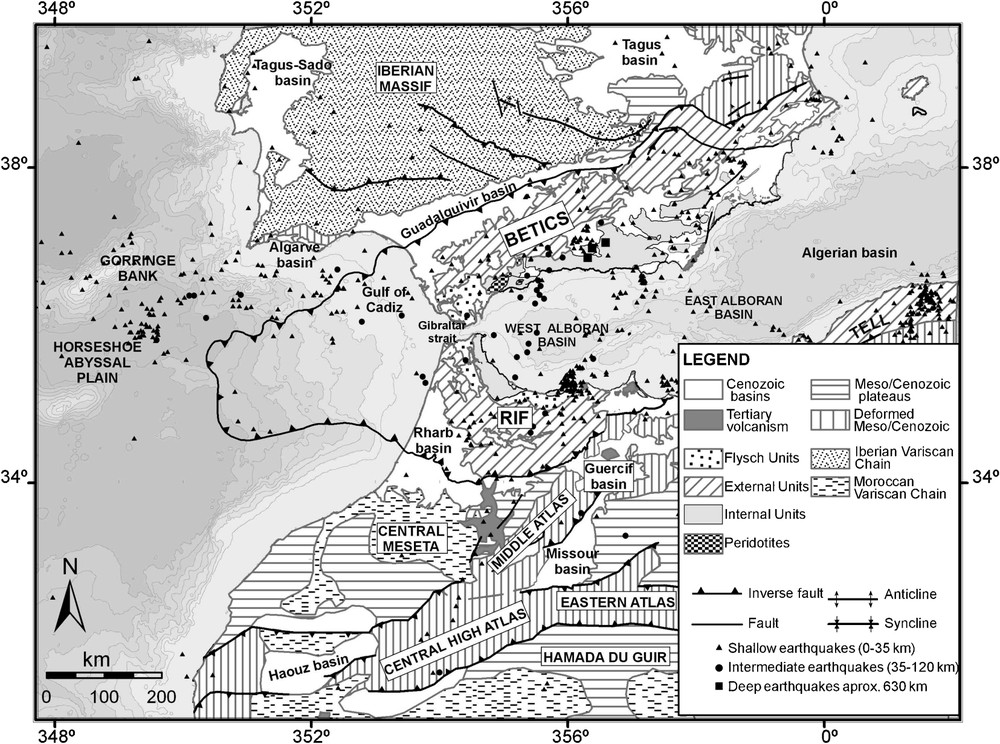
Geological map of the study area with epicentres of earthquakes of magnitude >3.5 during the interval 1961–2000 (AnSS catalogue http://quake.geo.berkeley.edu/anss/).
Carte géologique de la zone étudiée, avec les épicentres des séismes de magnitude >3.5 entre 1961 et 2000 (extraits du catalogue AnSS http://quake.geo.berkeley.edu/anss/).
Despite these works, several aspects remain unclear, mainly the way in which is resolved the transition from an oceanic Jurassic lithosphere in the Atlantic domain to a Neogene oceanic lithosphere in the Algerian Basin. Furthermore, the origin and formation of the South Iberian and North African margin is still a matter of debate and there are several, even mutually exclusive, geodynamical models proposed, all of them based on different geological and geophysical data: Neogene subduction associated with slab roll back [14,26], active subduction [20], delamination (e.g., [9,31,43]), convective removal [35,36], slab break-off [56,57] or slab roll-back and lithospheric tearing [48].
In this paper, we use elevation and geoid anomaly regional data, under the assumption of local isostasy, in order to obtain a regional scale 3D image of the crust and lithospheric structure in the Atlantic–Mediterranean transition zone. The aim is to constrain the different geodynamic models proposed to explain the evolution of the study area.
2 Fundamentals
To address the present structure of the Atlantic–Mediterranean transition, we have integrated elevation and geoid anomaly regional data assuming local isostasy. The choice of these two particular geophysical observables is due to the fact that they provide different kinds of information concerning the density distribution in the lithosphere: topography reflects the average density, whereas geoid anomalies are produced by variations in the dipole moment of the density [53]. We consider a two-layer model composed of crust and lithospheric mantle. In addition, we introduce the sea water and the asthenosphere layers with fixed density values of and , respectively (Fig. 2).
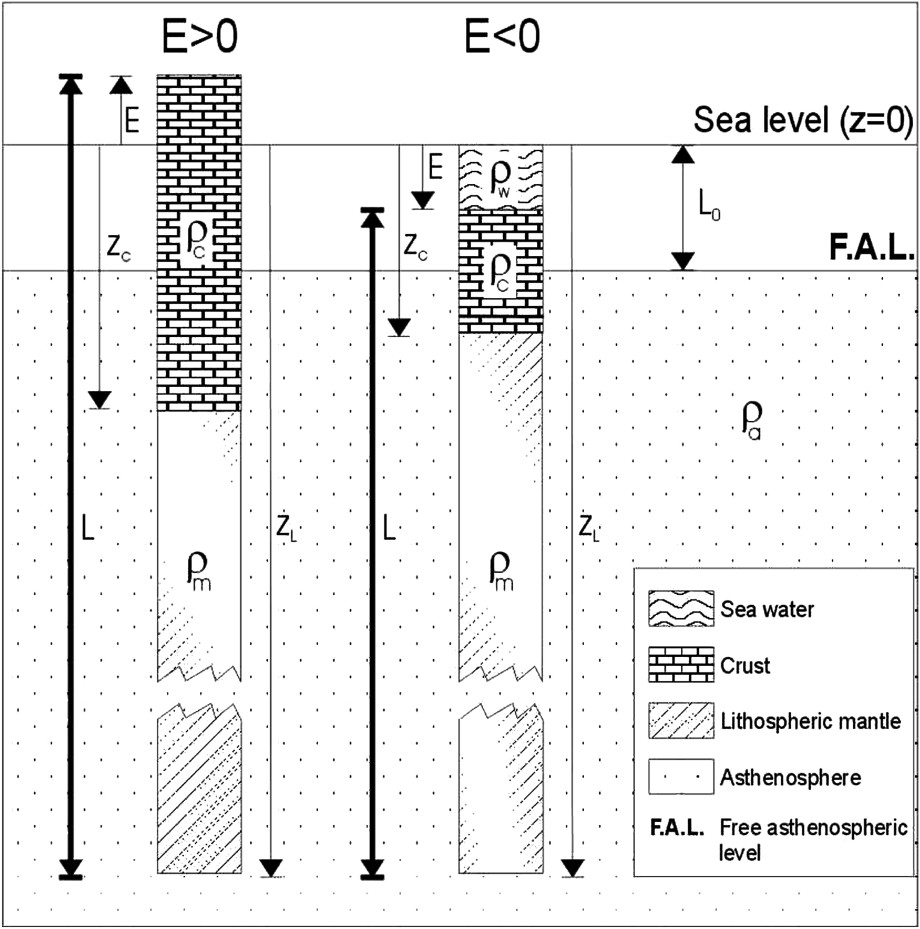
Notation for the lithospheric model used in this work. The model is composed of two layers, crust of density and lithospheric mantle of density , plus sea water and asthenosphere, with densities and , respectively. E is the elevation (E>0 topography, E<0 bathymetry), , and are the depths of the crust/mantle and lithosphere/asthenosphere boundaries, respectively, referred to the sea level. L is the total thickness of the lithosphere and is the depth of the free asthenospheric level, i.e. without any lithospheric load.
Termes et concepts utilisés pour le modèle lithosphérique dans ce travail. Le modèle est formé de deux couches : la croûte, avec une densité , et le manteau lithosphérique avec une densité . De plus, nous modélisons l'eau de mer et l'asthénosphère, de densités respectives et . E est la topographie (bathymétrie pour E<0), et indiquent respectivement la profondeur par rapport au niveau de la mer des limites croûte–manteau et lithosphère–asthénosphère. L est l'épaisseur totale de la lithosphère et la profondeur de surface d'une asthénosphère libre (sans charge lithosphérique).
The concept of local isostasy is based on the assumption that a series of rigid columns (the lithosphere) floats freely on an inviscid liquid (the asthenosphere) and below a certain level (the compensation level, ), the pressure does not vary laterally. So, the elevation is a measure of the buoyancy of the lithospheric columns. We can express this as [24]:
| (1a) |
| (1b) |
For our model with two layers each having a constant density, can be expressed as:
| (2) |
| (3) |
If local isostasy holds and the wavelengths of the lateral density contrasts are big enough with respect to their depth, i.e., the 1D approximation is suitable, then the geoid anomaly, N, is proportional to the dipolar moment of the anomalous mass distribution [23,33,53]:
| (4) |
| (5) |
The expressions (3) and (5) form a system of equations for the depths of the crust/mantle and lithosphere–asthenosphere boundaries, , , and for the densities of the crust and lithospheric mantle, , . Thus there are four variables and only two constraints (Eqs. (3) and (5)) so that the system remains underdetermined unless we make auxiliary hypotheses. The potential solutions to the system (i.e. the possible lithospheric configurations constrained by elevation and geoid anomaly) range between two end-member cases: on the one hand, we can assume constant densities in the crust and lithospheric mantle for the whole model and retrieve variable depths for the crust/mantle and lithosphere–asthenosphere boundaries, and, on the other hand, we can assume constant thickness for the crust and lithosphere over the whole model and then calculate lateral density variations for the crust and lithospheric mantle. In this work, we have opted for the first case, taking into account that the crustal thickness is well known to change over the study region. Hence, we consider and fixed and solve the system of equations to obtain and .
3 Geophysical data
The data used in this study were compiled from different publicly available worldwide databases.
3.1 Elevation
The elevation data, i.e. the topography and bathymetry, comes from the ETOPO2 Global Data Base [21,42,47]. The vertical accuracy of these data is characterized by a RMS error of 18 m onshore and of 200 m offshore (Fig. 3). Onshore, the Betic and Rif chains form together an arc parallel to the shoreline with short wavelength content. The elevation is locally higher than 3000 and 2000 m in the Betic and Rif chains, respectively, although the mean elevation is 1000–1500 m for the Betics and 500–1000 m for the Rif. In the north of the African continent, the Atlas Mountains trend NE–SW to east–west, with long topographical wavelengths and a mean elevation of about 2000 m, although altitudes of more than 4000 m are locally reached. Offshore, in the Alboran Sea, the water depth increases towards the distal and eastern parts of the basin reaching depths of more than 2000 m in the transition toward the Algerian Basin. To the west, in the Atlantic Ocean, depths of more than 4500 m are achieved in the Atlantic abyssal plains.
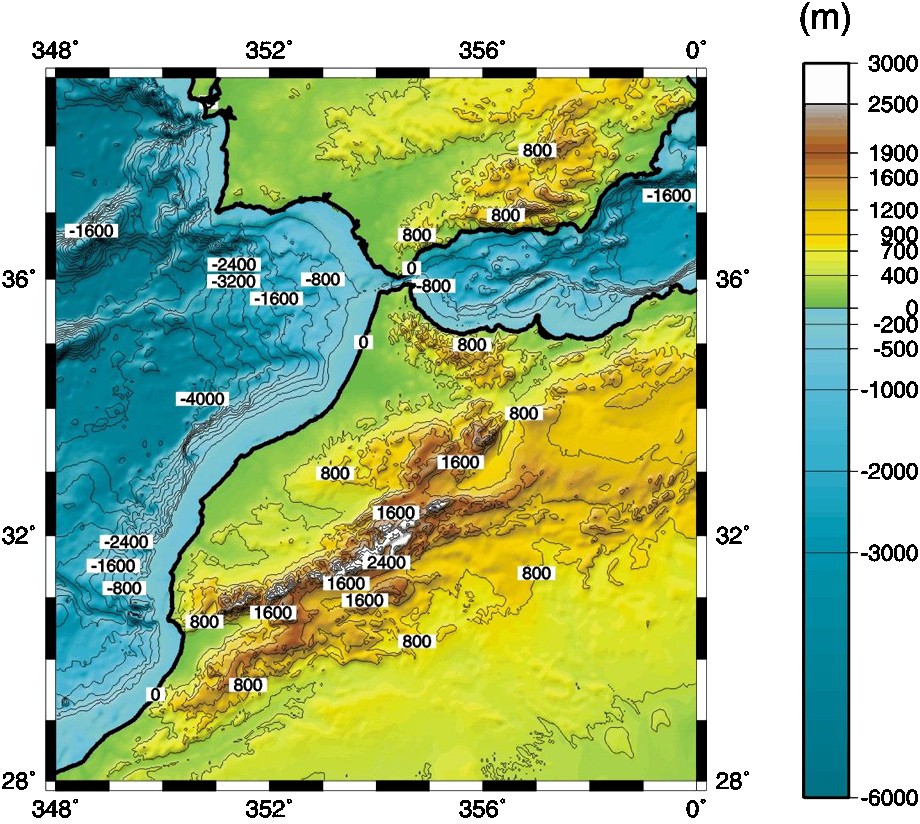
Elevation map from ETOPO2 Global Data Base [21,42,47], contours every 500 m.
Carte de la topographie à partir de la base de données globale ETOPO2 [21,42,47], contours tous les 500 m.
3.2 Geoid anomaly
Geoid anomaly data were taken from the EGM96 spherical harmonic global model [25]. The vertical accuracy of this model is described by a RMS error of 36 cm (Fig. 4). In order to eliminate the effect of sublithospheric sources of geoid undulations, we have removed the long wavelengths of the geoid anomaly , rolling off smoothly the low harmonic coefficients by means of a Gaussian function. This is to avoid undesired sharp cut-off effects [41]. The most remarkable characteristics of the geoid anomalies in the Atlantic–Mediterranean transition are, on the one hand, low values that cross the shoreline passing from the Gulf of Cadiz into the western Betics and Rif Mountains. These minimum values are extended south-westwards in the Atlantic Ocean. On the other hand, a NE–SW-directed strong maximum is observed in the Atlas Mountains, and a smaller one in the southwestern Iberian Peninsula. The geoid anomalies show decreasing values towards the African Craton.
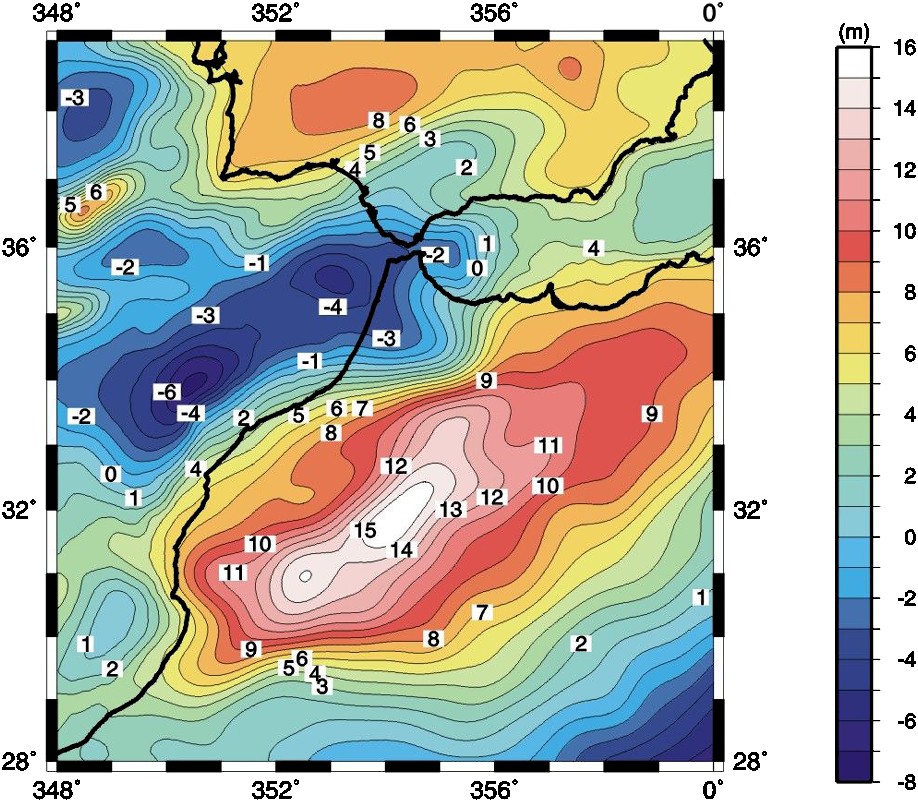
Geoid anomaly map from EGM96 Global Model [25]. Long wavelengths (>4000 km) have been removed rolling off smoothly the low harmonic coefficients by means of a Gaussian function. Contour interval is 1 m.
Carte des anomalies du géoïde à partir du modèle global EGM96 [25]. Les grandes longueurs d'onde (>4000 km) ont été éliminées en atténuant les coefficients des harmoniques basses par une fonction gaussienne. Intervalle d'isolignes : 1 m.
4 Modelling results
We have considered a model in which the densities of the crust and lithospheric mantle are assumed to be constant, with values of 2780 and 3245 kg m−3, respectively (Table 1), in order to obtain the depth of the crust/mantle and lithosphere/asthenosphere discontinuities fitting simultaneously elevation and geoid anomaly. The maximum compensation level, , has been set to 300 km.
Parameters used in the modelling
Paramètres utilisés dans la modélisation
| Parameter | Symbol | Value |
| Crustal density | 2780 kg m−3 | |
| Lithospheric mantle density | 3245 kg m−3 | |
| Astenosphere density | 3200 kg m−3 | |
| Sea water density | 1030 kg m−3 | |
| Compensation level depth | 300 km | |
| Moho depth of the reference column | 28 km | |
| Lithosphere–asthenosphere boundary depth of the reference column | 129 km |
As mentioned above, one important hypothesis of this work is that of local isostasy. It is clear that short wavelengths are partly supported by the rigidity of the lithosphere. In most parts of the area, the rigidity seems to be relatively small, corresponding to an elastic plate of up to 10-km thickness (e.g., [10,58]). Such a plate may support the topography with wavelengths of up to 100 km. Therefore, we filter the elevation eliminating the short wavelengths that would produce unrealistic effects in our modelling.
4.1 Crust
Fig. 5A is a map of the base of the crust that we obtain in our model assuming constant densities in the crust and lithospheric mantle (Table 1). We image a thickened crust beneath the Betics , the base of which descends locally deeper than 36 km. Southwards, towards the Alboran Basin, the base of the crust rises abruptly, reaching depths of in the south-Iberian coast and 20–22 km in the central Alboran Basin. The depth of the Moho in the easternmost part of the Alboran Basin, at the transition to the Algerian Basin, is less than 16 km, while near the Gibraltar Strait it is 28–30 km. In Africa, we image a thickened crust of more than 34 km in the Rif Mountains and of more than 38 km in the Atlas. In the Atlantic domain, the base of the crust rises to 12–8 km in the abyssal planes and is between 24 km and 30 km in the Gulf of Cadiz. The crust shows smooth lateral variations in the southwestern Iberian Peninsula (24–26 km) and the African Craton .
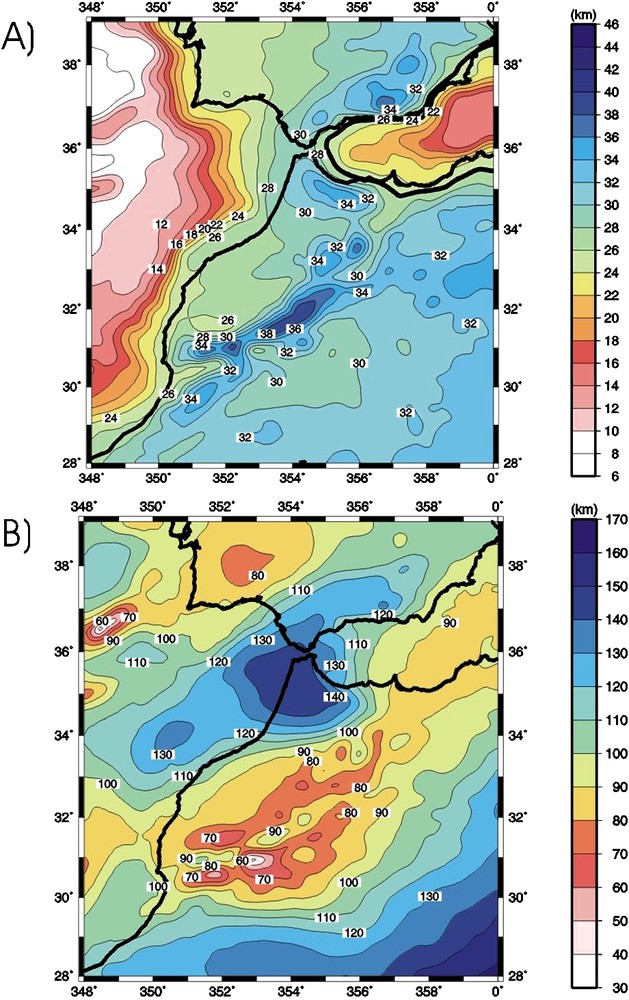
Lithospheric structure derived from elevation and geoid anomaly data, assuming constant densities in the crust and the lithospheric mantle (Table 1). (A) Map of the Moho depths. Isolines every 2 km. (B) Depth of the lithosphere–asthenosphere boundary. Contour interval is 10 km.
Structure de la lithosphère obtenue à partir des anomalies de la topographie et du géoïde en utilisant une densité constante dans la croûte et dans le manteau lithosphérique (Tableau 1). (A) Carte des profondeurs du Moho (isolignes tous les 2 km). (B) Profondeur de la limite lithosphère–asthénosphère (isolignes tous les 10 km).
The southern Iberian Margin has been addressed by several seismic refraction surveys in the last 25 years. These studies suggest that the crust thins from below the central Betics [2,3] to 22–25 km in the south-Iberian coast and less than 15 km in the centre of the Alboran Basin [2,22]. Other works based on gravity modelling [50], seismic interpretation and backstripping analysis [54] along profiles propose a slightly thicker crust of 17–20 km in the central Alboran Basin. A 3D gravity modelling study in the Alboran Basin revealed a rather constant Moho depth of about 18 km, thinning to less than 12 km in the easternmost part of the Alboran Basin, and a 30–32-km thick crust beneath the Gibraltar Strait [52]. A similar value of about 30 km is obtained for the crustal thickness in the Gibraltar Strait according to Medialdea et al. [29]. Our results coincide with these studies in the Gibraltar Strait, but show a deeper Moho in the central and eastern parts of the Alboran Basin.
The crust reaches a maximum thickness of 40 km below the Rif according to Giese and Jacobshagen [16], although other authors decrease this value to , based on gravity calculations [52], a more likely value according to our results. In the Atlas, tectonic shortening is moderate and poorly correlated with topography, suggesting that the crustal root beneath the Atlas Mountains is not deep enough to support isostatically the high topography [27,49,55]. Available seismic data indicate a maximum crustal thickness of 38–39 km beneath the most elevated parts of the Atlas [27,55], which correlates well within the thickness inferred from our model.
In the southwest of the Iberian Peninsula, the IBERSEIS deep seismic profile indicates a 30–35-km-thick crust in the vicinity of the Gulf of Cadiz [46]. Westwards, near the Algarve Margin, the reinterpretation of deep seismic refraction/wide-angle reflection profiles suggests a crustal thickness of 30–33 km [17]. The same authors propose a dramatic crustal thinning from 30 km under the Iberia mainland to less than 15 km offshore, in the Horseshoe Abyssal Plain, over a horizontal distance of 120 km. In the Gulf of Cadiz, the Moho is situated at a depth of 25–30 km according to González-Fernández et al. [17]. Recent 2D integrated lithospheric modelling reduces the maximum crustal thickness to 30 km in the southwestern Iberian Margin [13]. On the other hand, the crust that we determine below the Southwest of the Iberian Peninsula is 4–6 km thinner than that suggested by Fernàndez et al. [13].
The crustal image that we obtain in our model is in general in good agreement with these previous works, except for the central and eastern Alboran Basin, where we obtain a thicker crust, and for the Southwest of the Iberian Peninsula, where a thinner crust is inferred from our results. In both cases, the maximum difference with respect to earlier studies is about 6 km.
4.2 Lithospheric mantle
The lithosphere thickens beneath the western Rif to more than 140 km. From this place, the thickening continues along a NE–SW strip and affects the western Betics, the Gulf of Cadiz, the Rharb Basin and the northwestern Atlantic margin of Morocco, reaching depths between 120 and 130 km (Fig. 5B). Lithospheric thinning is observed in the eastern Alboran Basin (90 km) and the southwestern Iberian Peninsula (80–85 km). The model also shows a prominent NE–SW lithospheric thinning along the Atlas Mountains (70–80 km). The lithosphere thickens gradually towards the southeast beneath the African Craton to depths of more than 170 km.
The lithospheric structure in the Atlantic–Mediterranean transition has been investigated in number of geophysical studies [13,51,52,58]. Torne et al. [51] present two lithospheric profiles across the southwestern Iberian margin constrained with elevation, heat flow, gravity and geoid anomalies, resulting in a 110-km-thick lithosphere beneath the south Iberian Massif and a lithospheric thickness of 120 km in the Tagus abyssal plain. Fernàndez et al. [13], however, decrease the lithospheric thickness in the southwestern Iberian Peninsula to 96 km, invoking a deep mass deficit in order to make compatible high Bouguer anomaly values with moderate elevation and geoid anomaly values in the area. The same authors suggest an increase in the lithosphere–asthenosphere boundary depth to values of 125 km further to the southwest, offshore, beneath an oceanic lithosphere of about 150 Ma. Our results are in good agreement with these values.
According to Torne et al. [52], the base of the lithosphere shallows from about 140 km in the Gibraltar Strait, Betics and Rif, to less than 40 km in the easternmost part of the Alboran Basin. A recent work that integrates surface heat flow, elevation, gravity and geoid data along a NW–SE transect running from the southwest of the Iberian Peninsula to the African Craton reports a strongly thickened lithosphere of 160–190 km beneath the Gulf of Cadiz, with a pronounced thinning towards the Atlas up to 70 km [58]. The lithosphere–asthenosphere boundary obtained in this work is, in general, coherent with this trend, although some differences arise in the amplitude of thinning/thickening in the Alboran Basin and the Gulf of Cadiz. In the Alboran Basin, our results suggest a 40-km thicker lithosphere than that proposed by Torne et al. [52], while in the Gulf of Cadiz we obtain a lithospheric thickness 10–40 km smaller than that suggest by Zeyen et al. [58].
Zeyen et al. [58] propose a lithospheric thickening underneath the African Precambrian Craton to 180 km or more. Other works based on global thermal and geochemical studies suggest a lithospheric thickness of 140–200 km for Proterozoic cratonic areas such as the African Craton, compatible with our results [1,38].
5 Discussion
5.1 Lithospheric structure
For the most part, the lithospheric structure derived from our methodology is consistent with other studies conducted in the area. However, as we have seen before, there are some discrepancies between our results and previous works that might be worth to discuss.
In our results, unlikely short wavelengths at the base of the lithosphere are observed locally beneath the Atlas and the Gorringe Bank. These are probably due to 3D effects, since the Atlas and the Gorringe Bank contain the largest horizontal gradients of elevation in the study area. In addition, a basic assumption we make is local isostasy, therefore, unrealistic results are expected in places where it is not achieved, like most probably in the Gorringe area.
For our model, we have chosen a constant crustal density of 2780 kg m−3. This average value should be constant even for different types of crust along the study area (e.g., continental vs. oceanic). Nevertheless, major lateral variations in the crustal density are present in the study area due to changes in its nature and/or sediment accumulation. To check the influence of the crustal density in our results, we have performed two additional tests focused on the zones where most important differences in crustal thickness were found with respect to earlier studies: the southwestern Iberian Peninsula and the Alboran Basin.
Fernàndez et al. [13] have characterized the southwestern Variscan crust of the Iberian Peninsula as composed of three layers: an upper crust, comprising different density domains ranging 2740–2800 kg m−3, of about 8-km thickness, a middle crust with a density of 2800 kg m−3 and a thickness of 18 km, and a 6-km-thick lower crust, with a density of 2950 kg m−3. This represents an average crustal density of 2820 kg m−3. The Moho depth obtained using a crustal density of 2820 kg m−3 is shown in Fig. 6A. The crustal thickness increases to 28–30 km in the SW of the Iberian Peninsula, a more likely value according to previous works [13,17]. The lithospheric thickness increased by 10 km in the southwestern Iberian Peninsula, a value closer to that inferred from Fernàndez et al. [13] (Fig. 6B).
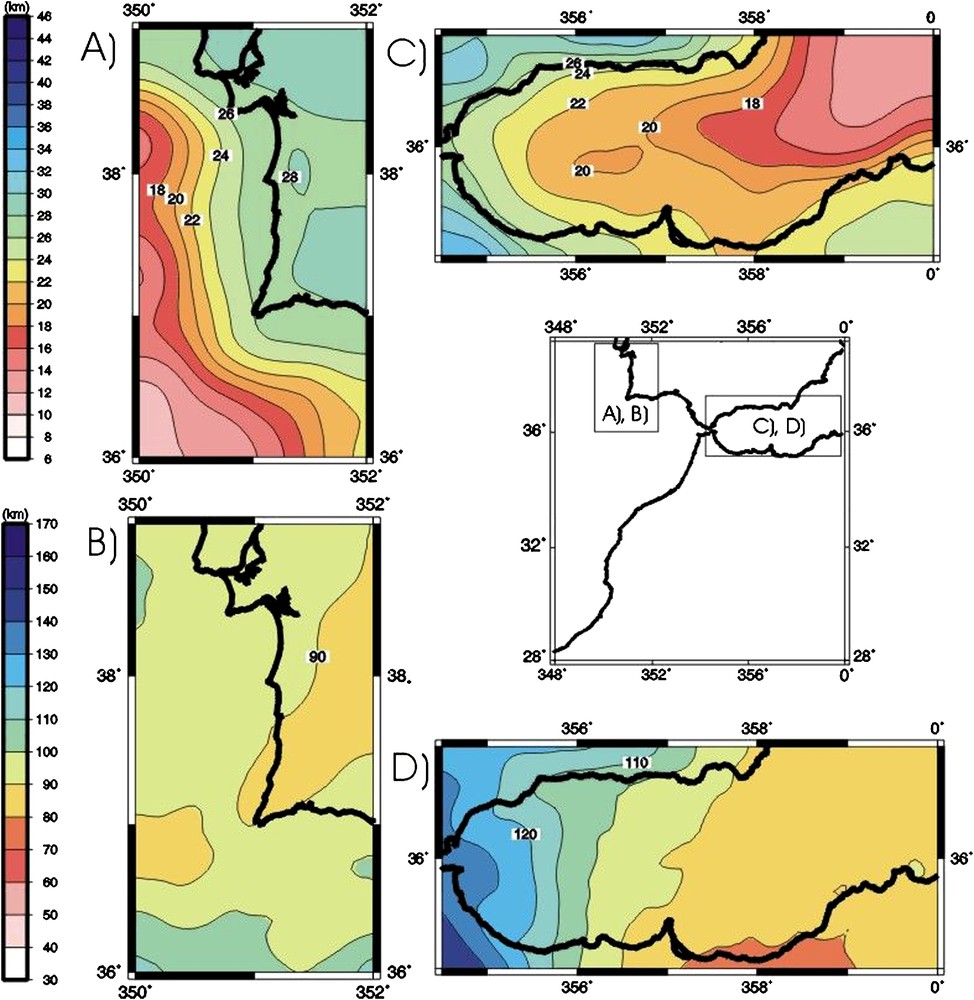
Alternative models corresponding better to published seismic data: (A, B) lithospheric structure in the southwestern Iberian Peninsula considering an elevated constant density in the crust of 2820 kg m−3. (A) Map of the Moho depths. Isolines every 2 km. (B) Depth of the lithosphere–asthenosphere boundary. Contour interval is 10 km. (C, D) Lithospheric structure in the Alboran Basin considering a reduced constant crustal density of 2750 kg m−3. (C) Map of the Moho depth. Isolines every 2 km. (D) Depth of the lithosphere–asthenosphere boundary. Contour interval is 10 km.
Modèles alternatifs qui correspondent mieux aux données sismiques publiées : (A, B) structure lithosphérique dans le Sud-Ouest de la péninsule Ibérique en augmentant la densité de la croûte à 2820 kg m−3 : (A) carte des profondeurs du Moho (isolignes tous les 2 km) ; (B) profondeur de la limite lithosphère–asthénosphère (isolignes tous les 10 km) ; (C, D) structure lithosphérique sous le bassin d'Alboran après réduction de la densité crustale à 2750 kg m−3 ; (C) carte des profondeurs du Moho (isolignes tous les 2 km) ; (D) profondeur de la limite lithosphère–asthénosphère (isolignes tous les 10 km).
In the eastern and central Alboran Basin the marine sedimentary infill is 1–2 km thick and is mainly composed of shales, sandstones and marls, which represent a density range from 2100–2700 kg m−3 [52]. To take this into account, we have considered an average crustal density of 2750 kg m−3 instead of 2780 kg m−3, the rest of the model's parameters remaining fixed. We find that the depth of the Moho is decreased to 20–18 km and to less than 14 km in the central and eastern parts of the Alboran Basin, respectively (Fig. 6C), which is in better agreement with previous works [50,52,54]. This would imply that the average value of 2780 kg m−3 for the crustal density in the central and eastern parts of the Alboran Basin might be excessively high. The lithosphere–asthenosphere boundary depth is, however, not significantly changed by this variation in the crustal density (Fig. 6D).
Another limitation is that, for the sake of simplicity we have considered a constant lithospheric mantle density in this work. However, the lithospheric mantle density is commonly assumed to be temperature dependent (e.g., [24,34]). Taking this into account, the density distribution within the lithospheric column changes (i.e. the higher density placed nearer to the crust-mantle boundary) and so does the geoid anomaly calculation. This would mean a larger lithospheric thickness in our results, especially in areas with a thick lithosphere (e.g., the Gulf of Cadiz), as proposed by Zeyen et al. [58].
An extremely thin lithosphere of about 40-km thickness is proposed in the central and eastern Alboran Basin constrained by elevation, Bouguer anomaly and heat flow [52]. The thinning is invoked, mainly, to explain the elevated surface heat flow [12]. However, these authors do not take into account the geoid anomaly. If, for instance, we assume that below the 2-km-thick water layer, the crust-mantle and lithosphere–asthenosphere boundaries are located at depths of 12 and 40 km, respectively, then the geoid anomaly, according to Eq. (5) and the parameters listed in Table 1, would be of 7.8 m. However, this theoretical geoid anomaly is 4.8-m higher than the observed values in the central and eastern Alboran Basin . Equivalently, if we consider a Pratt-type compensation model (i.e. layers with constant thickness and lateral variations in densities) and the above mentioned depths for the Moho and the lithosphere–asthenosphere boundary, unrealistic values for the crustal and lithospheric mantle densities of 2200 and 3460 kg m−3, respectively, would be necessary to fit a geoid anomaly of 3 m. Our results therefore indicate that a thicker lithosphere below the central and eastern the Alboran Basin is required in order to fit the geoid anomaly.
We have estimated the relative error in our calculations for the Moho depth and for the lithosphere–asthenosphere boundary depth , taking into account the RMS error of the elevation and geoid anomaly data used. With respect to the crust, due to RMS error in elevation is, for topography less than 10%, and for bathymetry less than 15%, while produced by RMS error in geoid anomaly is less than 10%. For the lithospheric thickness, we find that is owing to both RMS errors in elevation and geoid anomaly.
The simplicity of the assumed hypotheses (i.e. local isostasy, two-layered model with constant densities) does not permit us to introduce lateral density changes in the crust, to account for thermal influence in the lithospheric mantle density, or 3D effects. These issues may have some effect, at least in the presence of largely different lithospheres in the study area, although we do not expect major differences in the general lithospheric setting. Hence, more detailed 3D modelling that integrates all available geophysical data would be useful in order to know with a better accuracy the lithospheric structure. This kind of modelling would improve our knowledge about the present-day configuration in the Atlantic–Mediterranean transition region, as a key to understand the geodynamic evolution of the whole area. However, the presented method is able to give a very fast initial model that represents the main structural trends of a region.
5.2 Geodynamic interpretation
Additional knowledge of lithospheric heterogeneities can be gained through the velocity models derived from tomography studies. A positive velocity anomaly between 200- and 700-km depth has been reported by Blanco and Spakman [6] and interpreted as a NE–SW striking slab beneath the Alboran Basin and the eastern Betics. The low velocities observed above the mentioned slab would imply, according to the authors, its detachment from the surface, and that hot asthenospheric material has replaced the free space generated by this detachment. Bijwaard and Spakman [4] image low-velocity zones from the surface down to 150-km depth below the Alboran Basin and Atlas Mountains, and high velocity zones in the Betics, Rif and Gibraltar Strait spanning the depth range from 60 to 350 km. However, they do not image the high-velocity anomaly west of the Gibraltar Strait, where they lack seismic coverage. Other tomography studies suggest a strong positive velocity anomaly below the Strait of Gibraltar and southern Spain between 60- and 400-km depth, steeply dipping to the southeast, and detached from another high-velocity anomaly located between 570- and 650-km depth [9]. Recent tomography results image a positive velocity anomaly beneath the Betic–Rif and Alboran region from the base of the crust across the entire upper mantle, therefore discarding a complete slab break-off [48]. Restricted to the Alboran Basin, Gurria and Mezcua [19] suggest a low-velocity layer in the depth range of 40–60 km, which they associate to a process of delamination inside the lithospheric mantle. Marone et al. [28] also image high-velocity heterogeneity underneath the Iberian Peninsula, although they see it further to the north.
The modelling carried out by fixing the densities of the crust and lithospheric mantle depicts the main lateral variation in the crust and lithosphere over the Atlantic–Mediterranean transition zone. The most outstanding result obtained in the present work is the independent variation of the crust/mantle and lithosphere/asthenosphere boundaries. Our results indicate that both the crust and the lithosphere thicken below the Gibraltar Strait, Betics and Rif Mountains, in line with the velocity anomalies depicted in tomography studies [4,6,9,48]. However, we find that this thickening continues farther to the southwest, including the Rharb Basin, the Gulf of Cadiz and the northwestern Atlantic margin of Morocco, where it is, however, restricted to the lithosphere. Thus, a NE–SW oriented continuous lithospheric slab is mapped from the northwestern Atlantic margin of Morocco to the Betics. With a similar NE–SW trend, we find a strong lithospheric thinning beneath the Atlas Mountains and, to a lesser extent, the southeastern Alboran Basin. The crustal root beneath the Atlas does not seem to be thick enough as to compensate isostatically the elevated topography by itself. This can be checked by simple calculation: considering topography for the Atlas of 2.5–3 km, the same crustal and lithospheric mantle densities, and reference column that we use in this work (Table 1), the crustal root necessary to accomplish isostasy is 15–18 km thick. Therefore, to isostatically compensate the Atlas topography a Moho depth of 43–46 km would be needed, which is deeper than the 38–39 km inferred from seismic data [27,55]. To explain this misfit, some authors propose an upwelling of asthenosphere material [44,49], which could be related to the presence of a small mantle plume [58]. South-eastwards, towards the African Craton, the lithosphere thickens smoothly.
An eastward subduction beneath Gibraltar with a slab roll-back to the west has been invoked by some authors, either active [20] or extinguished [26]. The induced corner flow in the back-arc region would account for the extension and subsidence in the Alboran Basin as due to the injection of hot, low-density, asthenospheric material, while the high-velocity anomaly would be related to the subducted lithospheric slab. Other hypotheses consist in convective removal of a previously thickened lithosphere, either due to slab oceanic detachment [56,57] or to gravitational instability [35,36], in both cases with an infill of hot asthenospheric material. To explain the westward migration of the Alboran domain, a delamination model has been proposed by some workers [9,31,43]. The nearly north–south line of intermediate earthquakes overlain by low-velocity material and underlain by high-velocity material has been understood as clear evidence of lithospheric peeling from east to west [43]. Even though the lithospheric thickening below the Gibraltar Strait, the Betics and Rif mountains seems to be clear, its southwestwards continuation, as seen in our results, may put some question marks on subduction and delamination models. The lateral extent of the slab would rule out an Alboran-restricted delamination model. Furthermore, the supposed subduction front should be located westward of the Gibraltar Strait, far from where the subduction models confine it. The parallel SW–NE alignment of the lithospheric thinning beneath the Atlas and the thickening of the lithospheric mantle beneath the Atlantic–Moroccan margin and the Betics suggest that both features are linked to each other and associated with deep processes, which are decoupled from the crust and related to the dynamics of the Eurasia–Africa plate boundary.
6 Conclusions
In this work, we have presented a new technique based on automatic interpretation of elevation and geoid anomaly data, used to image the main lithospheric heterogeneities. The methodology is straightforward, has the significant advantage of working with publicly available geophysical data and to need very little computational effort. It has permitted us to draw the main lateral density variations within the lithosphere in the Atlantic–Mediterranean transition. The principal conclusions are:
- (1) there is a prominent lithospheric thickening (120–150 km) with a NE–SW trend affecting the western Betics and Rif Mountains, the Gibraltar Strait, the Rharb Basin, the Gulf of Cadiz and the northwestern Atlantic margin of Morocco. In the crust, this thickening is restricted to the Betics and Rif Mountains;
- (2) the lithosphere thins underneath the eastern Alboran Basin and the south-western Iberian Peninsula (70–85 km);
- (3) along the Atlas Mountains, a conspicuous lithospheric thinning is observed with NE–SW orientation (60–80 km);
- (4) beneath the African Craton, the lithosphere thickens gently to depths of more than 170 km;
- (5) lateral variations in the crustal density are important to calculate the Moho depth using the methodology described in this work. We have found that crustal densities of 2750 kg m−3 in the eastern and central Alboran Basin, and of 2820 kg m−3 in the Southwest of the Iberian Peninsula, instead of the reference crustal density considered of 2780 kg m−3, allow us to fit better the crustal thickness inferred from seismic data.
Acknowledgements
This work has been supported by a FPU grant from the Spanish Ministerio de Educación y Ciencia within the projects MARSIBAL-II (REN2001–3868-C03-02/MAR), WESTMED (ESF-EuroMARGINS 01-LEC-EMA 22F/REN2002-11230-E-MAR) and NATO grant EST.CLG.978922. The authors are very grateful to L. Iribarren and A. Geyer for their help in producing the figures.