

1 Introduction
Satellite altimetry provides a global, high-resolution and all-weather description of the sea-level and ocean-circulation variations. Over the past 20 years, satellite altimetry has revolutionized our vision and understanding of the ocean circulation. TOPEX/Poseidon (T/P) was a major milestone. Thanks to its high accuracy, it has provided, for the first time, a precise description of global mean sea level, large-scale circulation, Rossby waves, El Niño/La Niña events (see [3,23,60] for a review). T/P was launched in 1992 and its follow-on Jason-1 was launched in 2001. ERS-1, ERS-2 and ENVISAT provide complementary sampling that is needed, in particular, for ocean mesoscale variability monitoring (see [39]). The minimum requirement for altimetry is that at least two altimeter missions with one very precise long-term altimeter system are needed. With T/P and Jason-1 and ERS and ENVISAT mission, this minimum requirement has been met since 1992. Le Traon and Dibarboure [40] provide a summary of the mapping capabilities of the T/P + ERS (Jason-1 + ENVISAT) configuration. Sea level can be mapped with an accuracy of less than 10% of the signal variance, while the velocity can be mapped with an accuracy of 20 to 40% of the signal variance (depending on latitude).
This paper provides a summary of recent results derived from satellite altimetry. It is focused on altimetry and ocean dynamics with synergistic use of other remote sensing techniques, in-situ data and integration aspects through data assimilation. For a more comprehensive review of altimeter results, the reader is referred to Fu and Cazenave [22]. Section 1 deals with mean ocean circulation and geoid issues. Tropical dynamics and large-scale sea level and ocean circulation variability are addressed in Sections 2 and 3. Results on high frequency and intraseasonal variability are described in Section 4. The subjects on Rossby waves and mesoscale variability are summarized in Sections 5 and 6. Section 7 provides the main conclusions and perspectives.
2 Geoid and gravimetry: mean ocean circulation
Satellite altimetry provides sea level anomaly (SLA) () with a very good accuracy (a few centimeters) and high resolution (SLA is easily extracted from altimeter data using repeat-track analysis). To get a precise estimation of instantaneous absolute dynamic topography η, , the mean dynamic topography (MDT), must be known with a resolution of 100–200 km and an accuracy of a few centimeters (e.g., [38]). Until recently, geoid models were not sufficiently accurate to provide a useful estimation of the mean dynamic topography. Typical accuracy was of 10 to 20 cm rms for a spherical harmonic expansion to the degree and order of 20 (i.e., wavelengths larger than 2000 km). This was comparable to the accuracies of the MDT derived from existing ocean models or in-situ data. Different techniques were developed to overcome these limitations. The synthetic geoid methodology is a powerful technique that merges altimeter and in-situ data to estimate precise MDTs. It proceeds as follows. In-situ data can provide estimates of the absolute dynamic topography η and satellite altimetry provides at the position and time of the in-situ data. The combination of the two estimates thus yields the mean dynamic topography over the needed time period. The technique was applied for the first time to the global ocean using all available simultaneous in-situ temperature and salinity profile data, surface drifters and T/P and ERS-1/2 altimeter data by Rio and Hernandez [65]. These estimations were then combined with a mean dynamic topography derived from the CHAMP geoid. Uchida and Imawaki [78] and Niiler et al. [54] have derived respectively a North Pacific MDT and a global MDT from surface drifters and altimetry using a similar approach. The synthetic geoid methodology provides improved estimation of the MDT, but is limited by the number of in-situ measurements and cannot be applied in coastal/shelf regions. The accuracy is also low in high latitude regions where the barotropic signals are large.
GRACE is now providing much more accurate geoids (and thus MDTs), with a typical accuracy of several centimeters up to spherical harmonics of degree and order of 40 [74]. This has and will have a large impact on the use and interpretation of altimeter data and for operational oceanography applications (see discussion in [42,43]). Such estimations can also be combined with in-situ data to improve the accuracy. Rio et al. [66] have thus now derived a new MDT using GRACE data and the synthetic geoid methodology (Fig. 1). While a significant progress can be made in the coming years to improve MDT estimations, only GOCE mission will be able, however, to provide the 1- or 2-cm precision with a 100- or 200-km resolution everywhere that is needed to adequately resolve the MDT signals.
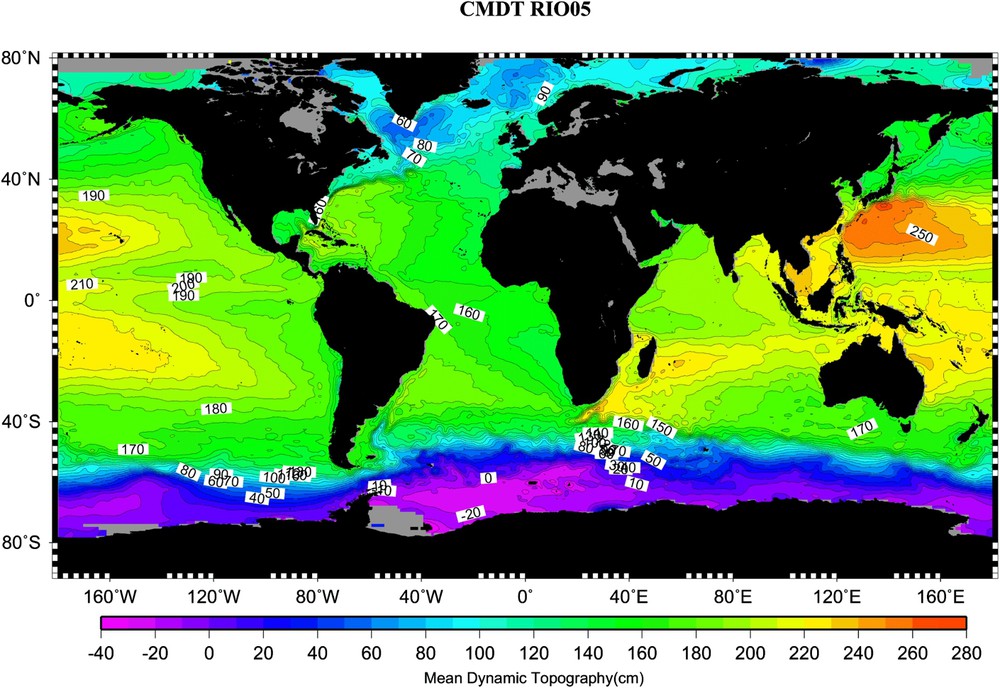
MDT derived from GRACE, altimeter and in-situ measurements (courtesy of M.H. Rio from CLS Space Oceanography Division [66]).
Topographie dynamique moyenne déduite des données GRACE, altimétriques et in situ [66].
3 Tropical ocean variability
The past decade has seen many dramatic events in the tropical oceans: the prolonged series of warming of the tropical Pacific in the early 1990s, the strong El Niño and La Niña of the late 1990s, and the relatively rare Indian Ocean Dipole Mode events of 1994 and 1997 (Fig. 2). For the first time, there was a suite of satellites making various observations of these large-scale changes in the ocean, allowing an unprecedented opportunity to study these important phenomena. For example, Picaut et al. [61] used satellite observations of sea-surface temperature, sea-surface height, and wind velocity to analyze the various mechanisms responsible for the unusually strong El Niño in 1997 and the rapid formation of the subsequent strong La Niña in 1998. This work has demonstrated the importance of the eastward surface currents resulting from a strong west wind burst in carrying the eastern edge of the western Pacific warm pool to the central Pacific, leading to an air–sea coupled system responsible for El Niño. They also identified a series of equatorial Kelvin and Rossby waves responsible for the drastic transition into La Niña in the spring of 1998. The paper presented a good case for the value of multiple satellite observations in testing various ENSO theories as well as putting together a coherent picture of the complex system at work.
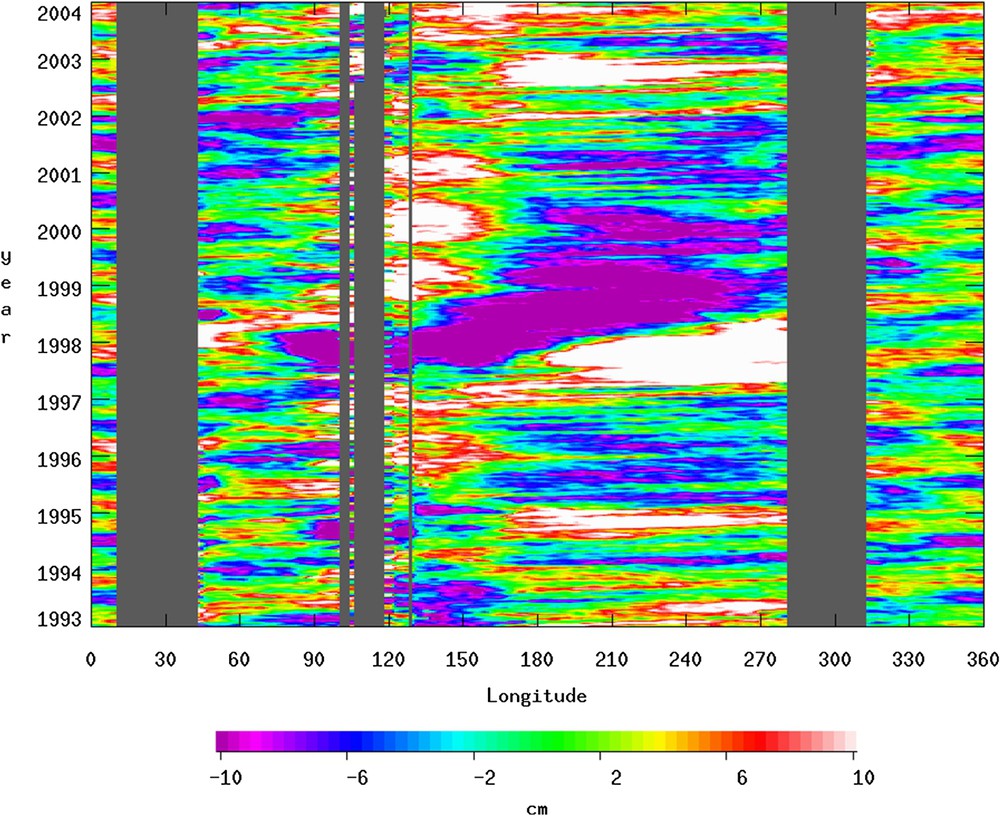
Sea-surface height variations relative to a long-term mean as a function of longitude and time along the equator. The data are from a combined record of altimeter measurements from TOPEX/Poseidon and Jason.
Variations du niveau de la mer en fonction du temps et de la longitude à l'équateur. Les données proviennent d'une série combinée de Topex/Poseidon et Jason.
The displacement of the western Pacific warm pool by the surface currents resulting from equatorial Kelvin and Rossby waves for other ENSO events in the 1990s was studied by Delcroix et al. [13]. They suggested that the existing ENSO theories need a revision by including the roles of the equatorial waves in the movement of the warm pool and the reflection of the Kelvin waves into Rossby waves at the eastern boundary. An important development in the study of tropical ocean currents is the use of wind observations from satellite scatterometers for computing the wind-driven current velocity, which is combined with altimetry observations of sea-surface height for determining the total current velocity in the tropics [37].
The new capability of observing several key variables in the ENSO process from space has led to the advancement of ENSO prediction. Lee et al. [45] developed a method for assimilating sea-surface height, sea-surface temperature and wind observations simultaneously in an ocean–atmosphere coupled model for improving the ability to forecast ENSO events. Using an optimal adjoint modeling approach, Lee et al. were able to update the model calculation in a physically consistent manner, without any initial condition inconsistencies experienced in most un-coupled assimilation calculations. The paper has demonstrated in particular the utility of satellite data in hindcasting the 1997–1998 ENSO event.
The decade-long altimetry observations of sea-surface height have led to new understanding of the equatorially trapped waves. Chelton et al. [6] have made a detailed description of the asymmetrical amplitude of the annual Rossby waves in the tropical Pacific. They reported that the amplitudes of these waves were twice larger to the north of the equator than to the south of the equator. This is at odds with the conventional theory that describes these waves as Rossby waves of the first meridional mode with equal maxima of amplitude at the two sides of the equator. Furthermore, the observed westward phase speeds are 40% less than the prediction of the conventional theory. Chelton et al. [6] proposed a new theory that included the effects of observed meridional shears of the equatorial current system. The calculations based on the new theory were able to explain the asymmetry in amplitude and the slow phase speeds of the waves observed from altimetry data.
New understanding of the mechanisms for the intraseasonal variability in the Indian Ocean has been gained through satellite observations. Based on TOPEX/Poseidon observations of sea-surface height, Han [31] reported a dominant spectral peak at 90-day period and a secondary peak at 30–60-day period in the equatorial Indian Ocean. However, the wind forcing (zonal wind stress) is slightly stronger at the 30–60 day period than the 90-day period. Using ocean models, Han [31] interpreted the dominance of the 90-day peak in terms of a resonance of the ocean's response to wind forcing. The resonance was achieved by Kelvin and Rossby waves of the second vertical mode.
Basin-wide resonance was also discovered in the tropical Atlantic Ocean. Recently, Schouten et al. [69] used 10 years' worth of altimeter data from the TOPEX/Poseidon and ERS satellites to study the seasonal variability of the tropical Atlantic. They confirmed the earlier modeling results of a basin-wide resonance at the semi-annual period (e.g., [59]) and explained the resonance in terms of Kelvin and Rossby waves based on observations.
4 Global large-scale low-frequency variability
A key strength of satellite observations is the global and frequent coverage, allowing the sampling of large-scale variability over a wide range of time scales. Satellite altimetry from the various missions (TOPEX/Poseidon, ERS-1 and 2, GFO, Jason-1, and ENVISAT) has provided the first decade-long continuous global observations of the world's oceans. This unique data record has created a wealth of new information on the large-scale low-frequency variability of the global oceans. Among the new discoveries, the most surprising is the capability of estimating global mean sea-level variations from space [3,46,53]. Shown in Fig. 3 is a time series of the global mean sea level measured by T/P and Jason-1 (from [46]). A key step of making such calculations is the calibration of altimetric systematic errors by using well-surveyed tide gauges [51]. The rate of the rising of the global mean sea level during 1993–2003 is estimated to be , which is significantly higher than the average rate of in the 20th century [50]. Willis et al. [83] used XBT data to estimate the change of global mean sea level caused by the warming of the ocean and concluded that about 1.6 mm yr−1 during the past decade could be attributed to the warming of the ocean. This would leave the remaining 1 mm yr−1 for the mass change in the ocean. This rate is consistent with the estimate of Miller and Douglas [50] for the rate of sea level rise caused by the melting of glacier ice over the past 100 years. Therefore, the altimetry estimate of 2.8 mm yr−1 provides evidence for the accelerated warming of the ocean during the past decade.
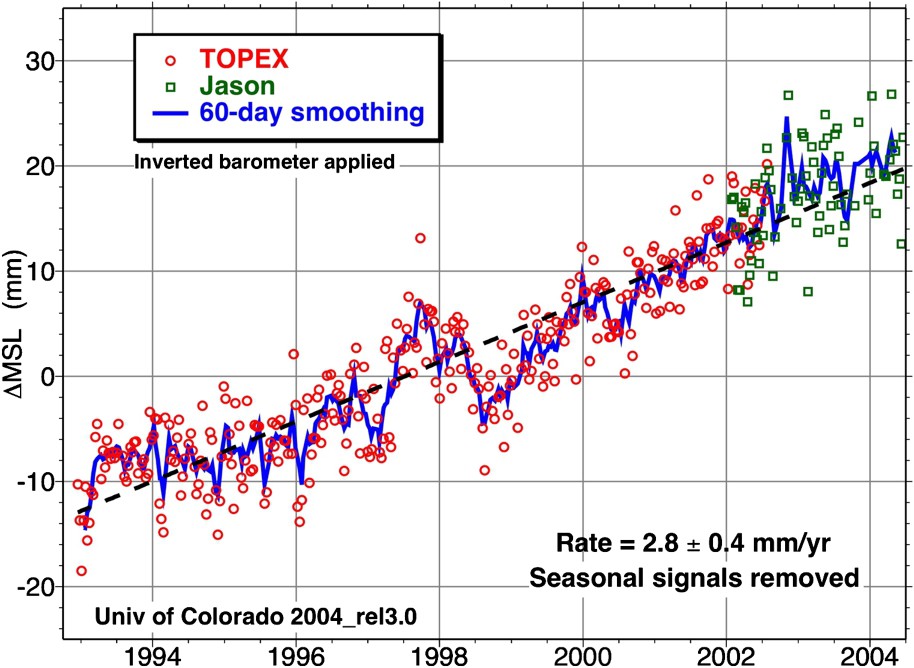
Globally averaged mean sea level calculated from the altimeter data from T/P and Jason (courtesy of S. Nerem of University of Colorado [46]).
Niveau moyen global déduit des données T/P et Jason [46].
The altimetry data also provide the first observation of the spatial variability of the low-frequency change of sea-surface height. Displayed in Fig. 4 is a global map of the trend of sea-surface height estimated from the combined data from T/P and Jason covering 1993–2004. Complex patterns of spatial variability are clearly shown. In the North Pacific, the pattern of variability is similar to that of the Pacific Decadal Oscillation (PDO [48]). Peterson and Schwing [58] presented evidence for a shift of climatic regime and ecosystem in the Northeast Pacific during the 1999–2003 time period. However, the data record is still too short to confirm the effects of the PDO whose time scales are in the order of 20 years. Some of the decadal changes are caused by wind-driven Rossby waves [24,62]. Based on modeling analysis constrained by the T/P data, Kim et al. [36] reported the importance of ocean current advection in the abrupt change of sea-surface temperature associated with the apparent PDO formation.
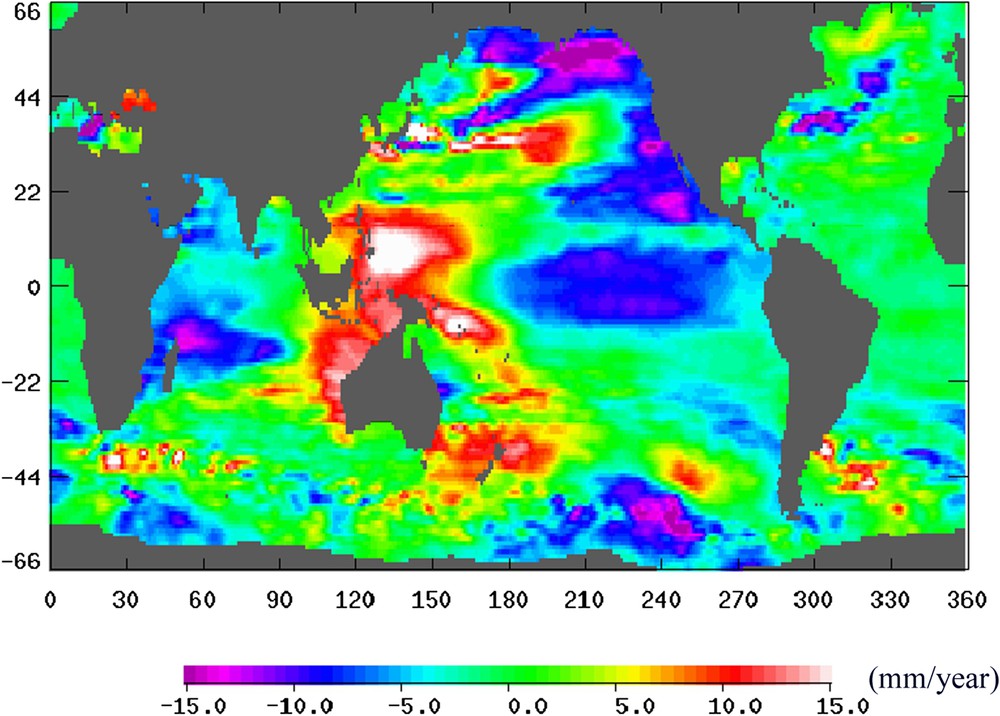
The trend of SSH variations during 1993–2004, computed from the combined data from T/P and Jason.
Pente des variations de la SSH sur la période 1993–2004, déduite des données combinées T/P et Jason.
The SLA trends in the North Atlantic were interpreted by Hakkinen and Rhines [30] as a slowdown of the circulation of the subpolar gyre of the North Atlantic Ocean. The subpolar sea-surface height increased during the 1990s, leading to a decrease of the cyclonic circulation around the subpolar gyre. Direct current-meter observations in the boundary current of the Labrador Sea reveal evidence for the weakening circulation trend of the 1990s. While a significant part of the North Atlantic sea-level interannual variability is related to the North Atlantic Oscillation (NAO) (e.g., [80]), they found that the gyre weakening in the 1990s is not attributable to local wind stress changes associated with NAO. This was shown by comparing the dynamic consequences of three mechanisms, buoyancy forcing and barotropic and baroclinic response to local wind stress curl. Their analysis of the local surface forcing suggests that the change in the buoyancy forcing plays an important role in weakening the meridional thermohaline circulation.
The reduced thermohaline circulation is expected to cause a decrease in the meridional heat transport of the North Atlantic Ocean. The variation of the heat transport is computed from the estimates of the velocity and temperature fields from a modeling analysis based on assimilation of satellite altimetry and in-situ data. This analysis system is called ECCO (Estimation of the Climate and Circulation of the Ocean [72]). Shown in Fig. 5 is the estimated meridional heat transport of the North Atlantic across different latitudes during the 1993–2003 time period, showing a decreasing trend superimposed by strong seasonal-to-interannual variability at all latitudes. The time scales of the variability vary from 4 yr in the subtropics to 6 yr at mid latitudes. The SSH patterns associated with the interannual variability of the North Atlantic were discussed by Fu [19], who drew attention to a possible connection between the subtropics and high latitude in the underlying processes governing the variability.
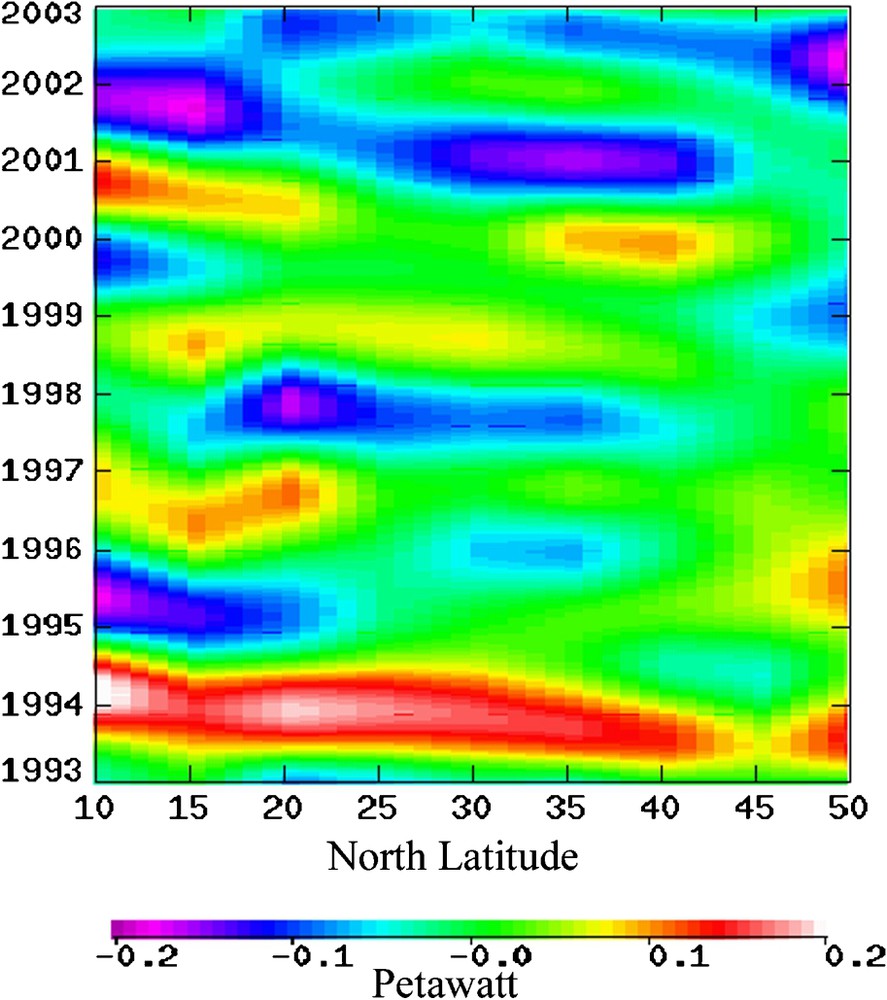
The meridional heat transport of the North Atlantic Ocean as a function of latitude and time.
Transport méridien de chaleur dans l'Atlantique nord en fonction de la latitude et du temps.
In the South Atlantic and South Pacific, the marked striations are roughly consistent with the characteristics of Rossby wave fronts, reflecting a possible role of Rossby waves in the decadal change of ocean circulation [62]. In the Southern Ocean, the spatial pattern shows the characteristics of a wavenumber-2 Antarctic Circumpolar Wave [81], with two minima centered at longitudes of 30°–60° and 210°–240°. These waves travel eastward around Antarctica in 8–9 years. Their long wave periods are responsible for their presence in the pattern of the estimated linear trends.
Lee [44] described the decadal change of the Indian Ocean in the 1990s using various satellite observations. As shown in Fig. 4, the decadal trend of SSH in the Indian Ocean suggests that there is a decrease in the northward geostrophic flow of the upper ocean. Lee [44] discussed this change in ocean circulation in the context of a decrease in the southeasterly trade wind based on scatterometer wind observations. The weakening trade wind leads to reduced southward surface wind-driven Ekman flow. The combined effects of the change in the Ekman flow and the returning geostrophic flow lead to reduced meridional overturning circulation of the southern Indian Ocean, which removes the heat stored in the equatorial Indian Ocean from solar heating. The reduction of heat removal from the equatorial Indian Ocean is partially responsible for the long-term warming of the Indian Ocean reported by Levitus et al. [47].
5 High-frequency and intraseasonal variability
Before the launch of precision altimeters like T/P, there were no observations adequate for sampling the spatial scales of high-frequency variability of the ocean. We do expect large spatial scales for high-frequency barotropic motions, but we do not expect substantial energy in the high-frequency, large-scale part of the spectrum of oceanic variability. When the first observations from T/P were analyzed, showing 10-cm change of sea level in the Southern Ocean over areas as large as Australia within a time span as short as 10 days, we were all much surprised. Fukumori et al. [28] have shown that about half of the variance of large-scale barotropic sea-level variability is contained at periods shorter than 20 days. Significant variance is found at periods even shorter than 12 h. Such a high-frequency energy creates aliasing effects on altimetry data, which are often sampled at intervals of 10 days and longer. Fortunately, the high-frequency variability of sea level is largely predictable by numerical models driven by good wind observations [2,21,71,77].
Fu and Smith [21] analyzed the large-scale variability in the period band of 20–100 days, the intraseasonal band, from satellite altimeter data and model simulations. They found that the intraseasonal variability outside the tropics is primarily found in four regions: the Argentine Basin of the South Atlantic, the central North Pacific, the Bellingshausen Basin of the Southeast Pacific, and the Australian–Antarctic Basin of the South Indian Ocean. Fu et al. [26] discovered a 25-day barotropic Rossby wave rapidly rotating around a seamount in the Argentine Basin. They showed that the wave was a natural mode of the basin, with its particular topography. The temporal and spatial characteristics of the wave were simulated successfully by a barotropic model. Additionally, there is significant energy at periods of 40–100 days in the form of westward-propagating barotropic Rossby waves in the Argentine Basin [20].
The intraseasonal sea-level variability of the other three regions was investigated by Fu [18]. A major finding is that the near closed contours of (H is the ocean depth; f is the Coriolis parameter defined as , where Ω is the Earth's rotational rate and φ is latitude) in these regions allow a simple balance between the forcing of wind stress curl and the change in relative vorticity at intraseasonal scales. Fu [18] was able to simulate the observed SSH fairly well using this simple balance. In the simulation the wind stress curl was obtained from the measurements made by the scatterometers from ERS-1 and -2. To investigate the dependence of the result on the quality of wind forcing, we also ran the same simulation using wind products from the NCEP reanalysis project. The coherence between the observations and the two simulations was computed for the Bellingshausen Basin (Fig. 6). To the extent of the linear response of SSH to wind stress curl, this result suggests that the ERS wind-stress curl is superior at time scales of 100 days. At time scales shorter than 50 days, the NCEP wind has better performance, indicating that the ERS wind is probably much too smoothed in time due to poor sampling. However, it is not clear why the NCEP wind has poor performance at time scales of about 100 days.
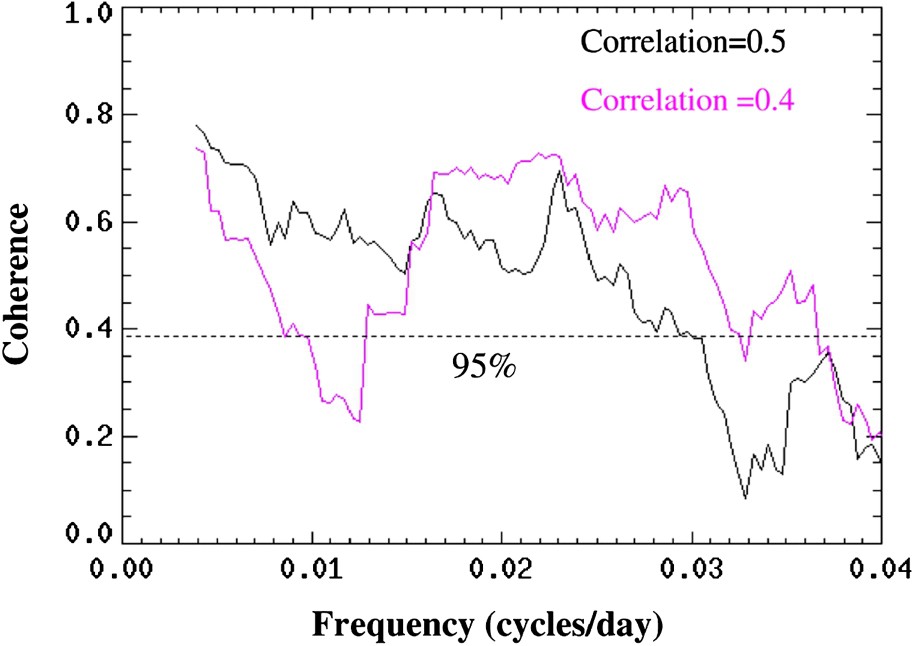
Coherence between observed SSH and simulations based on the ERS scatterometer wind observations (black) and the wind from the NCEP reanalysis (gray or purple in the on-line color version). The dashed line represents the level of non-zero coherence with 95% confidence. The correlation coefficients for the two cases are also shown in the panel.
Cohérence entre la SSH observée et les simulations basées sur les données de vent du diffusiomètre ERS (noir) et de la réanalyse NCEP (gris ou violet dans la version couleur en ligne). Les traits tirés représentent la limite de confiance à 95% d'une cohérence non nulle.
6 Rossby waves
Westward propagation is a ubiquitous feature in many observations of the ocean from space, in sea-surface height, sea-surface temperature, and ocean color [4,23]. At scales larger than the mesoscale (circa 500 km in wavelength), this phenomenon is governed by the dynamics of Rossby waves. A major discovery from satellite altimetry observations was the finding of a wave speed faster than the prediction from conventional theories [5], leading to numerous studies that have created revised theories to account for the new observations (see [23] for a review). At the mesoscale (50–500 km), the observed westward propagation is associated with a mixture of Rossby waves and eddies.
Cipolloni et al. [8] have analyzed signatures of Rossby waves in altimetry and ocean color. Killworth et al. [35] provide a summary of main mechanisms responsible for the relationship between ocean color and altimetry. They tested three possible mechanisms: horizontal north–south advection by the wave against a mean background gradient, vertical upwelling of nitrate, which is converted into chlorophyll and vertical upwelling of chlorophyll itself. They concluded that over most of the ocean, the chlorophyll signal is well explained by horizontal advective processes, although additional biological mechanisms may be responsible for part of the signal in specific regions. Dandonneau et al. [10] proposed another mechanism where ocean color anomalies are not caused by chlorophyll itself, but by floating particles accumulated at lateral convergence zones. This led to some controversy [11,33].
Shown in Fig. 7 is a wavenumber-frequency spectrum for the zonal SSH variability at 24°S in the Pacific Ocean (from [23]). Also shown are the dispersion relations of Rossby waves based on the conventional theory and the revised theory of Killworth et al. [34], who have taken into account the effects of the vertical shear of the mean flow on the propagation of Rossby waves. An interesting feature of the spectrum is that the bulk of the variance spreads along a relatively straight line across all frequencies without showing any effects of wave dispersion. However, the resolution of the observations does not allow the exploration of the spectral characteristics at wavelengths shorter than 500 km to determine whether this non-dispersive property would persist through shorter wavelengths.
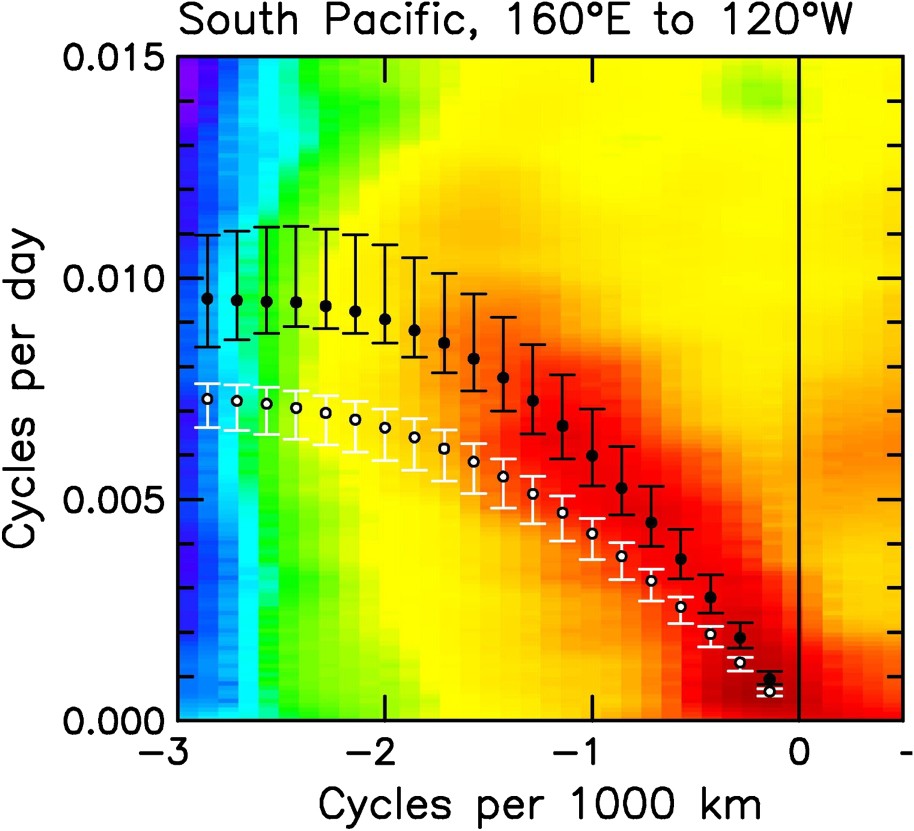
Frequency–wavenumber spectrum of SSH along 24°S from 160E–120W in the South Pacific. Also shown are the Rossby wave dispersion relation derived from the conventional theory (solid symbols) and the theory of Killworth et al. [34] (open symbols).
Spectre en fréquence et en nombre d'onde de la SSH le long de 24°S de 160E à 120W dans le Pacifique sud. La relation de dispersion des ondes de Rossby déduite la théorie conventionnelle (symboles pleins) et de la théorie de Killworth et al. [34] (symboles ouverts) est également montrée.
The global characteristics of westward propagation observed in SSH data were described in Fu [20]. The frequency of westward propagation is generally lower than the critical frequency of the first-mode baroclinic Rossby waves, as expected from the conventional theory of Rossby waves in a mid-latitude ocean. However, westward propagation with frequencies higher than twice the critical frequency is also observed at most latitudes. This super-critical propagation is attributed to the effects of the vertical shear of the mean flow at mid latitudes and by the effects of the equatorial wave guide at the tropical latitudes. Westward propagation with frequency much higher than the critical frequency (by a factor of 5–10) is also observed at certain latitudes in all oceans. The most energetic cases are found along the latitudes of strong zonal jets, including the Brazil/Malvinas Confluence, the Agulhas Return Current, and the Gulf Stream Extension, with decreasing variance in the order. The high-frequency westward propagation exhibits the frequency and wavenumber characteristics of barotropic Rossby waves (Fig. 8).
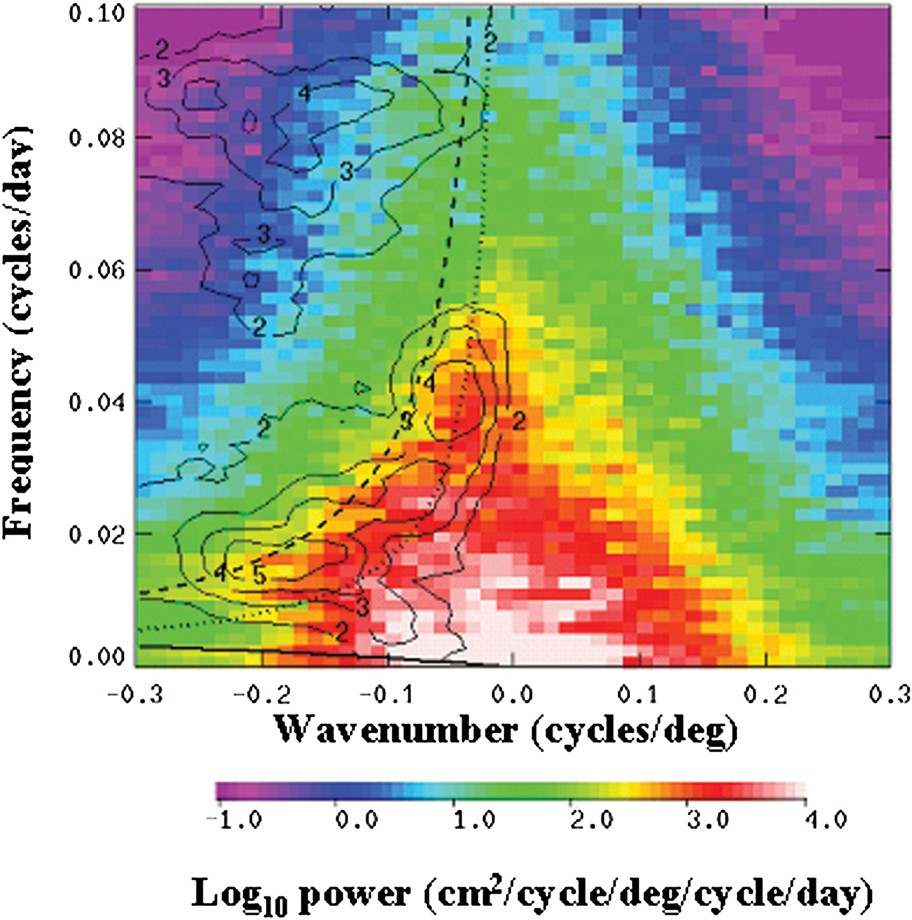
Wavenumber–frequency spectrum of SSH at 40°S in the South Atlantic Ocean. The contours show the ratio of the westward-propagating variance to the eastward-propagating variance. The bold solid line represents the dispersion relation of the first-mode baroclinic Rossby waves with zero meridional wavenumber. The dotted line represents the dispersion relation of barotropic Rossby waves with equal zonal and meridional wavenumbers. The bold dashed line represents the dispersion relation of barotropic Rossby waves with zero meridional wavenumber (from [20]).
Spectre en fréquence et en nombre d'onde de la SSH à 40°S dans l'Atlantique sud. Les contours montrent le rapport entre la variance des propagations vers l'ouest et la variance des propagations vers l'est. Le trait plein en gras est la relation de dispersion pour les ondes baroclines du premier mode, avec un nombre d'onde méridien de zéro. Les traits pointillés représentent la relation de dispersion des ondes de Rossby barotropes avec des nombres d'onde zonaux et méridiens identiques. Les traits tirés en gras représentent la relation de dispersion des ondes de Rossby barotropes avec un nombre d'onde méridien de zéro (d'après [20]).
7 Mesoscale variability
Mesoscale variability can be observed almost anywhere, the eddy energy generally exceeding the energy of the mean flow by an order of magnitude or more. Resolving mesoscale variability is essential to correctly simulating the dynamics of ocean circulation and the associated heat transport, even at large and climatic scales (e.g., [67,84,85]). Over the past 20 years, satellite altimetry has provided a unique contribution to the global observation of eddy variability (see [39] for a review).
Most mesoscale studies are now taking advantage of the improved resolution derived from the SSALTO/DUACS merged T/P (resp. Jason-1) and ERS (resp. ENVISAT) datasets (e.g., [14,15]). This is illustrated hereafter with different studies dealing with the comparison with eddy resolving models, the testing of turbulence theories, the relationships between sea level and wind stress curl and the tracking of individual eddies. All these studies provide new insights into eddy dynamics and their roles in the ocean circulation, heat and salt transport, and the possible coupling with the atmosphere.
Brachet et al. [1] showed the high level of agreement between POP North Atlantic model [70] and altimeter observations. The spatial scales match accurately. Propagation velocities are also in close agreement; eddies were shown to propagate faster than mesoscale Rossby waves by a factor of 1.5 to 2. The effect of mean flow advection (e.g., Gulf Stream, Labrador Current) was clearly seen in both models and altimeter data. The role of large scale circulation on eddy propagation was also well demonstrated in the study by Isoguchi and Kawamura [32]. Using merged T/P and ERS datasets, eddies along the western boundary region of the Subarctic North Pacific were shown to be advected by the time-dependent Sverdrup wind-driven current. Brachet et al. [1] also analyzed the temporal evolution of the monthly EKE over an 8-year period (from December 1992 to December 2000) and the relationship with the wind stress in several selected regions. Their results follow previous studies (see [39]) that link seasonal EKE variations at high latitudes to seasonal wind stress variations, although the question is still widely open, as discussed by Eden and Böning [16]. A clear EKE interannual variability was also discovered. They hypothesized that a contraction of the subpolar and subtropical gyres due to the North Atlantic Oscillation (NAO) (see discussion in previous sections) could explain a reduction of the eddy activity in the North Atlantic Current, in the Newfoundland basin and in the Azores Current. Penduff et al. [57] also found that strong NAO events after 1994 were followed by gyre-scale EKE fluctuations with a 4–12-month lag, suggesting complex and nonlinear adjustment processes.
Merged T/P and ERS data sets have also allowed a better investigation of EKE seasonal variations (see [39] for a review). Qui and Chen [63] recently detected high EKE bands in the South Pacific with well-defined annual cycles along the eastward-flowing surface currents of the South Tropical Countercurrent (STCC) between 21°–29°S and the South Equatorial Countercurrent (SECC) centered near 9°S. The seasonal variation in the intensity of baroclinic instability was found to be responsible for the seasonal modulation of the STCC's EKE field, while the seasonal variation in the intensity of barotropic instability associated with the horizontal shear of the SECC–SEC system could explain the seasonal modulation of the SECC's EKE field.
In two-dimensional turbulence on a β-plane, a long-term free evolution of an eddy field should result in the formation of alternating zonal jets. Using T/P and ERS merged datasets, Maximenko et al. [49] have shown that jet-like structures are seen in the anomalies of geostrophic velocity and, especially, geostrophic vorticity, in every part of the global ocean. This is a remarkable result that calls for further studies.
White and Annis [82] have found very interesting relationships between the sea level from merged T/P and ERS datasets, AVHRR sea-surface temperature (SST) and wind stress curl derived from the QuickScat scatterometer. In all western boundary currents and in the ACC, the SST signals associated with mesoscale eddies alter the surface stress and create wind-stress curl of eddy scale that is capable of modifying the eddy dynamics. Chelton et al. [7] also pointed out the importance of mesoscale SST signals in the wind-stress curl derived from QuickScat.
Fang et al. [17] analyzed the pathways of anticyclonic warm-core eddies from 1995 to 2000 in the South Indian Ocean. They found long-lived warm-core eddies that could be tracked for periods longer than six months and propagation distance larger than 1500 km. Eddies were steered by bathymetry into three main corridors. Eddy radius and propagation speeds decrease with decay over the first three months, then a slower evolution of the eddy characteristics over time is observed. These eddy characteristics bear some resemblance to the Agulhas rings that have been extensively studied using altimetry (see [39]). An estimate of the associated annual eddy heat and salt fluxes led to 0.013 PW and respectively, moving towards the west-northwest (WNW). The magnitude of these southeast Indian Ocean eddy heat fluxes is 3–10% of the net heat loss to the atmosphere in the subtropical gyre. This can be compared to the eddy heat and salt fluxes entering the South Atlantic through the Agulhas eddies that contribute 0.045 PW and , respectively [79]. Qiu and Chen [64] showed an interesting estimation of basin-scale heat transport induced by mesoscale oceanic eddies by combining high-resolution altimeter and sea-surface temperature maps with Argo float temperature and salinity data.
De Ruijter et al. [12] analyzed eddies and dipoles south of Madagascar. They observed the regular formation of dipoles around South Madagascar, where the East Madagascar Current (EMC) separates from the shelf. Between April 1995 and June 2000, 16 such features could be identified, six of which were formed between August 1996 and May 1997 and six between May 1999 and June 2000. These periods of enhanced dipole formation coincided with the negative phases of the Indian Ocean Dipole and the El Niño cycles, suggesting a connection between these climate modes and the interannual variability in the periods of the dipole train formation. A very regular train of dipoles started in December 1999 and continued through 2000. They stayed remarkably coherent and triggered an unusually early retroflection of the Agulhas Current in late 2000. Thus, interannual variability originating in the equatorial climate modes of the Indian Ocean seems to result in variability of the Agulhas retroflection and associated ring shedding.
In three southern hemisphere case studies, Morrow et al. [52] found divergent pathways of cyclonic and anti-cyclonic ocean eddies (Fig. 9). Away from bathymetry or strong background mean flow, warm-core eddies tend to propagate WNW (or westward and equatorward) and cold-core eddies tend to propagate WSW (or westward and poleward). The clearest example is the South Indian Ocean, where the background mean flow is weak and there is little topographic effect. The tendency of large cyclonic (resp. anticyclonic) eddies for moving poleward (resp. equatorward) probably results from the β-effect and the conservation of potential vorticity. Another interesting way to characterize the occurrence of cyclonic and anticyclonic eddies is to analyze the skewness of the relative vorticity [55] or of the sea level itself [76].
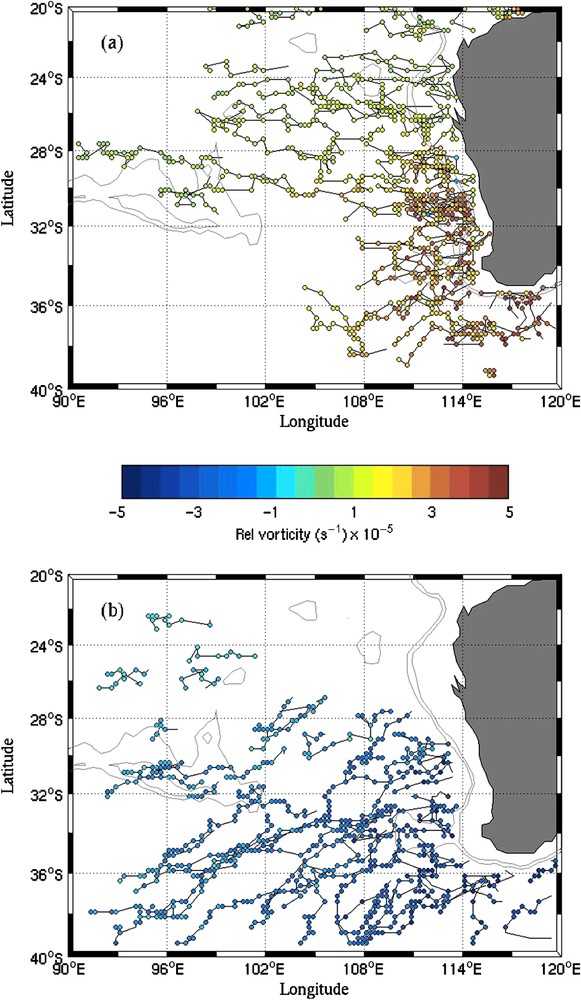
Anticyclonic and cyclonic eddy trajectories in the South East Indian ocean offshore of the Leeuwin current. The 1000- and 3000-m bathymetric contours are in gray. T/P and ERS merged product from SSALTO/DUACS over the time period 1996–2000 were used (courtesy of R. Morrow from LEGOS; see [52]).
Trajectoires des tourbillons anticycloniques et cycloniques dans le Sud-Est de l'océan Indien au large du courant de Leeuwin. Les isobathes de 1000 et de 3000 m sont en gris. Le produit combiné T/P et ERS de SSALTO/DUACS sur la période 1996–2000 a été utilisé.
Although the T/P + ERS merged data have provided a much better representation of the mesoscale variability, it is far from fully resolving the mesoscale variability (see discussions in references [29,73]). To improve further our understanding of mesoscale variability, we now need to observe it at higher space and time resolution. The interleaved tandem T/P – Jason-1 mission was proposed with this idea in mind [27,41]. Since mid-September 2002, TOPEX/Poseidon has been flying mid-way between two adjacent Jason-1 ground-tracks. The past two years have thus seen an exceptional sampling of the ocean with four altimeter missions flying simultaneously – Jason-1, ERS-2, T/P interleaved with Jason-1 and Geosat Follow-On (GFO). These datasets were merged to improve the estimation of mesoscale surface circulation in the Mediterranean Sea by Pascual et al. [56]. Mean eddy kinetic energy (EKE) was computed from the different altimeter configurations (Fig. 10). It showed that the combination of Jason-1 + ERS-2 fails to reproduce some intense signals. When T/P is added, however, these features are well recovered and the EKE does not show significant discontinuities due to sampling effects. On average, the merged Jason-1 + ERS-2 + T/P + GFO maps yield EKE levels 15% higher than Jason-1 + ERS-2. The consistency between altimetry and sea-surface temperature, drifting buoys and tide gauges, is also significantly improved when four satellites are merged compared to the results derived from the two-satellite configuration. This study demonstrated that, at least three, but preferably four, altimeter missions are needed for monitoring the Mediterranean mesoscale circulation.
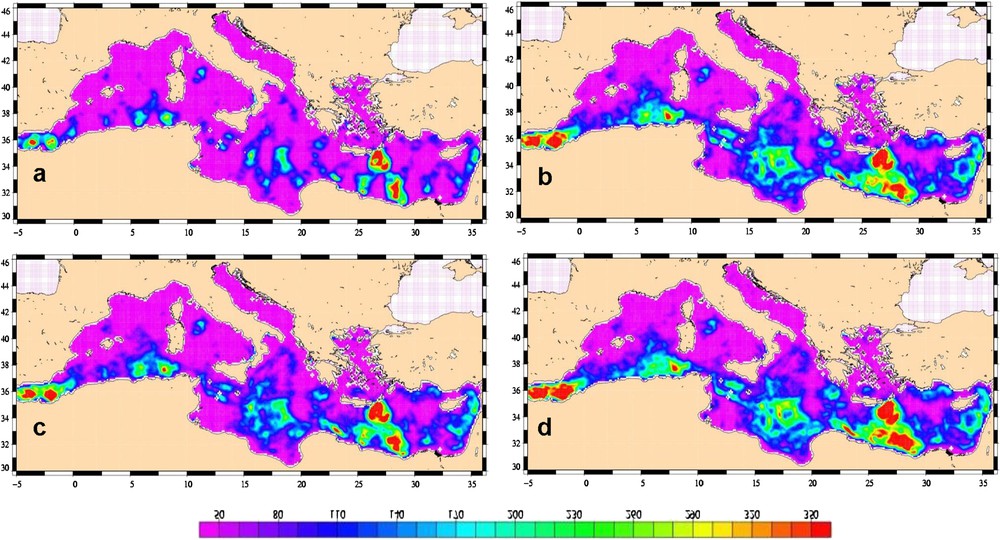
Mean EKE in the Mediterranean Sea over the period October 2002–October 2004 for different satellite configurations: (a) Jason-1, (b) Jason-1 + ERS-2/ENVISAT, (c) Jason-1 + ERS-2/ENVISAT + T/P, (d) Jason-1 + ERS-2/ENVISAT + T/P + GFO. Units are cm2 s−2 (courtesy of A. Pascual from CLS Space Oceanography Division; see [56]).
EKE moyenne en Méditerranée sur la période octobre 2002–octobre 2004 pour différentes configurations satellites : (a) Jason-1, (b) Jason-1 + ERS-2/ENVISAT, (c) Jason-1 + ERS-2/ENVISAT + T/P, (d) Jason-1 + ERS-2/ENVISAT + T/P + GFO. Les unités sont des cm2 s−2.
8 Conclusions and perspectives
As illustrated in this paper, satellite altimetry has made a unique contribution to observing and understanding ocean circulation both at the large and climatic scales and at the mesoscale. It also provides a strong constraint for the 4D ocean circulation estimation through data assimilation. This unique capability is of utmost importance for the development of operational oceanography services (e.g., safe and efficient offshore activities, pollution monitoring, environmental management, security and sustainable use of marine resources) and for ocean, ecosystem and climate research (e.g., [75]). Altimeter data are now routinely assimilated together with in-situ data (e.g., the Argo array [68]) in global and regional numerical models to provide regular description and forecast of the ocean state at high space and time resolution.
The critical issue is now to ensure a long-term commitment for operational ocean altimeter missions. This means first to continue the Jason series (after Jason-2) to provide a long-term and precise altimeter system. One should also fly a post-ENVISAT altimeter mission as early as possible. In the longer run, an operational high-resolution altimeter system is needed both for research and operational applications (e.g., marine security and pollution monitoring, which require high-resolution surface currents). The Gamble study [9] recommends a high-resolution altimeter system consisting in a constellation of three optimized altimeters in addition to the Jason series. Swath altimetry (e.g., WSOA) is also a very attractive possibility [25]. It has the potential to sample the mesoscale variability better than 4 to 5 coordinated conventional altimeters. WSOA was unfortunately cancelled for flight on OSTM/Jason-2. A demonstration of its capabilities is now urgently required.
Acknowledgements
Part of the research presented in the paper (by L.-L. Fu) was carried out at the Jet Propulsion Laboratory, California Institute of Technology, under contract with the National Aeronautic and Space Administration. Support from the TOPEX/Poseidon and Jason Projects is acknowledged. P.Y. Part of P.Y. Le Traon research was carried out at the CLS Space Oceanography Division as a contribution to the European Commission MERSEA project.