

1 Earth observation spectrometry
The concept of imaging spectrometry, i.e. the acquisition of reflectance signatures in numerous narrow and contiguous spectral bands [22,23], has already provided the science community with a range of powerful, yet largely experimental airborne sensor systems such as AVIRIS and HyMap (e.g., [14,25]). Its particular strength is based on the fact that many of the Earth's materials exhibit significant spectral absorption features in the visible and near-infrared (VNIR) and short-wave infrared (SWIR) regions (Fig. 1), which serve as diagnostic indicators.
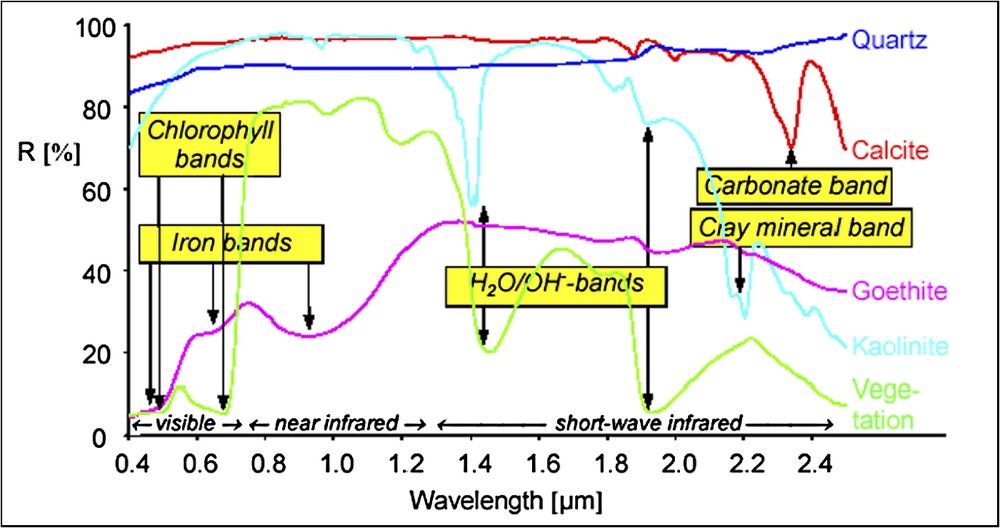
Diagnostic absorption features in the VNIR and SWIR wavelength ranges.
Absorptions caractéristiques dans les domaines du visible et le proche infrarouge.
Spectral features of rocks and soils originate from electronic and vibrational transitions that characterise the specific minerals that are contained. The location of features at definite wavelengths derives from the characteristics of the crystal lattice, such as coordination number, nature of ligands and nature of the central ion. Coordination number and ligands define the electric field exerted on the central ion and, thereby, the order of magnitude of electronic or vibrational processes [31–33]. Mineral identification according to spectral absorption features is feasible for minerals containing molecules or anions like H2O, OH−, , or CH. This encompasses the phyllosilicates, most sorosilicates, the hydroxides, some sulphates, the amphiboles and the carbonates. Electronic features are caused mainly by charge-transfer bands and crystal-field transitions of iron in the bi- and trivalent state. The dominance of the ferrous and ferric ion in the spectral range between 400 and about 1000–1300 nm is due to their large distribution on the Earth's surface, with the frequent occurrence of silicates, and their ability to replace many other ions (e.g., Mg2+, Al3+, Si4+, and Mn2+) in various minerals. Absorption features due to vibrational transitions are located between 1300 and 2500 nm, and are caused by overtones and combination tones originating from the fundamental modes in various multiplicities. These features arise from molecule vibrations or vibrations of atomic groups, which form independent oscillatory units within the molecules. Widely spread oscillatory units in naturally occurring minerals are Al–OH, Mg–OH and CO. Minerals containing one of these groups show characteristic frequencies within narrow wavelength ranges around 2200 nm (Al–OH) and 2300 nm (Mg–OH/CO). The exact position of the frequency is determined by the neighbouring molecules or parts of them. Diagnostic absorptions also result from other processes. For example, rare earth ions involve deep-lying electrons and are not diagnostic of the mineralogy, but of the ions in the mineral, and, thus, specific rare-earth elements are detectable within this spectral range [12]. These absorption mechanisms also constitute the basis for the characterisation of surface properties in drylands through the improved detection capabilities of a hyperspectral image.
Apart from the soils of steppe areas, with their particularly high amount of organic carbon, soil formation tends to decrease rapidly with increasing aridity, since chemical weathering becomes less important than in humid regions. This is due to the almost continuous shortage of water. Soils in semi-arid regions often have very little organic material and, therefore, almost exclusively consist of rock and mineral particles. The importance of leaching processes (i.e. transport of soluble salts, carbonates, Fe- and Al-oxides, fulvic acids and clay minerals) is also reduced and, under increasing aridity, replaced by the movement of free carbonates and salts with ascending water (capillary rise). Thus, arid soils are characterised by relatively high concentrations of carbonates, soluble salts and, depending on the parent substrate, SiO2-rich components in the upper soil horizons. These form frequently hard crusts (i.e. calcrete, silicrete) close to the surface, which considerably influence infiltration capacity, the soil water budget, and also the spectral properties of the surface. Microphytic communities also tend to produce coatings on rock and soil surfaces in arid and semi-arid areas [50]. The mineral grains of soils are then held together by a fibrous mat of cyanobacteria and other biological elements (e.g., [5]). These biologic crusts may considerably modify runoff and infiltration characteristics of the parent substrate [51] and contribute to the stabilisation of surfaces [16].
The reflected solar radiation covering the wavelength region from about 400 to 2500 nm is also excellent for detecting vegetation species, vegetation health, and green-leaf water content. The visual portion of the spectrum is characterised by strong pigment absorptions such as chlorophyll in the 630–690 nm region and by chlorophyll/carotenoid in the blue range. The near infrared (NIR) is marked by a steep increase of reflectance that can be related to biomass, state and type of cellular arrangement, density, geometry and water content. A shift of this ‘red edge’ to shorter wavelengths is related to chlorophyll decrease, which can in turn be an indication of heavy metal or water stress. Biochemical contents of leaves and canopies, including nitrogen-containing compounds and lignin, absorb radiation at fundamental stretching frequencies, generally in the NIR and SWIR regions. The absorption bands in this wavelength region mainly originate as harmonics and overtones of the fundamental stretching frequencies of CH, OH, and NH bonds together with various combination bands [26]. Absorptions due to leaf liquid water are caused by the OH bonds of water.
In arid regions, the plant cover usually consists of perennial plants (which are neither abundant nor very dense) and some short-lived (i.e. annual) herbaceous vegetation (which only appears for some weeks after the rainy periods). However, the spectral response of perennials in dry ecosystems is quite different from the typical reflectance of green plants due to their morphological and structural adaptations. Because water and chlorophyll pigment contents of green leaves are rather low and the dominant part of perennial desert plants are woody components, strong spectral features of photosynthetic plants are much less developed than in plants from more humid regions. For example, this is true for the chlorophyll absorption around 450 and 670 nm, the steep spectral transition of the red edge between 650 and 750 nm, and the liquid water absorption around 975 and 1180 nm. Therefore, the spectral response of vegetation in arid areas depends mainly on the proportions of green to dry and woody parts, respectively. An additional complication is introduced through the fact that dry and woody plant material does not exhibit a unique, but highly variable spectral response, depending mainly on the level of plant decomposition (e.g., [2,20]). Additionally, atmospheric gases, such as oxygen, water vapour, carbon dioxide and methane produce specific absorption features in the VNIR/SWIR regions [22].
The progress achieved in particular in the field of mapping and applied geology applications by means of imaging spectroscopy (e.g., [9,11,35,46,48,49]) have resulted in the development of advanced processing tools and methodologies for deconvolving complex spectral signatures and extracting the thematic information at the subpixel scale (e.g., [1,43,47]). Schematically, these methods include spectral unmixing (linear [3,4] and non-linear (e.g., Modified Gaussian Model [45]), neural networks and Expert systems (e.g., Tetracorder [13], see also [49]).
2 Arid environments and dryland ecosystems/vegetation and soils indicators
Arid and semi-arid lands cover approximately one third of the continental surface of the Earth [38]. About two thirds of these areas are located in warm climates between 15 and 35 °C in both hemispheres, and thus belong to the deserts and semi-deserts of tropical and subtropical regions, respectively.
Primarily because of the harsh climatic conditions, drylands are, and always have been extremely sensitive to inappropriate human actions leading to degradation processes. The term “land degradation” is generally used to refer to the loss of valuable land through various processes such as soil erosion, salinisation, depletion of nutrients, deterioration of soil structure and subsequent erosion processes. Desertification may then be conceived as a severe stage of land degradation, in which disturbances have gone beyond the resilience of the land. Although desertification could in the past be attributed to climatological effects, there is little doubt today that desertification is mainly a man-made or man-induced phenomenon developing under the climatic conditions of aridity, leading to varying degrees of vegetation and soil deterioration (e.g., [37]). Both the intensification and extensification of land use can cause degradation depending on the environmental setting.
The extent and spatial distribution of drylands is roughly known at a global scale. However, the knowledge on the current land degradation status or the magnitude of the potential hazard is for the most part incomplete and fragmented, or may even be entirely lacking [8]. This makes it extremely difficult to design and implement mitigation, reclamation and prevention measures. The productivity of dryland systems largely depends on surface properties, which, as they control water availability, the spontaneous emergence and development of new plants and dust production during wind storms, frequently dominate climatic variables (e.g., [30]). It emerges from this conceptual framework that surface properties are considered more indicative than long-term climatic conditions. The ability to draw concise conclusions with respect to land resources and environmental change thus clearly depends on the capability to assess these specific surface characteristics (i.e., vegetation cover and composition, properties of parent material and soils, including effects of mineralogical and biologic crusting).
The high spectral contrast of vegetation relative to soils has provided many successful studies, which use optical remote sensing systems for observing vegetation communities (e.g., [39]). Since plants have distinct spectral signatures with low reflectance in the visible part of the spectrum and high reflectance in the near-infrared region, attempts have been made to use this spectral feature for the estimation of green vegetation cover and biomass (e.g., [40]). It is obvious that sensor systems involving spectral bands in the SWIR region provide much better information to separate green and dry vegetation components. Given the availability of high spectral resolution images, such methodologies like the spectral mixture analysis (SMA), also known as spectral unmixing, have been successfully used for a wide range of related applications (e.g., [3,4,27,36,41,42,44], (ISMA: Iterative Spectral Mixture Analysis) [10]). Because of its direct response to pre-selected component spectra (i.e. typical desert shrubs and appropriate substrate elements) and increased robustness against soil colour differences in the absence of dense vegetation, the method is particularly suited to overcome the limitations of two-band vegetation indices. Consequently, improved estimates can be expected for vegetation abundance in areas with sparse cover of mainly woody plants.
Besides the use of classical indicator variables (LAI (Leaf Area Index), biomass, proportional cover) that can currently be derived from operational Earth observation satellites through empirical and semi-empirical approaches; methods based on the inversion of analytical reflectance models are also explored (e.g., [34]). To invert the reflectance model (i.e. the retrieval of the actual canopy parameters from the hyperspectral satellite measurement), artificial neural networks could be trained to relate suitable combinations of LAI, leaf water content and chlorophyll concentration non-linearly to the spectral canopy reflectance.
Not all studies of dryland ecosystems have relied solely on vegetation cover as an indicator of land suitability or degradation. Escadafal et al. and Hill et al. [21,27], for example, have been able to use parameters indicative of soil conditions and, hence, to apply concepts taken from pedology and geomorphology to obtain qualitative indications for soil degradation or erosion processes. It should be emphasised that soil texture appears to be the key factor for the water balance of arid soils, as it controls infiltration and the capillary rise of water. In fine-textured soils, rainfall can hardly infiltrate and is therefore subject to evaporative losses. More coarsely textured soils (e.g., sandy or stony substrates) permit water to rapidly infiltrate to greater depths where it is well protected against evaporation after the topsoil layer dries out. In addition, almost all infiltrated water is readily available to plants, and salt concentrations in the soil remain low due to the higher leaching efficiency. Relationships between climate and environmental conditions, which are valid at a global scale, thus become problematic when local factors such as topography, lithology and soils determine the redistribution of water [52]. It is therefore mandatory that remote sensing focuses on the precise characterisation of surface physical properties [15,17,18], a perspective which becomes particularly promising using hyperspectral images. Spectral mixture analysis further allows the estimation of relative amounts of rock fragments and soil particles on the surface. Since soil erosion leads to an increase in rock cover in source areas and the accumulation of soil material as colluvium elsewhere, rock content can be used as an indicator of degradation. This corresponds to defining the erosional state of soils as a function of the mixing ratio between developed soil substrates and parent material components. Of course, these must be spectrally distinct in order to be discriminated from each other. As an example, Hill et al. [27] have successfully used this approach to map areas affected by soil degradation and erosion under sub-humid conditions in Mediterranean France. Hill et al. [29] have also demonstrated that spectral unmixing of reflectance signatures permits the successful identification and spatial differentiation of soil substrates and biological crusts in sandy arid ecosystems. More recently, Ben-Dor and Banin [6,7] used the full reflective spectrum to predict soil organic matter and other mineralogical and chemical soil properties based on multivariate statistics. A successful method has been proposed by [30] to retrieve organic carbon in xenomorphic soils, which highlights areas of accumulation and relative stability (sediment sinks). These approaches can already be applied to high-resolution laboratory spectra and real images, provided the latter have been adequately corrected for atmospheric effects. They strongly support the assumption that hyperspectral images can be successfully used to derive more specific soil properties (i.e. soil depth, chemical properties, infiltration capacity, runoff coefficient, etc.). This can be achieved either directly or through indirect relationships to be exploited through the use of pedo-transfer functions.
3 Hyperspectral spaceborne observation for a quantitative monitoring of land degradation and desertification
Many indices have been proposed to describe the susceptibility of drylands to desertification and land-degradation processes. Most of these indices are only minor modifications of climatic indices describing the degree of aridity, which, although implicitly related to other key variables such as the fractional vegetation, are not useful indicators for degradation processes. The crucial issue for global environmental assessment and monitoring strategies is the ability to identify, understand and map degradation processes under a wide range of environmental conditions. Ground-based methods are generally time-consuming and lack the degree of standardisation that would render them sufficiently reproducible, transferable, up-to-date and cost-effective to cover large areas (e.g., [8,28]). While standard methods for undertaking such measurements are imperfect and require heavy costs, satellite remote sensing, based on spaceborne hyperspectral imaging systems, offers considerable advantages. With a comprehensive spatial coverage, it is intrinsically synoptic, and provides objective, repetitive data with a continuous spectral coverage that is ideally suited for resource assessments and monitoring of environmental conditions in drylands. Repeated resource assessments and degradation monitoring in environmentally sensitive areas, coupled with GIS-based ecological model simulations, may provide the key to modify and adapt environmental management principles and mitigation strategies in response to present and expected environmental changes in drylands [24].
Indeed, hyperspectral imaging observation through time at a spatial scale on the order of classical Earth observation systems such as Landsat and SPOT would permit the retrieval of the quantitative biogeochemical/biogeophysical parameters that are to be incorporated into erosion and dryland degradation models to (a) monitor land-degradation processes, (b) assess land-degradation status, and (c) gain indicators for characterising specific surface properties related to water cycles, erosion processes, and plant productivity in drylands. In order to make efficient use of the hyperspectral information for measuring vegetation density, biodiversity, geochemistry, soil properties and other subsequent parameters relevant to erosion and land degradation status, it is necessary to assimilate the extracted quantitative parameters into the models. Remote sensing-based methods are especially suited for the detection of change, but need to be further optimised for detecting specific object properties within changing natural contexts. While it has been shown that hyperspectral imagery is able to provide better and more detailed information on proportional vegetation cover (including its dry/senescent components) than broad-band images [19], a further advantage lies in the fact that high spectral resolution imaging sensors also deliver spectral information on surface properties. This can be translated into specific parameters describing substrate characteristics required for pre-stratification strategies (e.g., lithology of parent material, runoff coefficient), or collateral model improvements (infiltration capacity, mineral and biogenic crusting, organic matter concentration, carbonate and iron content), or can be combined with models describing the erosional processes frequently involved in land degradation dynamics.
The spectral molecular absorption and scattering properties of materials form the basis of the identification and determination of the abundances of surface and atmospheric constituents in spectrometry. Considerable efforts have been taken to build hyperspectral imaging systems, which are able to observe the Earth from space. However, the existing systems (Fig. 2), such as Hyperion (part of NASA's EO-1 platform), and MERIS on board the ENVISAT platform (ESA), still collect data in a somewhat limited fashion in terms of radiometric and/or spectral performance, swath width, and revisit time (Hyperion) as well as spectral range with rather moderate spatial detail (MERIS). A spaceborne hyperspectral imaging system such as the envisioned EnMAP one (Environmental Mapping and Environmental Program) (Fig. 2), with its improved analytical capacity vis-à-vis lithological, soil and dry plant properties, could contribute substantially, with the support of the science community in promoting its Earth observation capabilities, to solve a number of environmental issues. The implementation of such a dedicated system in space is further justified through the success of long-term retrospective monitoring studies, the need to derive qualitative and quantitative indicators of surface properties [8,29], and the necessity to foster integrated approaches, which link surface process models with quantitative approaches in the analysis of remotely sensed data.
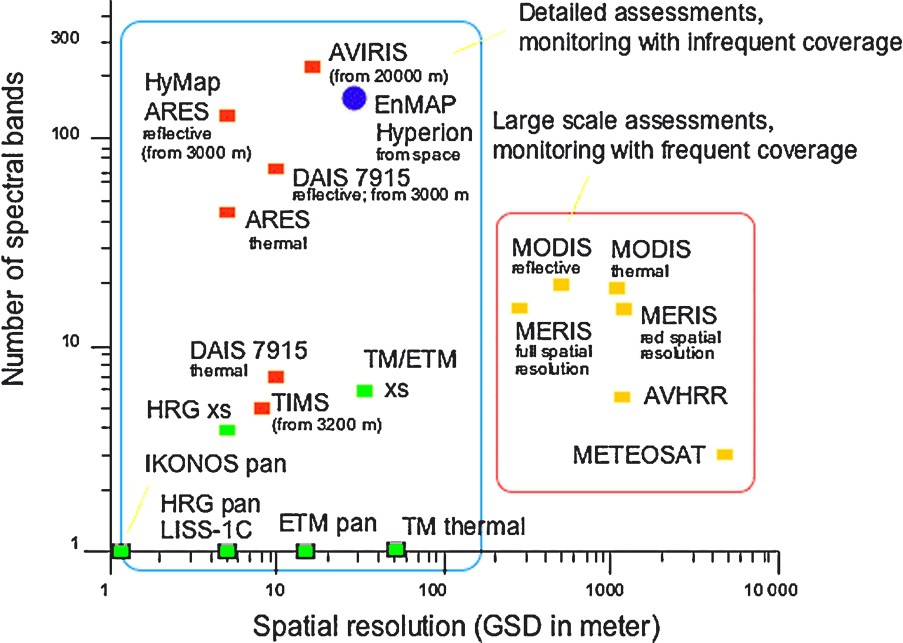
Remote sensing systems in a two-dimensional parameter space determined by spectral and spatial resolution.
Caractéristiques des instruments de télédétection optique dans un diagramme : nombre de bandes spectrales en fonction de la résolution spatiale.