

1 Introduction
Changes in land use and in the chemical composition of both the atmosphere (increased CO2 and O3 concentrations) and precipitation (increased nitrogen concentrations) during the last century have directly affected biogeochemical cycling of vegetation and soils. Increased atmospheric CO2 levels and changing land-use patterns, such as conversion of land to agriculture, have also indirectly affected the biota through changes in climate. Besides positive CO2 and nitrogen fertilization effects and direct consequences of land-use change, air pollutants have had a significantly negative effect on vegetation productivity and crop yield since the latter half of the 20th century. Over 90% of vegetation damage may be the result of tropospheric ozone alone [1]. In this article, we provide reviews of (a) ozone formation and related air-quality issues, (b) ozone affects on plants, (c) modeling studies that explore the effects of ozone on vegetation, (d) regional-scale consequences of ozone and nitrogen deposition on vegetation and crop responses using biogeochemical and atmospheric chemistry models, and (f) future consequences of ozone on crop yield, carbon storage and the economy.
2 Ozone formation and air-quality issues
Tropospheric ozone production is the result of photochemical reactions of carbon monoxide (CO), methane (CH4), and other hydrocarbons in the presence of NOx (NO + NO2). Net reactions include [91]:
| (1) |
| (2) |
| (3) |
Ozone production occurs during times of high temperature and solar radiation, such as during stagnant high pressure systems in summer [58]. Whereas natural ozone production is expected to reach a maximum in early spring [94], current maxima often occur during summer due to increased NOx and VOC emissions [58]. Industrial continental regions tend to have maximum ozone values in the late afternoon and minimum values in the early morning hours. In contrast, marine and high latitude sites have maximum ozone values before sunrise and lowest values in the afternoon due to low NOx concentrations and therefore low ozone production and strong ozone destruction [71]. Background ozone levels in unpolluted air can be anywhere from 20–50 ppb [92], though Lefohn et al. [47] argued for occasional background levels over 60 ppb resulting from stratospheric input. Polluted regions can have ozone levels peaking as high as 400 ppb [92].
Nitrogen deposition (NOy + NHx) resulting from nitrogen oxides emitted during fuel combustion and ammonia volatized from agricultural processes have increased the inputs of nitrate (NO3) and ammonium (NH4) to forest ecosystems [62,68]. NOy is NOx plus the compounds produced from the oxidation of NOx, such as nitric acid (HNO3) and peroxyacetyl nitrate (PAN). The NOx responsible for over half the total N-deposition [63] is also responsible for the formation of ozone. There is only a small coupling between ozone and NHx, due to the gas-phase oxidation of NH3 by OH, which represents only about 5% of the total loss of NHx (D. Lucas, personal communication). While a primary effect of NOx is to increase soil fertility, it also has negative effects on vegetation due to acid rain and loss of stomatal control by direct absorption into leaves [55,100]. In an experiment on crops, Runeckles and Palmer [86] found that daily treatments of O3 following NO2 resulted in larger growth inhibitions than ozone alone for radish and wheat, yet the reverse effect for bush bean. In all cases, NO2 alone increased growth.
3 Effects of ozone on vegetation
The effects of ozone on vegetation have been studied in both the laboratory and in field experiments, using controlled greenhouses or growth chambers, open-top chambers (OTCs), or field plots [42]. We focus on trees and crops because most studies have involved these growth forms [52]. The majority of experiments have applied ozone to seedlings in growth chambers (e.g., [51,80,108]). The most recent results come from Free Air CO2 Enrichment (FACE) experiments that show the interaction of elevated ozone and CO2 [46,49,50]. We review visible injury to plants exposed to ozone, the physiological effects of ozone on vegetation, growth responses of plants, mechanisms of ozone response, and the interaction of ozone and CO2. To the extent ozone reduces growth, it affects the amount of carbon in vegetation and soils, and the harvestable portions of crops. The review is summarized in Table 1.
Summary of ecosystem-level ozone effects. Arrows indicate that ozone exposure increases (up) or decreases (down) the variable. Dark arrows indicate agreement among a wide range of studies, while clear arrows indicate less certain results
Tableau 1 Récapitulatif des effets de l’ozone au niveau de l’écosystème. Les flèches indiquent que l’exposition à l’ozone augmente (flèche vers le haut) ou diminue (flèche vers le bas) la variable. Les flèches pleines indiquent la concordance des résultats dans une large gamme d’études ; les flèches claires indiquent des résultats moins certains
| Variable | O3 Effect | Examples of primary source | Frequently cited Synthesis Article |
| Visible injury | [12] | [95] | |
| Photosynthesis | [83] | [82] | |
| Stomatal conductance | [101] | [82] | |
| Dark respiration | [101] | ||
| Tree biomass | [36] | [80] | |
| Crop yield | [65] | [30] | |
| Root growth | [59,60] | ||
| Decomposition | [34] | ||
| Nitrogen uptake | [98] |
4 Visible injury and physiological effects
Visible injury resulting from chronic exposure to low ozone concentrations includes changes in pigmentation or bronzing, chlorosis, and premature senescence after chronic exposure to low ozone concentrations. Flecking and stippling may occur after acute exposure to high ozone levels [42]. For some tree species, such as yellow poplar [96], loblolly pine [59,60], and white pine [4], there is a correlation between visible injury and reductions in growth, while in many studies for a wide range of species, including some of the above, there does not appear to be a correlation [11,80,83].
Physiological effects of ozone exposure include reduced photosynthesis, increased turnover of antioxidant systems [74], damage to reproductive processes [10], increased dark respiration [26,101], lowered carbon transport to roots [16], reduced decomposition of early successional communities [41], and reduced forage quality of C4 grasses [66,78]. Response to ozone appears to vary considerably among species. Results for red spruce showed no change in photosynthesis with elevated ozone [11]. Reich and Amundson [83] found a 50% reduction in photosynthesis for crops such as clover and wheat, but only a 10% reduction for white pine. Results vary even within the same species: Some studies of loblolly pine have shown reductions in photosynthesis while other studies have shown no effect. Using a linear model to summarize about 20 OTC experiments each for conifers, hardwoods, and crops, Reich [82] postulated that an ozone dose of 20 ppm·results in a photosynthesis reduction of 7% for conifers, 36% for hardwoods, and 73% for crops.
5 Growth responses
Reduced photosynthesis results in decreased growth rates, which are often measured as either volume or biomass. Reich [82] determined that the reduction in photosynthesis described above resulted in a growth reduction of 3% for conifers, 13% for hardwoods, and 30% for crops. In contrast to the Reich and Amundson [83] linear model, Percy et al. [76] recently have used the aspen FACE data from Rhinelander, WI to show that the growth response of aspen trees to ozone more closely resembles a non-linear cubic regression. Pye [80] documented a wide range of negative biomass responses of different species to elevated ozone, with the largest being a 69% decrease. The Southern Oxidant Study concluded that ozone had led to a 1–25% growth reduction in eastern U.S. forests [31], while Chappelka and Samuelson [11] reported growth reductions of 0–10% per year. The Southern Appalachian Mountains Initiative concluded that black cherry and yellow poplar were the most sensitive to ozone, while red maple, loblolly pine, and northern red oak were intermediate, and red spruce the most tolerant [31]. Synthesizing the growth reductions of loblolly pine in the Southeast USA, the Southern Commercial Forest Research Cooperative concluded that ozone was responsible for a 2–5% annual growth reduction [100]. The Mid-Atlantic Integrated Assessment [31] concluded that the biomass of black cherry decreased by 27%, yellow poplar by 16%, and loblolly pine by 1%.
Many studies have detailed the reduction of crop yield and photosynthesis by exposure to ozone [22]. The National Crop Loss Assessment Network (NCLAN) program set out to study the effects of ozone on crop yield using open-top chambers throughout the USA [30,32,33], while a European OTC program (EOTCP) provided a similar study in Europe [24]. While EOTCP focused on processes and critical levels of ozone effects on crops, NCLAN focused on providing dose-response functions for economic assessments [97]. NCLAN results indicate a reduced annual soybean yield of 10% and a reduced cotton yield of 12% for seasonal mean ozone levels greater than 50 ppb [29], and a substantial economic benefit of $0.7 billion for a 10% ozone reduction [1]. Corn and other monocots appeared to be less sensitive, while results with winter wheat were highly variable [29]. For a range of studies on spring wheat, Fuhrer et al. [24] modeled a reduction of yield with increasing ozone over a 40 ppb threshold, resulting in a 10% reduction in yield for ozone levels commonly found in southern Europe. Westenbarger and Frisvold [106] modeled a 0.3% to 0.9% increase in corn and soybean yield, respectively, in the eastern USA, with a 20 ppm· summer ozone exposure standard. Spash [97] synthesize a wide range of economic assessments of ozone damage to crops. In addition, he emphasizes the need to consider the demand response resulting from reductions in crop quality as well as the supply response resulting from reductions in crop yield. In the Reich [82] study discussed above, the author concluded that crops were the most sensitive and conifers the least (with hardwoods intermediate) to ozone, since crops have the highest conductances and conifers the lowest. However, the lifetime effects on leaves or needles were similar or even reversed due to the longer lifespan of vegetation with lower conductivity [82]. Furthermore, Pye [80] suggested that the high hardwood sensitivity in the Reich [82] model may have been due to the overabundance of poplar in the sample set.
6 Mechanisms of ozone response
Ozone uptake is a function of both ambient ozone levels and stomatal conductance [58]. Ozone affects vegetation by direct cellular damage (especially to palisade mesophyll cells) once it enters the leaf through the stomates. Gaseous O3 diffuses from the atmosphere, through the stomata, and dissolves in water surrounding the cells before entering the cells themselves [58]. The cellular damage is probably the result of changes in membrane permeabilities and may or may not result in visible injury or reduced growth or yield [42]. Stomata generally open in response to light and warmth and close in response to aridity, water stress, and high CO2 [58]. A secondary response to ozone is a reduction in stomatal conductance, as the stomata close in response to increased internal CO2 that occurs because of the reduced photosynthetic activity caused by the ozone [82,83,87]. It has been suggested that the decrease in stomatal conductance caused by O3 is similar in magnitude to the 10% decrease caused by CO2 increases since pre-industrial conditions [99]. Tjoelker et al. [101] found a decoupling between photosynthesis and stomatal conductance as a result of long-term ozone exposure. Generally, the stomatal control of ozone uptake provides a coupling between environmental conditions and ozone uptake as well as a potential negative feedback to ozone uptake itself. Not all ozone enters the leaves through the stomata. A smaller amount of ozone can enter leaves by direct absorption along leaf exterior surfaces [77].
Ozone uptake depends strongly on stomatal conductance, which varies with climatic and atmospheric conditions. While ozone may reduce stomatal conductance somewhat, it generally increases water stress by reducing root growth [59,60]. Many studies have noted less ozone damage under drought conditions because of the dependence on stomatal conductance [87,93,95]. Beyers et al. [8] and Pell et al. [73] used OTCs to determine the interacting effects of O3 and soil moisture on radish and ponderosa pine seedlings, respectively. For example, Beyers et al. [8] found a biomass reduction of 19.5% for well-watered seedlings vs. 11% for drought-stressed seedlings when exposed to 1.5 times ambient ozone levels. Results of these experiments showed that ozone damage to biomass was less with reduced soil moisture due to stomatal controls. However, other studies [4,59,60] showed that plants exhibited more ozone sensitivity under moisture-stress conditions. Experiments with three-year-old beech trees in growth chambers have shown that while ozone may decrease stomatal conductance under moist conditions, it may actually increase stomatal conductance under drought stress [55]. Jensen and Roberts [37] also showed higher ozone sensitivity under more humid atmospheric conditions due to higher stomatal conductance. Under future conditions of higher CO2 fertilization, it is possible that ozone damage will be reduced due to lower stomatal conductance [22,26].
Besides stomatal controls, plant defense mechanisms also regulate the effective ozone uptake, which is defined as the difference between the stomatal ozone uptake and the defensive response [57,67]. Detoxification by chemical reactions occurs from both existing antioxidants and those stimulated by ozone itself. Emissions of NO within leaves also help to destroy ozone. Because antioxidants are produced from photosynthates, lower levels of antioxidants at night may lead to greater sensitivity to ozone at that time [67]. Also, as ozone levels early in the day deplete antioxidant supplies, plants may be subject to more effective ozone uptake later in the day when ozone levels are normally highest [57,67]. In addition to defense by chemical reactions, repair of injured tissue and alteration of metabolic pathways occurs in response to ozone [67]. Teskey [100] notes that while stomatal regulation may limit ozone uptake, by also limiting photosynthesis, it also reduces the availability of plant repair mechanisms.
The effects of ozone on seedlings are not generally representative of the effects on mature trees or forest ecosystems [11,99]. McLaughlin and Downing [59,60], studying a mature stand of loblolly pines under natural climatic and ozone conditions, determined a 27–50% reduction in stem growth, largely attributed to ozone exposure. Bartholomay et al. [4] showed strong negative correlations between ozone and radial growth for white pines in Acadia National Park. Tjoelker et al. [101] found that shaded leaves were more sensitive than sun-lit leaves to ozone exposure in a mature stand of the shade-tolerant sugar maple. Most comparisons of seedlings vs. mature trees showed greater ozone sensitivity in seedlings, including red spruce [81], sequoias [26], and black cherry [23]. Greater ozone sensitivity in seedlings was attributed to larger stomatal conductances in all of these cases. Since leaf area increases more rapidly with age than does transpiration, leaf-specific transpiration rates, and thus stomatal conductances, generally decrease with age [61]. Furthermore, older trees maintain larger hydraulic resistances due to more complex branching and longer vertical distances to the leaves, and this leads to lower leaf water potential and lower stomatal conductances [11]. Studies of red oak, however, showed an enhanced sensitivity to ozone in 30-year-old mature trees vs. two-year-old seedlings, due to higher stomatal conductances in the older trees [19,28,88]. The larger stomatal conductance in mature red oak might be related to greater demand for carbohydrates [89] or higher concentrations of nitrogen in leaves and fine roots in the mature trees than seedlings [90]. Both of these differences between mature trees and seedlings would imply greater photosynthetic rates in the older trees, leading to higher stomatal conductances. This study points to the difficulties of generalizing the age dependency of tree sensitivity to ozone.
There is also a potential adaptive response to ozone exposure [74,102]. Berrang et al. [5–7] showed that quaking aspen from more ozone polluted areas in the USA were less sensitive to ozone when exposed to high ozone levels in either greenhouses or different field environments. Karnosky and Steiner [38] showed a similar response to green and white ash seedlings. These experiments implied that adaptation to high ozone levels occurred. A suggested mechanism was growth reduction leading to shading by faster-growing tolerant clones [6]. The more ozone-sensitive species also tended to have a higher genetic multiplicity and diversity [74]. Indeed, Barbo et al. [3] showed that in an early successional plant community, exposure to ozone led to a less complex community structure by affecting competitive interactions among plants.
7 Ozone and CO2
Increasing CO2 levels in the future might counteract some of the negative effects of ozone on vegetation growth and productivity. Several Aspen FACE experiments were designed to study such interactive effects. In the Aspen FACE study in northern Wisconsin [39,40] seedlings of aspen, birch, and maple were studied to determine the effects of CO2 (ambient vs. 560 ppm) and O3 (ambient vs. 1.5 × ambient) together and independently on photosynthesis and growth. Karnosky et al. [39] found that the elevated ozone levels completely offset the growth enhancements from the elevated CO2 concentrations. An interactive effect between CO2 and ozone might be expected as ozone uptake is reduced by the lower stomatal conductance at elevated CO2. Karnosky et al. [40] showed that ozone reduced height and diameter growth of aspen in both ambient and elevated CO2 environments, but birch growth was reduced only in elevated CO2 (relative to elevated CO2 alone). Similarly, ozone exposure reduced maximum photosynthetic rates in aspen by 20% and 28%, and in birch by 0% and 17%, under ambient and elevated CO2, respectively. Sugar maple experienced no ozone effects until the fourth year of growth in both CO2 environments. These results do not support the hypothesis of reduction in ozone uptake due to stomatal closure at elevated CO2, and indicate a negative interactive effect between CO2 and ozone. Using these data, Kubiske et al. [43] showed that interannual variability of climate mediated most of the aspen growth response to both CO2 and O3, with the environmental drivers of July radiation and October temperatures enhancing both effects.
The SoyFACE experiment at the University of Illinois at Urbana-Champaign has been established to look at the effects of CO2 and ozone on soybean. Slower senescence from elevated CO2 levels of 550 ppm was offset by accelerated senescence from elevated ozone levels at 23% above ambient levels [17]. Morgan et al. [65] found substantial decreases in above-ground net primary production (NPP) of 11% during 2002 and 23% during 2003 as a result of the increased ozone levels during 2002–2003. However, Christ et al. [13] found no significant ozone effects on crop yield in 2004, which they attributed to a lack of drought stress and lower ambient ozone levels during 2004. This study suggests the importance of climatic conditions to the overall ozone effect. Long et al. [49] used SoyFACE results to conclude that ozone damage to crops may outweigh any gains resulting from CO2 fertilization. They found yield increases of 15% for soybean under CO2 elevation to ∼560 ppm, comparable to the reduction in yield due to elevated ozone. Since no factorial analysis including CO2 and ozone together has yet been performed for a commercially important crop species under free-air conditions, much more experimental work remains to be done, and it must suffice for now to simply compare the magnitudes of the CO2 and ozone effects. An important factor in such a comparison is that the magnitude of ozone damage varies greatly with crop species; according to work by Long et al. [49], maize and rice are much less susceptible to ozone than wheat and soybean. In terms of CO2 fertilization, species is less important than photosynthetic pathway; C4 crops likely have little to gain from elevated CO2 in the absence of water stress [46], and although estimates of C3 crop gains from CO2 fertilization differ widely and are hotly disputed [50,103], they are almost certainly non-negligible. The ozone and CO2 fertilization effects are thus clearly the same order of magnitude, but their relative magnitudes and interactive effects are still highly uncertain and dependent on both species and environmental conditions.
7.1 Modeling ozone effects on plants
Understanding the experimental results and extrapolating across large regions involves the use of numerical models. Modeling the effects of ozone on vegetation can involve simple regression analysis, plant-physiological models, or ecosystem-scale models. At the ecosystem scale, empirical relationships determine the effect of ozone on photosynthesis over the course of the growing season. The plant physiological models are able to make use of the diurnal cycle to determine more directly how ozone impedes the photosynthetic apparatus. In either case, some assumptions about how ozone affects photosynthesis or stomatal conductance are required. These ozone effects are often in the form of dose-response relationships developed from experimental data, and generally involve accumulated measures of ozone uptake.
Dose-response functions have been developed to quantify the effects of ozone on photosynthesis. Dose is the amount of O3 available during the response period and is defined as the O3 concentration multiplied by the duration of exposure [42]. While doses measure the concentration over a period of time, because of antioxidant defenses, ozone is often observed to affect vegetation only after surpassing certain threshold levels [57]. Under low antioxidant conditions, plants may have a much lower ozone threshold [83,105]. Different ozone indices that account for threshold effects include the AOT40, SUM06, and W126 indices. The AOT40 index is the sum of the amounts by which hourly ozone concentrations exceed a threshold of 40 ppb over the growing season and during daylight hours. The SUM06 is the sum of the hourly ozone concentrations over 60 ppb over the growing season and during daylight hours. The AOT40 index has commonly been used to define critical levels of ozone in Europe [24], whereas the SUM06 index has commonly been used in the USA, based upon crop-yield studies. Although the threshold for SUM06 is higher, once it is reached, it accumulates more rapidly than AOT40 [58]. The W126 index weights each hourly value by a sigmoidal weighting scheme, so that low ozone values are not completely ignored [106]. Other non-threshold indices have been developed to provide a metric for human health in North America, such as the 3-year average of the annual fourth highest daily maximum 8-hour ozone concentrations, which Percy et al. [75,76] have shown is highly correlated, along with environmental variables like wind speed and growing degree days, to Aspen growth at the Aspen FACE site in Rhinelander, WI. Flux-based dose-responses account for stomatal conductance to determine the ozone uptake, and may include a threshold such as the flux-based AOT40 used here or in the Ollinger et al. [67] study. Pleijel et al. [77] compared a number of these indices for wheat and potatoes and concluded that the threshold-based flux index best captured ozone damage to crop yield.
Tree physiology models enable us to better understand the processes by which ozone affects plant photosynthetic apparatus and carbon allocation among different parts of the plant. These models are based on single trees and normally operate at the hourly time step, and therefore directly compute the effects of the diurnal ozone cycle [15]. These models can also account for carbon allocation among roots, stems, and leaves, thereby allowing for differential ozone effects on each of these plant parts. Such differential effects may be another explanation for the age-variant sensitivity to ozone; more mature trees may be able to offset some carbon loss in leaves by drawing from a larger pool of labile carbon [15]. The TREGRO model reduces mesophyll conductance to simulate the effects of ozone. The model has been used [107] to show that the effects of ozone on aspen are highly dependent upon external environmental conditions and can even be more sensitive with less ozone exposure under certain meteorological conditions. The effects of ozone on aspen were also studied using the tree physiological model ECOPHYS, which includes ozone effects on photosynthesis and stomatal conductance and explicitly accounts for the detoxifying effects of antioxidants by enabling ozone damage only when plant defenses are overwhelmed. Simulations with ECOPHYS [56] found that there were substantial differential effects on leaves, roots, and stems, with stem dry matter and diameter, leaf biomass and area, and root growth being most sensitive to ozone exposure. Combining the TREGRO model with the stand-level ZELIG model for loblolly pine and yellow-poplar, Laurence et al. [45] showed that moderate ozone effects on individual trees may result in large effects at the stand-level, as the more ozone-sensitive species suffer competitive exclusion.
It is possible to make more accurate estimates of ozone uptake by using eddy covariance data along with Soil-Vegetation- Atmosphere-Transfer (SVAT) models to determine the flux of ozone entering the leaves. The SVAT models are resistance-flow models that represent the exchange of fluxes between the atmosphere and surface by a resistor-network analogue. While eddy covariance fluxes can provide the total flux into the canopy, the SVAT models are used to partition the fluxes between stomatal absorption, external surfaces, and the soil [27,67]. Using these methods at a sitka spruce site in Scotland, Coe et al. [14] found that rates of ozone uptake by vegetation at midday were up to three times higher than could be explained by stomatal considerations alone, which suggests the importance of a further mechanism for ozone removal, such as photochemical destruction at the leaf cuticles.
Ecosystem-scale models enable us to extrapolate effects on individual trees to entire ecosystems and regions to determine, for example, how ozone affects vegetation productivity on the continental-scale. In one of the early ecosystem-scale studies, Ollinger et al. [69] used the PnET-II forest ecosystem model to study the effects of ozone on hardwoods at 64 sites in the northeastern USA for the late 1980s through the early 1990s. They found a reduction in net primary productivity (NPP) of between 3–16%, with less of a reduction on drier sites due to lower stomatal conductance. Ollinger et al. [70] later applied their ozone algorithms to a version of PnET (PnET-CN) that included N cycling to evaluate the interactive effects of CO2, O3, and N within a context of historic land use changes for the hardwoods at the same sites in the northeastern USA. They found that ozone reduced forest growth and C storage, and so partially compensated for the stimulatory effects of CO2 fertilization and N deposition. Felzer et al. [20] applied the Reich [82] and Ollinger et al. [69] models to conifers and crops to extrapolate across the conterminous USA. In these extrapolations, they found a 3–7% decrease in NPP from 1989–1993 and a reduction in carbon sequestration from 18–38 Tg C yr−1 since the 1950s, with largest damage in the midwestern croplands. In a global analysis, Felzer et al. [21] determined that the most severe ozone damage to vegetation occurred in three hotspots, the southeastern and midwestern USA, eastern Europe, and eastern China. From that modeling study, Felzer et al. [21] estimated that during 1989–1993 ozone decreased the NPP by 7.0% in the USA, 11.2% in Europe, and 7.2% in China. Chameides et al. [9] used an atmospheric chemistry model along with a regional climate model to estimate that the yield of winter wheat in much of southeastern China may be suppressed by more that 10% due to high ozone levels. Wang and Mauzerall [104] explored the effect of ozone on crop yields in 2020 for China, Japan, and South Korea and showed an 82% cost increase over 1990 for China. In another modeling study of crops in China, Aunan et al. [2] concluded that management could take advantage of different crop sensitivities to ozone to reduce future crop loss.
Since nutrient availability plays a strong role in governing the productivity of many ecosystems, accurately modeling the effects of ozone on the carbon cycle requires some assumptions about the effects of ozone on nutrient cycling. Models that include N-cycling, for example, may simulate a shift towards less N-limiting conditions if carbon uptake is lowered without also lowering N uptake. In a study involving trembling aspen and paper birch at aspen FACE, Lindroth et al. [48] found that C:N was unaffected by ozone in aspen, but changes in birch, with the direction of change dependent on atmospheric CO2 concentration. Holmes et al. [34], also using data from the aspen FACE, showed that elevated ozone decreased gross N mineralization and microbial biomass N through both limits to quantity of plant litter and changes to litter quality. Swank and Vose [98] inferred reduced N-uptake in pines exposed to high ozone levels, due to higher NO3 concentrations in runoff. Reducing the C:N ratio may have the reverse effect by increasing decomposition and net N mineralization, allowing for more uptake by vegetation [20].
7.2 Ozone and nitrogen deposition in forests
We have developed new analyses to determine the interactive effects of ozone and nitrogen deposition at the regional scale, since any realistic assessment of the regional ozone damage to natural ecosystems should also consider the accompanying fertilization effects of nitrogen deposition. Using atmospheric chemistry models, we previously developed a global AOT40 map (Fig. 1a) by combining the current-day Multiscale Atmospheric Transport and Chemistry (MATCH) model ozone distribution with zonal hourly data from the Massachusetts Institute of Technology (MIT) Integrated Global Systems Model (IGSM) [21]. Because the AOT40 is a threshold index, levels are zero in the early half of the 20th century. Using the Model for Ozone and Related Chemical Tracers, version 2 (MOZART2) [44], we have determined the NOy deposition due to anthropogenic factors by subtracting the pre-industrial 1890 NOy from the 2000 levels (Fig. 1b). Fossil fuel combustion is responsible for the N in NOy, which is the same N that is responsible for much of the formation of O3. The mapped patterns show an overall similarity in the hotspots between the two pollutants, including the eastern USA, Europe, and eastern China. In the USA and in Europe, ozone levels are generally higher relative to NOy further south due to the photochemical predominance of ozone synthesis. Ozone has longer atmospheric residence times than NOx, on the order of days to weeks rather than hours to a day [91], so atmospheric transport of ozone also accounts for some of the differences.
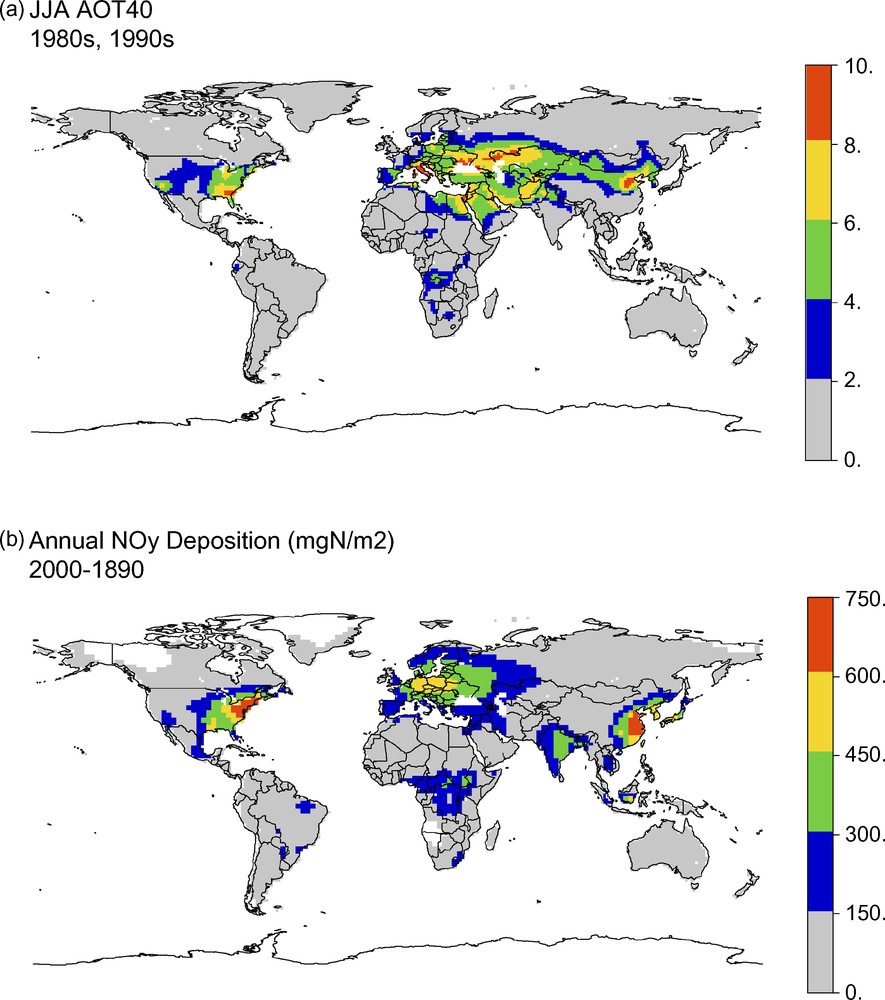
(a) Global AOT40 concentrations of ozone (ppmhr) from MATCH and MIT IGSM models for 1980s and 1990s. (b) Global NOy deposition from MOZART2 model (mgN/m2) since pre-industrial times.
Fig. 1. (a) Concentrations globales AOT40 d’ozone (ppmhr), issues des modèles MATCH et MIT IGSM pour les années 1980 et 1990. (b) Dépôt global de NOy selon le modèle MOZART2 (mgN/m2) depuis l’époque préindustrielle.
Assuming that most croplands are fertilized so that ozone damage will occur regardless of natural N-deposition levels, we asked whether or not the positive effects of NOy on carbon sequestration outweigh the negative effects of ozone in forested regions. Because boreal forests do not utilize NO3 as efficiently as temperate forests [18], we focused on temperate forests for this discussion. We used the Terrestrial Ecosystems Model (TEM version 4.3) to determine the ozone effects [21] in temperate forested regions of the USA, Europe, China, and the globe. Ozone exposure reduces carbon storage between 10–20 Tg C amongst the USA, Europe, and China, and by 73 Tg C globally in the 1980s and 1990s (Table 2).
Carbon sequestration resulting from ozone and nitrogen deposition for temperate forests (Tg C yr−1)
Tableau 2 Séquestration du carbone résultant de l’ozone et du dépôt d’azote dans les forêts tempérées (Tg C yr−1)
| Globe | China | USA | Europe | |
| Ozone | –73.3 | –13.0 | –18.1 | –19.8 |
| NOy dep | 3.0 | 0.8 | 0.9 | 0.8 |
| Lo NOy Cseq | 119.2 | 31.7 | 37.0 | 30.7 |
| Hi NOy Cseq | 271.2 | 72.1 | 84.1 | 69.9 |
| Total (lo) | 45.9 | 18.7 | 18.9 | 11.0 |
| Total (hi) | 197.9 | 59.1 | 66.0 | 50.1 |
We made stoichiometric assumptions to estimate the carbon sequestration rates due to NOy deposition [62]. For our high estimate, we assumed that 13% of nitrogen goes into the woody biomass [53], with a C:N of 500 [68], and the remaining 87% is distributed between soils and non-woody biomass with C:N of 30. These assumptions imply that one gram of nitrogen sequesters 91 grams of carbon at the ecosystem level. Nadelhoffer et al. [68] found that N deposition has only a limited effect on carbon sequestration, because they assumed that only 5% is taken up by woody biomass, with 70% of the nitrogen going into the soils, 15% going into non-woody biomass, and 10% leached from the system. For our low estimate we used their assumptions, but applied a lower C:N of 300 for the woody biomass [64]. This calculation implies that one gram of nitrogen sequesters 40 grams of carbon at the ecosystem level. Under the high estimate, NOy deposition resulted in an excess gain of 70–85 Tg C yr−1 in the three regions, while the lower estimate is in the range of 30–37 Tg C yr−1.
The results of this analysis show that, in all cases, the benefits of NOy deposition on carbon sequestration outweigh the negative effects of ozone on carbon sequestration in temperate forests. Therefore a complete carbon budget in non-managed ecosystems must consider the compensating effects of both ozone and NOy to provide an unbiased view of the net carbon storage. While the results of N deposition are usually positive, large levels of N deposition to pines at experimental sites in Harvard Forest have shown biomass reductions or even tree mortality, and similar consequences are likely in Europe as a result of high N deposition [53,54]. In these cases, nitrogen doubly damages the ecosystem, by both toxically enriching the soil, and enhancing the production of ozone.
7.3 Modeling future effects of ozone on crop yields, carbon storage, and the economy
In managed ecosystems such as croplands, however, where the sensitivity of specific crops to ozone is sometimes severe, reducing ozone levels can significantly increase crop yield and carbon sequestration. As these agricultural lands are often heavily fertilized, reducing ozone levels will have no negative effect of reduced nitrogen deposition. Pell et al. [72] showed ozone damage to radish dry weight was negligible under low nitrogen conditions, but significant under high nitrogen.
Future effects of ozone depend on projections of economic activity, emissions of ozone precursors and other substances, and translation of impacts on vegetation to effects on yields and carbon storage. The consequent economic effects can then be valued in terms of impact on agricultural markets and GHG mitigation costs. Such an analysis was carried out by Felzer et al. [21] and Reilly et al. [85] for different scenarios of greenhouse gas emission and pollution controls using the MIT IGSM [79,84]. These scenarios encompass a factorial with two pollution possibilities, policy or business-as-usual (BAU) and two greenhouse gas stabilization possibilities, policy or BAU. They include a pollution case that allows greenhouse gases (GHG) and pollutant-gas emissions to continue increasing unabated (pol); a pollution-capped scenario that assumes no regulation of GHG emissions, but involves capping the pollutant gases everywhere at 2005 levels (polcap); a GHG stabilization scenario that assumes significant reduction in GHG emissions by 2100 equivalent to a 550 ppm stabilization (gstab); and a scenario that applies both pollution caps and GHG stabilization (gstabcap).
Reilly et al. [85] examined the effects of ozone on global yields, finding the largest effects occurred in Europe, the USA, and China where ozone levels are projected to be highest.1 Modeled results for these three regions (Table 3) show decreases of crop yields from ozone exposure in 2100 of 74 to 82% for the pol scenario, 46 to 70% with either pollution or GHG limits, and 25 to 31% with both pollution and GHG limits (Fig. 2). Benefits of lower ozone occurred with GHG limits as well as with pollution limits, with the largest benefits occurring when both GHG and pollution caps were in place. Assuming a GHG stabilization policy is enacted, pollution caps in China result in 133% more yield than with no caps, as compared to 76% and 53% in the USA and in Europe, respectively. The global economic loss associated with ozone damage to crops, pasture, and forestry was 0.8% ($8 trillion) of the net present value of total macroeconomic consumption between 2005 and 2100 discounted at 5%. Net present value (NPV) benefits of avoided ozone damage associated with GHG limits were 0.3% ($3.2 trillion) and benefits of capping pollution were 0.55% ($5.7 trillion) with both a pollution cap and GHG limits [85].
Percent differences in crop yield in 2100 for difference scenarios with and without ozone (Tg C yr−1). The scenarios include pol. (pollution), polcap (pollution caps), gstab (greenhouse gas stabilization), and gstabcap (pollution caps with greenhouse gas stabilization). See text for descriptions of the scenarios
Tableau 3 Différences en pourcentage dans le rendement des récoltes en 2100, pour différents scénarios avec et sans ozone (Tg C yr−1). Les scénarios comportent: Pol. (pollution), Pol. Caps (recouvrements de pollution), gstab (stabilisation des gaz à effet de serre), et gstabcap (recouvrements de pollution + stabilisation des gaz à effet de serre). Voir le texte pour la description des scénarios
| USA | EU | China | Global | |
| pol | –74.5 | –79.9 | –82.5 | –64.0 |
| polcap | –45.9 | –50.4 | –53.8 | –35.4 |
| gstab | –57.7 | –51.2 | –70.5 | –40.0 |
| gstabcap | –25.7 | –25.5 | –30.7 | –16.2 |
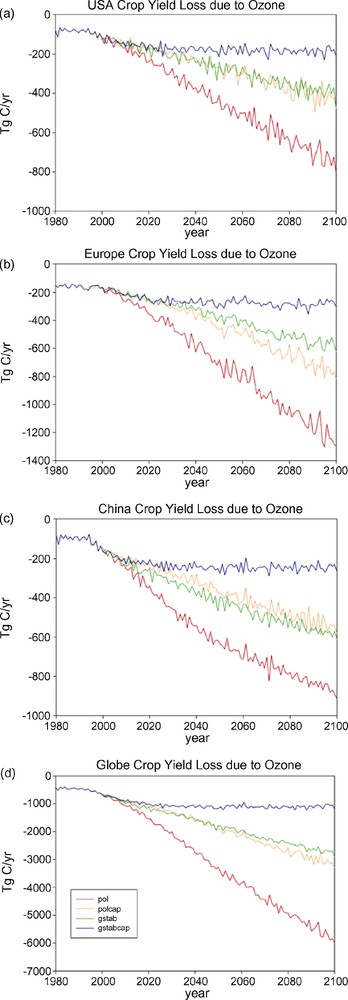
Expected loss of crop yield due to ozone for four scenarios for (a) the USA, (b) Europe, (c) China, and (d) the globe, in Tg C/yr. Scenario 1 assumes business-as-usual (pol), scenario 2 assumes pollution caps everywhere at 1995 levels (polcap), scenario 3 assumes greenhouse gas stabilization at 550 ppm by 2100 (gstab), and scenario 4 assumes both pollution caps and greenhouse gas stabilization (gstabcap).
Fig. 2. Perte de rendement des récoltes due à l’ozone attendue, selon quatre scenarios pour (a) les États-Unis, (b) l’Europe, (c) la China, et (d) le globe, in Tg C/an. Le scénario 1 suppose un état habituel de la situation, le scénario 2 des recouvrements de pollution partout aux niveaux de 1995, le scénario 3 une stabilisation des gaz à effet de serre à 550 ppm en 2100, et le scénario 4 prend en compte à la fois les recouvrements de pollution et la stabilisation des gaz à effet de serre.
Felzer et al. [21], using the future scenarios described above, assessed the effects of reduced carbon sequestration resulting from ozone exposure on attaining a CO2 emissions target of 550 ppm by 2100, where the value of carbon storage was estimated as the avoided cost of mitigation from fossil fuels needed to achieve the same atmospheric CO2 limit. Globally, ozone reduced the accumulated carbon uptake by 2100 by 58 Pg C in the scenario without pollution caps, but only by 16 Pg C with caps. They found that reduced carbon uptake due to ozone damage would increase the NPV macroeconomic consumption cost of the GHG policy by about 0.45% ($4.5 trillion). The potential benefits of ozone reduction resulting from the climate policy because of the ancillary benefits on pollution emissions were about 0.5% ($5.2 trillion) and additional benefits of a pollution cap another 0.25% ($2.6 trillion).2
8 Conclusions
Exposure to ozone causes both visible and physiological damage to vegetation. Visible injury is often a metric of ozone damage and may or may not coincide with physiological injury. Physiological injury includes reduced photosynthesis and other damage to plant functions that lead to reduced growth and biomass. A threshold response to ozone results from initial detoxification by plant antioxidants. Because most ozone enters leaves through the stomata, climatic controls on stomatal conductance regulate ozone uptake. Ozone responds to water-stress in complex ways, as lower stomatal conductance can reduce ozone uptake while ozone itself may impair stomatal function and decrease root growth. There is also contradictory evidence on how the ozone effect differs for seedlings vs. mature vegetation, with stomatal controls again playing a dominant role. Competitive interaction in natural environments often leads to a dominance of ozone-tolerant species, reducing the diversity of the community.
Although simple regression models of the effects of ozone on vegetation have been developed, process-based models may involve ecosystem-level approaches or physiological approaches that account for diurnal variability. Various ozone metrics include simple doses, threshold indices or effective doses that account for plant detoxification, or flux-based measures that also account for stomatal conductance. Dose-response functions rely on experimental data to relate these measures to ozone response for different species. In this sense, all models ultimately rely on empirical data to determine the sensitivity of photosynthesis or other plant functions to ozone.
Because NOx is a key part of ozone production, the coincidence of NOy deposition and surface-level ozone is a key consideration towards understanding the carbon sequestration effects on natural ecosystems. Our analysis shows that carbon sequestration resulting from NOy deposition can offset the negative effects of ozone exposure on temperate forests. For managed ecosystems such as croplands, however, where there is significant nitrogen fertilization, there is no compensating effect. Reducing atmospheric ozone levels will therefore not likely decrease carbon sequestration of natural forests due to compensating reductions in nitrogen deposition, but will significantly improve future crop yields and carbon sequestration in croplands or other managed ecosystems.
Acknowledgments
This study was funded by the Biocomplexity Program of the U.S. National Science Foundation (ATM-0120468), the Methods and Models for Integrated Assessment Program of the U.S. National Science Foundation (DEB-9711626) and the Earth Observing System Program of the U.S. National Aeronautics and Space Administration (NAG5-10135). We also received support from the MIT Joint Program on the Science and Policy of Global Changes. We would like to thank D. Lucas for the N deposition data and D. Kicklighter for their helpful reviews.
1 Scenarios as included in Reilly et al. [85] with additional information from the authors. Discounted at 3% the global economic loss associated with ozone damage to crops, pasture, and forestry was 1.1% ($24 trillion) of the net present value of total macroeconomic consumption between 2005 and 2100. Net present value (NPV) benefits of avoided ozone damage associated with GHG limits were 0.4% ($9.5 trillion) and benefits of capping pollution were 0.53% ($12 trillion) with both a pollution cap and GHG limits [85].
2 Discounted at 3% they found that reduced carbon uptake due to ozone damage would increase the NPV macroeconomic consumption cost of the GHG policy by about 0.51% ($10.3 trillion). The potential benefits of ozone reduction resulting from the climate policy because of the ancillary benefits on pollution emissions was about 0.64% ($12.9 trillion) and additional benefits of a pollution cap another 0.39% ($7.8 trillion).