

1 Introduction
DORIS (Doppler Orbit Determination and Radiopositioning by Satellite) is a French tracking system developed by CNES (French space agency) in cooperation with IGN (French mapping agency) and the GRGS (French Research Group on Satellite Geodesy). This system is based on a dense permanent network of dedicated beacons, fully automated and transmitting a radio-electrical signal on two frequencies (2 GHz and 400 MHz), using omnidirectional antennas [38]. These instruments can work in all types of environment. Fig. 1 shows an example of a recent installation in French Polynesia, but it is important to note that the system, being an uplink system, does not require any intervention on site and can work under harsh climatic condition (from cold polar regions to humid tropical sites).
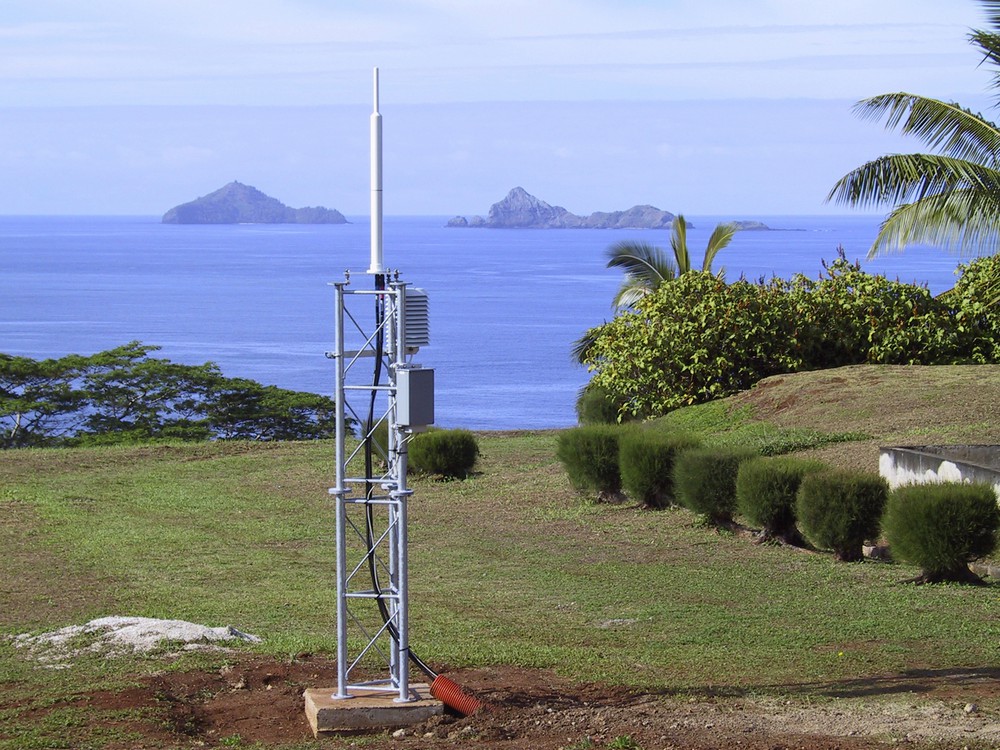
DORIS permanent tracking station in Rikitea (French Polynesia). From H. Fagard (IGN/SIMB).
Fig. 1. Station de poursuite permanente DORIS à Rikitea (Polynésie française). H. Fagard (IGN/SIMB).
The goal of this paper is to survey the recent results obtained by the different analysis groups with potential applications in the fields of global geodesy, plate tectonics and atmospheric sciences. We will first analyze the recent accuracy obtained using DORIS data, explaining reasons for the most recent improvements as well as the current limitation of this technique. We will also compare these results with results obtained from other space geodetic techniques and show how the DORIS specificity could be useful in the future.
2 DORIS ground and space system
The DORIS permanent network is composed of 55 stations, geographically well distributed (Fig. 2). This network was installed by IGN before the launch of the first DORIS satellite (SPOT-2 in January 1990) and it is still maintained by IGN [49], in close cooperation with CNES. About half of the DORIS tracking equipments is located at close range with other fundamental geodetic systems: Very Long Baseline Interferometry (VLBI), Satellite Laser Ranging (SLR) and Global Positioning System (GPS).
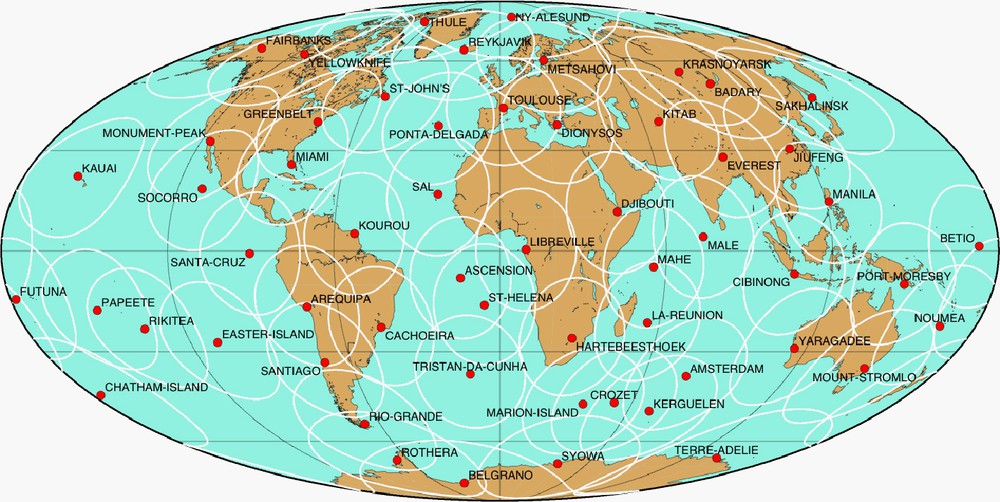
DORIS permanent tracking network (as on 28 November 2006). From H. Fagard (IGN/SIMB).
Fig. 2. Réseau de poursuite permanent DORIS (28 novembre 2006). H. Fagard (IGN/SIMB).
In the recent years, a rejuvenation of the network was undertaken by IGN [13]. Major steps were taken to improve the geodetic stability of the beacons in order to allow subcentimetric accuracy for the most demanding applications, such as reference frame determination. The stability of the DORIS beacons is now almost fully satisfactory. While only 10 sites were considered of good geodetic quality in 1999 and 18 were considered of poor quality, 46 sites were considered of excellent or good quality in 2006 and only two of poor quality [13].
Table 1 displays a list of the current and already planned satellite missions carrying a DORIS receiver on-board. DORIS being a French system, most of the early satellites are opportunity missions (such as the SPOT remote sensing satellites) or French-related missions for altimetry, in which DORIS is used for precise orbit determination, starting with the TOPEX/Poseidon mission [7,15]. However, we must also point out that some most recent missions have developed their own DORIS receiver technology (e.g., CITRIS = scintillation and tomography receiver in space) for their own applications [6]. Finally, we must also say that some of these missions do not provide scientific users with DORIS data, either because of technological restrictions in the case of CITRIS (very high-rate receiver generating a very large amount of data but during very short periods), or because of military restrictions in the case of the future Pleiades constellation (for civil and military remote sensing applications).
Past, current and future satellite missions carrying an on-board DORIS receiver
Tableau 1 Missions satellitaires passées, présentes et futures comportant un récepteur DORIS
| Satellite | Launch | Mission goal | Receiver generation | Other tracking system | Altitude (km) | Data availability for IDS |
| SPOT-2 | 22 January 1990 | Remote sensing | 1G | – | 830 | Yes |
| TOPEX/Poseidon | 10 August 1992 | Altimetry | 1G | SLR + GPS | 1330 | Yes |
| SPOT-3 | 26 September 1993 | Remote sensing | 1G | – | 830 | Yes |
| SPOT-4 | 24 March 1998 | Remote sensing | 1G | – | 830 | Yes |
| Jason | 7 December 2001 | Altimetry | 2GM | SLR + GPS | 1330 | Yes |
| ENVISAT | 1 April 2002 | Environment | 2G | SLR | 800 | Yes |
| Altimetry | ||||||
| SPOT-5 | 4 May 2002 | Remote sensing | 2GM | – | 830 | Yes |
| CITRIS | 9 March 2007 | Atmosphere | CITRIS | GPS | 560 | No |
| Jason-2 | June 2008 | Altimetry | SLR + GPS | Yes | ||
| Cryosat-2 | March 2009 | Altimetry | SLR + GPS | Yes | ||
| AltiKa/SARAL | 2009–2010 | Altimetry | SLR + GPS | Yes | ||
| Pléiades | Remote sensing | No |
3 The International DORIS Service (IDS)
In 2003, at the General Assembly of the International Union of Geodesy and Geophysics (IUGG) in Sapporo, Japan, the IDS (International DORIS Service) was created and officially recognized by the International Association of Geodesy (IAG) [39,40], following an initial phase of a DORIS Pilot Project [37]. This was done for DORIS as it was previously done for GPS, through the establishment of the IGS (International GNSS Service) [9]. These scientific services are organized per technique and form the backbone of the worldwide observation network for geodesy GGOS (Global Geodetic Observing System) [30].
A complete IDS organization was set up to collect and archive DORIS data at two data centres: NASA/CDDIS in the USA (cddis.gsfc.nasa.gov) and IGN in France (doris.ensg.ign.fr) [28]. Fig. 3 summarizes the amount of DORIS data currently available at these centres. Except for the very earlier SPOT-2 data (between 1990 and 1993), all data from all satellites carrying a DORIS receiver on-board are properly archived and freely available to scientists worldwide. This includes data from satellites for earth observations (French SPOT-2, SPOT-3, SPOT-4 and SPOT-5 from CNES), the US–French altimeter mission satellites (TOPEX/Poseidon and Jason) and the ESA mission for environment and altimetry (ENVISAT).
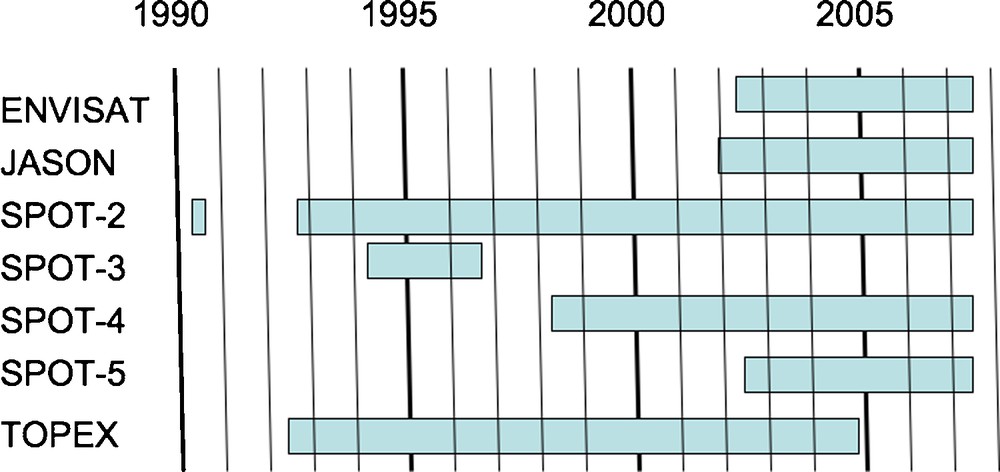
DORIS observations available at the IDS data centres (August 2007).
Fig. 3. Disponibilité des données DORIS dans les centres de données de l’IDS (août 2007).
Several analysis groups have used these data to estimate weekly or monthly coordinates of DORIS stations (see Fig. 4) and they have submitted their results to these IDS data centres: GSC (Goddard Space Flight Center, USA, in cooperation with Geoscience, Australia, using the GEODYN software), IGN (‘Institut géographique national’, France, in cooperation with the Jet Propulsion Laboratory, USA, using the GIPSY/OASIS II software) [49], INA (INASAN, Russia, using the GIPSY/OASIS II software), LCA = LEGOS/CLS, LEGOS (‘Laboratoire d’études en géophysique et océanographie spatiales’), France, in cooperation with CLS (‘Collecte Localisation satellite’), France, using the GINS/DYNAMO software) [33], SOD (Service for Orbit Determination) at the ‘Centre national d’études spatiales’, France, using the ZOOM software, SSA = SSALTO (‘Segment Sol multi-missions ALTimétrie, Orbitographie et localisation precise’), also at CNES, providing station coordinates, using a point-positioning approach (without any orbit estimation). An additional group, GOP (Pecny Observatory, Czech Republic), using the Bernese software [35], has also recently developed this capability and recently submitted a few solutions.
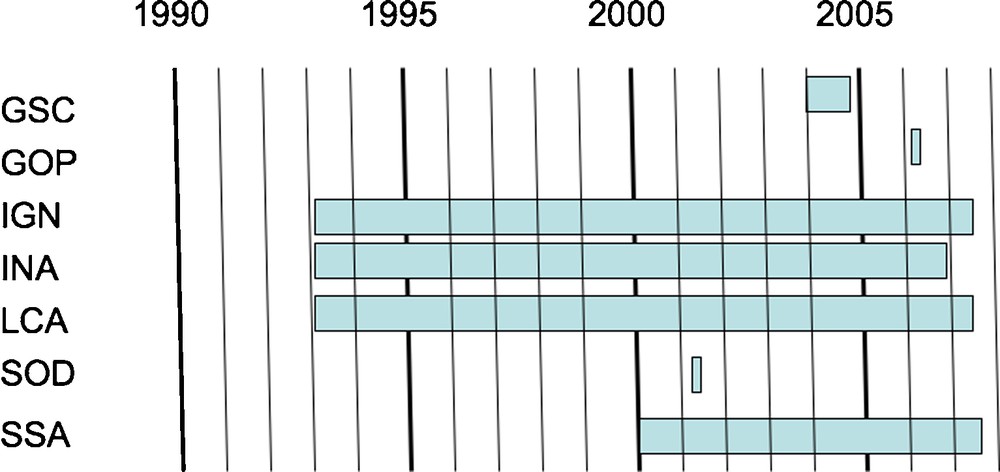
DORIS weekly SINEX solutions (station coordinates) available at the IDS data centres (August 2007).
Fig. 4. Disponibilité des solutions DORIS hebdomadaires en format SINEX (coordonnées de stations) dans les centres de données de l’IDS (août 2007).
It must be noted that two groups in France (IGN/JPL and LEGOS/CLS) submit such geodetic solutions on a regular basis. The IGN/JPL group submits its results every week, while the LEGOS/CLS groups initially preferred to submit them every three to six months. However, in August 2007, the LCA analysis centre also started to deliver products on a weekly basis. The International DORIS Service developed a website maintained in Toulouse by CLS at (http://ids.cls.fr), providing information on DORIS data and products. Since its very beginning, the number of monthly accesses to the IDS Web site has continuously and rapidly grown: on average, 50 connections were registered per month in 2001, 100 in 2002, 200 in 2003, 400 in 2004, 500 in 2005, 900 in 2006 and more than 1800 in mid-2007.
4 Recent improvements in DORIS data analysis
In the past four years, a significant improvement was obtained for DORIS geodetic results (station coordinates). Let us try to understand the reasons for this improvement.
4.1 Increase in DORIS data availability
First of all, the precision of the DORIS-derived station position is clearly dependent on the number of DORIS data available for this station and hence on the number of satellites equipped with DORIS receiver and providing their data to the IDS for scientific applications.
The results in Fig. 5 are derived from an earlier study [53], using only a limited number of available DORIS satellites during a time period. Fig. 5 shows that an increase of one to three satellites basically improves the precision of the results (towards an internal reference) by a factor of 2, while an increase from three to five satellites improves the precision of the results by another factor of 2. It can also be seen that the horizontal and the vertical DORIS performances are rather similar. This is not the case for other techniques, such as GPS, for which the vertical component is usually worse than the horizontal component by a factor of 5 (10 mm with regard to 2 mm) [23].
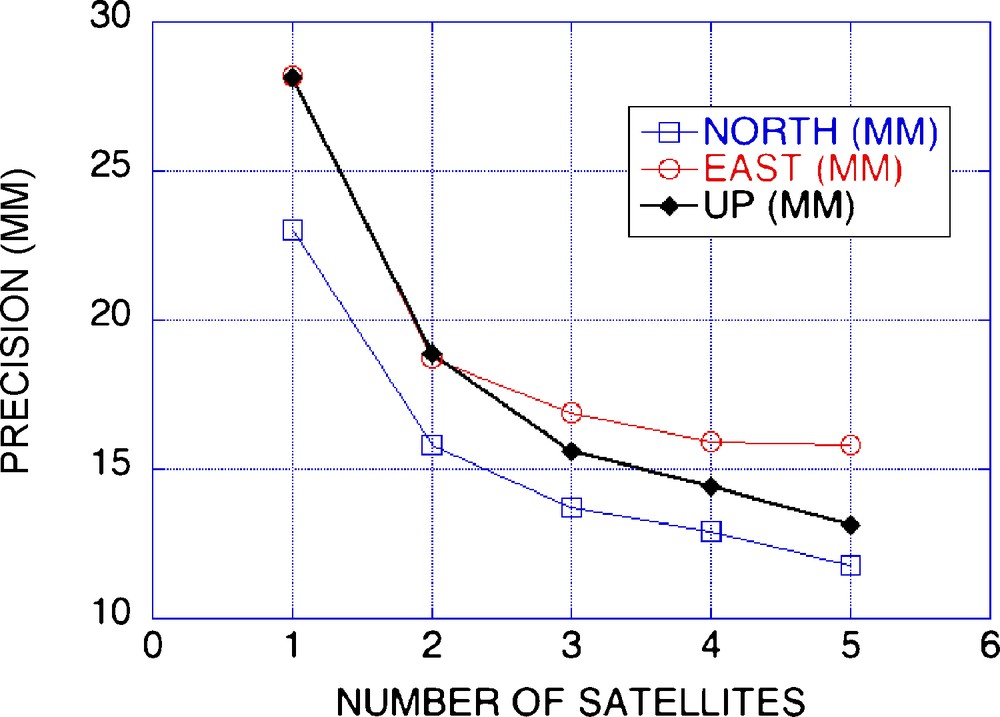
DORIS positioning precision with regard to the number of available satellites (in north, east and vertical). Single week results (1–7 February 2004). All possible choices for satellites selection were considered.
Fig. 5. Précision de la localisation géodésique DORIS en fonction du nombre de satellites disponibles (au nord, à l’est et vertical). Résultats hebdomadaires (1–7 février 2004), en considérant tous les choix possibles de sélection de satellites.
The number of DORIS satellites available at the time of observations is then a critical parameter. While only two DORIS satellites were available at the early beginning of the system (1990–1993), five satellites were available since 2002 (SPOT-2, SPOT-4, Jason, ENVISAT and SPOT-5). The best results are obtained using a proper combination of DORIS data from multiple satellites [46]. More recent studies [54] have also shown that the most recent satellites equipped with the latest technology receivers (SPOT-5, ENVISAT) are more important and that the loss of these satellites would be potentially critical. However, the perspective of future satellite missions (see Table 1) with a new generation of on-board receivers could help improve these results.
4.2 Availability of improved GRACE-derived gravity field models
Furthermore, improvements in the accuracy (external precision using GPS results as reference) were also obtained by using more sophisticated analysis strategies or better models [44]. In particular, the availability of the latest gravity fields models derived from the GRACE mission [36] used for modelling the orbit shows a clear improvement in the DORIS results. This was to be expected, as the DORIS satellites are orbiting at an altitude of 800 to 1300 km, while the GPS satellites, for example, are orbiting at an altitude of 20,000 km and are then less sensitive to errors in the gravity-field models.
4.3 Better handling of problems related to the South Atlantic Anomaly
Some satellite-specific problems were also detected and corrected. For example, initial computations showed that using DORIS/Jason data produced erroneous results for station positions and station velocities [46]. For instance, station velocities around Brazil were totally corrupted by several tens of centimetres. This artefact of computation was later explained [47] as related to successive radiation doses of the satellite on-board quartz oscillator over the South Atlantic Anomaly (SAA) region. Over this region, the magnetic field is much weaker and energy particles are naturally trapped, affecting the behaviour of several satellite equipments, in particular the on-board clocks. Using DORIS data from the TOPEX/Poseidon and the Jason missions (both satellites flying in close formation), the GRGS group [20] was recently able to propose an empirical correction model for the DORIS/Jason data. It is amazing to see how extremely well the basic SAA model derived from the DORIS data (see Fig. 6) maps the geographical location of this effect.
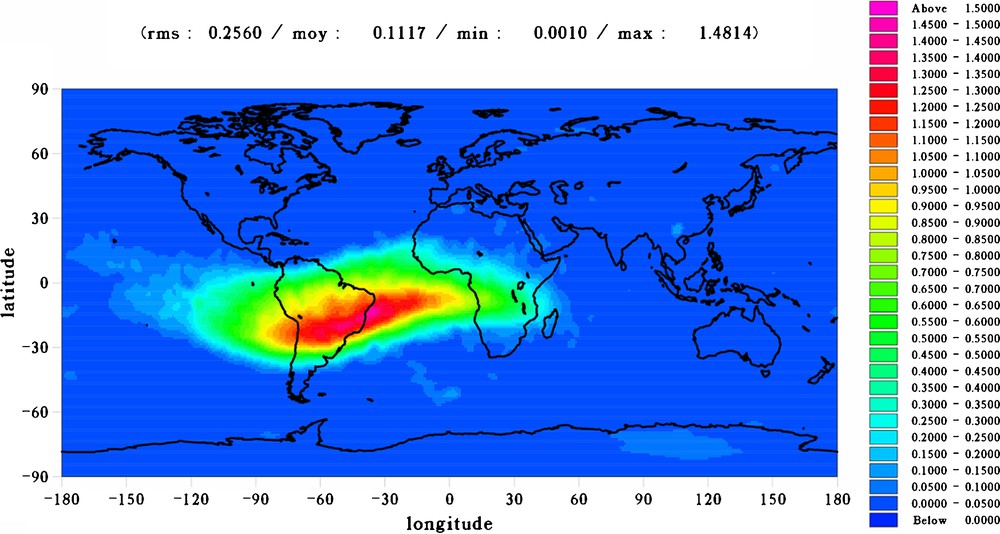
Plot of the relative SAA dose exposure in 2002–2005 at the 1300-km altitude of Jason-1 (dimensionless units), derived from DORIS observations. Source: [20].
Fig. 6. Exposition en radiation à l’altitude du satellite Jason (1300 km) durant la période 2002–2005, déterminée à partir de mesures DORIS (unités sans dimension). Source : [20].
This phenomenon was not seen in previous data, as the orbit was lower (SPOTs) or as the protection to radiation was more effective (TOPEX) than for Jason. This problem is now fully understood and CNES has already tightened the specifications on radiation sensitivity. For future satellites, starting with Jason-2, the on-board oscillator will be better protected against radiation.
4.4 Antenna correction models
Some authors tried to apply GPS-derived techniques to DORIS data analysis [31]. For example, Willis et al. [51] tried to estimate phase centre variation (PCV) maps for DORIS data. Fig. 7 shows a few examples of such results. Each pixel of this map corresponds to the mean value of the DORIS residuals over one complete year, as seen by the satellite, in this specific direction in the satellite frame (north is in the direction of the satellite velocity).
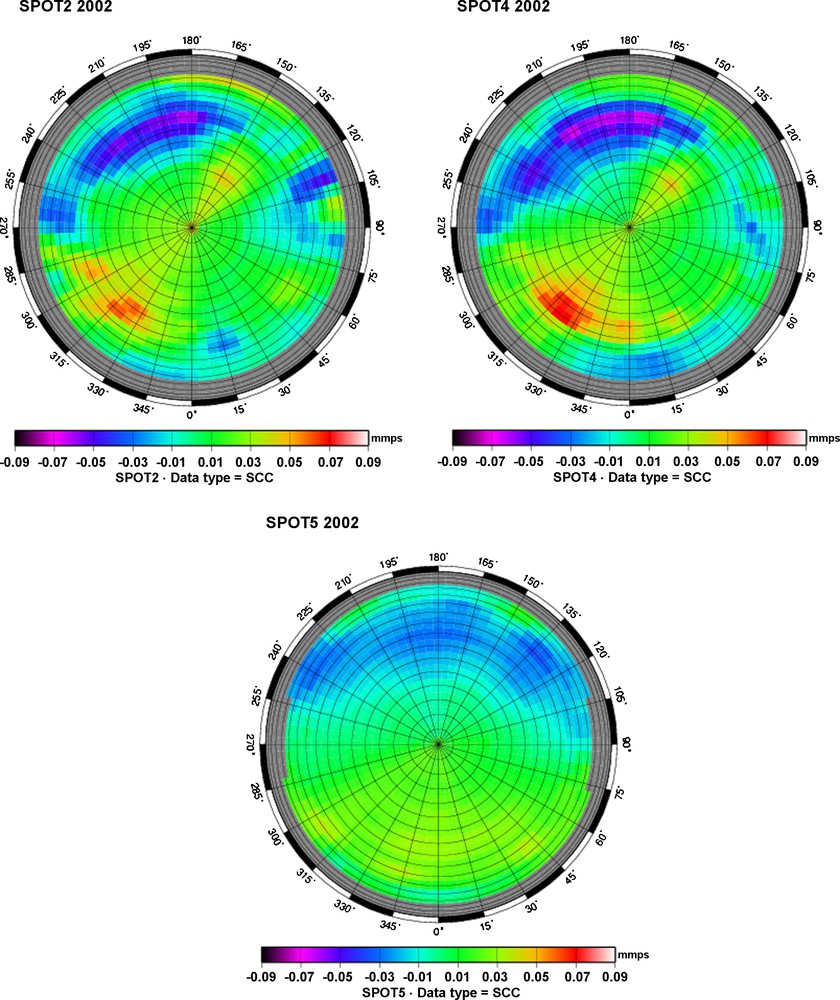
DORIS/SPOT-2, SPOT-4 and SPOT-5 antenna map corrections (2002). Source: [51].
Fig. 7. Cartes de corrections d’antenne DORIS/SPOT-2, SPOT-4 et SPOT-5 (pour 2002). Source : [51].
It can be seen from Fig. 7 that SPOT-2 and SPOT-4 present similar patterns (negative residuals in the velocity direction and positive residuals in the opposite direction). This is equivalent to a time tagging error in the DORIS data measurement, also pointed out by other authors when comparing DORIS-derived and SLR-derived orbits, demonstrating a small but significant bias in the along-track component [57]. However, Fig. 7 also shows that this effect is very much attenuated in the case of the SPOT-5 satellite. This could come from a better signal-to-noise ratio from the SPOT-5 receiver (second generation towards first generation, see Table 1), or simply from a mismodelling error, as the SPOT-2 and SPOT-4 satellites are rather similar in shape, while the SPOT-5 satellite is slightly different (angle between the solar panel and the main body of the satellite).
However, the adoption of such maps did not show a drastic improvement in the geodetic results [51,55].
4.5 Improvement of data analysis during geomagnetic storms
A close verification of the quality of the DORIS weekly geodetic results (station coordinates) showed that periods of larger solar activity (e.g., geomagnetic storms [42]) were of poorer quality [50]. This can be explained by the fact that the atmospheric density models, such as DTM [5], used to estimate the atmospheric drag applied on the satellite, do not represent as well the actual physics of the atmosphere during these periods.
Tests have shown [50] that optimized estimation strategies, involving a more frequent determination of drag empirical parameters (one per minute instead of one every four to six hours) using tight constrain, can provide geodetic results that are less degraded and that are almost at the same accuracy level as during periods of unperturbed atmosphere. Even results outside periods of geomagnetic storms are slightly improved when using this advanced processing strategy.
It must also be noted that the DORIS-derived empirical drag parameter (Fig. 8) seems to contain some valuable information on the physics of the atmosphere, as the estimated parameter shows a high correlation with atmospheric coefficient, such as Ap, provided every 3 h.
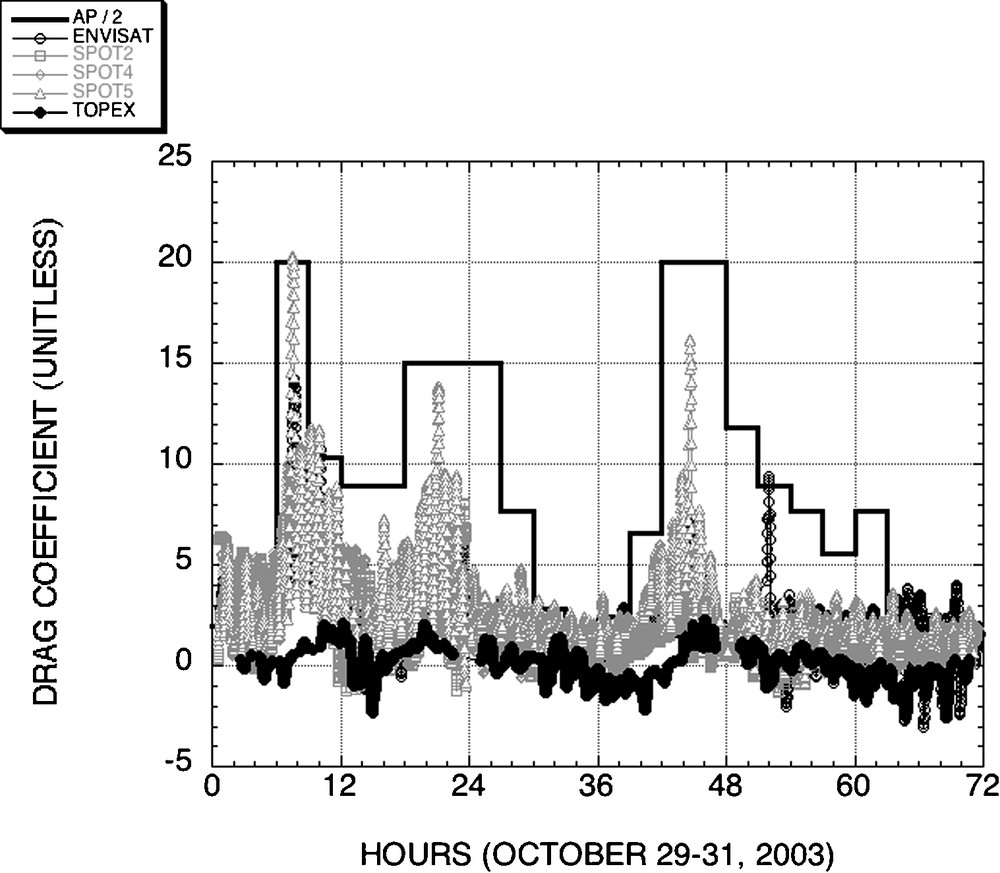
Rapid determination (one per minute) of drag coefficient estimated independently for each DORIS satellite and geomagnetic Ap/2 values (every 3 h), 29–31 October 2003. Source: [50].
Fig. 8. Détermination rapide (une fois par minute) du paramètre de frottement atmosphérique pour chaque satellite DORIS et comparaison avec le paramètre géomagnétique Ap/2 (toutes les 3 h), entre le 29 et le 31 octobre 2003. Source : [50].
This could help refine atmospheric density models, especially as data at these altitudes (800 to 1300 km) are usually not well covered by other sources of data.
5 DORIS for precise orbit determination
As said before, the main goal of the DORIS system is the determination of precise orbit of low earth-orbiting (LEO) satellites.
Current post-processing accuracy of 2 cm (in the radial component) or better can now be reached for higher satellites such as TOPEX/Poseidon and Jason, while 3–4-cm accuracy is achievable for SPOT and ENVISAT satellites at a lower altitude [56]. The best results are obtained for Jason in post-processing mode, using simultaneously all available tracking data on-board the satellite: GPS, SLR and DORIS [11,16,22].
The orbit accuracy is critical for the satellite altimetry missions. Two recent studies [25,26] showed that systematic errors in station coordinates could map into orbit estimation and then through derived geophysical products (e.g., mean sea level and mean sea level rate). If errors on individual station coordinates could be ignored [25], errors in the Z-component of the geodetic frame could map into the derived mean sea level, due to the north–south asymmetry of the oceans [26].
Even if major improvements were obtained in precise orbit determination, systematic errors can still be observed in the DORIS data residuals of the different analysis groups [12]. A detailed analysis of these errors and a better understanding of their causes could lead to future improvements in the precision of the results (orbit, station coordinate, sea level…).
6 DORIS for real-time orbit determination
As the DORIS data are performed directly on-board the satellite, CNES has developed specific software (DIODE) [17], processing DORIS data in real time and predicting the satellite orbit with a very good integrity and accuracy performances. Currently a 5-cm orbit precision can be obtained in real time when all models can be properly uploaded on board the satellite.
7 DORIS and the maintenance of the Terrestrial Reference Frame
Due to the good geographical distribution of the DORIS permanent tracking network, to its long-term time series of observations and to its numerous collocations with other geodetic space techniques (about 50 % of DORIS stations are collocated with other space techniques), DORIS is a rather attractive system for terrestrial reference frame maintenance [2,24]. DORIS was a significant contributor to the ITRF2005 [3], based on a new approach using time series of station coordinates. A key factor in ITRF2005 is the number of sites where several techniques are present. Without such sites, no combination between techniques would be possible. In ITRF2005, five sites included all four techniques (VLBI, Laser, GPS and DORIS), 26 sites included four and 64 included two. Without DORIS, no site would include four techniques, only 13 sites would include all the three techniques, and 45 sites would include two. This demonstrates the importance of DORIS in the ITRF2005 combination.
Different studies tried to assess the nature of the noise included in the DORIS-derived time series of station coordinates: white noise, coloured noise [19,43]. All analyses noted the presence of some systematic errors, showing future ways of improvement, in the instance analysis centres would be able to understand better these errors and to correct them. In particular, a clear signal at 118 days was detected in several DORIS time series. This period is directly linked with the period relating the TOPEX orbital plane toward the direction of the Sun. This could be an indication of a mismodelling in the solar pressure force. This problem could be solved by using a specialized correction model [58] or by modifying the analysis strategy.
In 2006, three different long-term times series of solutions could be analyzed: IGN/JPL INASAN and LEGOS/CLS, IGN/JPL and INASAN, using the same software (GIPSY/OASIS) and a very close analysis strategy, obtained almost indistinguishable results. The LEGOS/CLS solution presents more differences, as the software used (GINS/DYNAMO) and the analysis strategy is quite different. However, many similarities can be seen in the results, even in geocenter variation determination [14].
Previous larger problems in the determination of the DORIS-derived geocenter are now solved and fully understood as related to a preprocessing error related to the vector between the centre of mass of the SPOT-4 satellite and the centre of phase of the antenna in 1998 [52].
8 Geophysical applications of the DORIS system
As a 10-mm precision is now achievable for weekly station coordinates [44], DORIS can now detect smaller signals in amplitude, such as a change in station coordinates due to the presence of a nearby earthquake. For example, a post-seismic displacement of 50 mm in the north direction and +20 mm in the east direction was detected for the Fairbanks station (Alaska) after the Denali Earthquake of 3 November 2002 [48]. This rapid displacement was also observed in more detail by a nearby GPS receiver using 1-Hz data [18].
A more exhaustive study was initiated [45] to identify stations whose coordinates were showing some anomalous signal, either natural (earthquake, volcano, corrosion of support…) or caused by human activity. This study was completed through the IDS, using the IDS analysis forum, where analysis groups could share their experience and results in these problems [28].
Being able to detect and correct these problems helped all groups to provide better geodetic results, leading to a better (less biased) estimation of station velocities. This allowed a better estimation of global plate tectonics [33] (see Fig. 9), where the DORIS estimate matches very well the geological model [10].
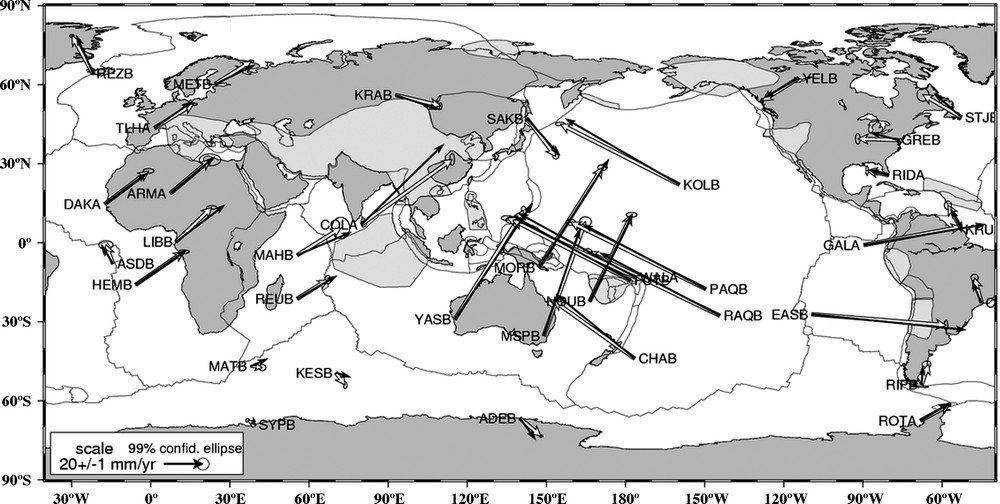
Horizontal velocity of 37 DORIS sites located in stable plate interiors. DORIS vectors with 99% confidence ellipses (white) are compared to PB2002 estimates (black). Grey areas are orogens as defined by Bird [10]. Names correspond to the DORIS acronyms of the last observed station for each site. Velocities are expressed into ITRF2000 [1]. Source: [33].
Fig. 9. Vitesses horizontales des 37 sites DORIS situés à l’intérieur stable des plaques tectoniques. Les vecteurs DORIS fournis avec des ellipses de confiance à 99 % (en blanc) sont comparés au modèle PB2002 (en noir). Les zones grisées correspondent aux zones orogènes définies par Bird [10]. Les noms correspondent aux acronymes DORIS de la dernière station observée pour chaque site. Les vitesses sont exprimées en ITRF2000 [1]. Source : [33].
It is also possible to detect plate tectonics on a regional basis, for example in the case of Africa, for which the GPS infrastructure is not as dense as in other places and where DORIS provides some valuable information in Africa [27], where the geodetic observing network is rather sparse and for which DORIS provides long-term measurements.
Other geophysical studies looked at more local geophysical aspects, for example in Antarctica, where the DORIS system is well-suited (accumulation of passes due to the sun-synchronous orbits of the SPOT satellites) and for which a specific pilot experiment was organized [29].
Finally, regional studies were also conducted around the Himalayan regions using simultaneously GPS and DORIS, in order to understand better the complexity of the local tectonics [8].
9 Ionospheric sounding using DORIS data
The fact that DORIS beacons transmit their signal simultaneously on two high frequencies rather far apart (2 GHz and 400 MHz) allows us, as for other techniques like GPS or VLBI, to measure the signal path delay due to the Total Electronic Content (TEC) of the ionosphere. This method provides an estimation of specific TEC ionospheric maps (global or regional). More recently, a study [21] showed that it is possible to detect within the signature of the DORIS data residuals the effects of large ionospheric perturbations associated with major earthquakes. Besides, a new DORIS receiver was specially built for the CITRIS satellite [6], in order to study ionospheric scintillations in conjunction with GPS data also recorded at very high frequency on board the satellite.
10 Tropospheric sounding using DORIS data
DORIS data are also affected when crossing the lower part of the atmosphere (troposphere). In October 2002, a specific campaign of geodetic observation was organized, called CONT02 [32]. During 15 days, continuous VLBI observations were done in conjunction with nearby GPS observations, DORIS observations and, when available, radiosounding measurements. An extensive study, using the CONT02 data [32], showed that DORIS results are consistent with results derived from geodetic space techniques (VLBI and GPS) as well as with atmospheric models or water vapour radiometer data. DORIS results are only a factor of 2 worse than the GPS results. This is already an excellent result, as the DORIS receivers on ground can perform observations on several satellites simultaneously (typically six to eight) on a continuous basis, while the DORIS ground beacon can only observe during the satellites passes (typically 1 h per day using one satellite at a time). It can be noticed that, thanks to the large of number of GPS data available for each tracking station, GPS can also estimate additional tropospheric parameters (horizontal gradients), taking into account a possible asymmetry of the atmosphere above the tracking station [4]. Furthermore, GPS can also do a full atmospheric tomography (estimating atmospheric parameters at different altitude, instead of estimating only a vertical correction above the ground station) by using a lower-altitude satellite equipped with a GPS receiver [41]. However, GPS results may be affected by systematic effects related to different post-processing techniques for the same time series [34], which may require a complete reprocessing of the whole data set from time to time. The DORIS results do not seem to be affected by these computation artefacts and could serve as calibration for these time series on a limited number of points (DORIS tracking network in collocation with GPS station). This could have some specific goals in the field of climatology (long-term studies). DORIS results for troposphere cannot be used for weather prediction, as the data are only available after several days (typically one month).
11 Conclusions
In conclusion, during the last four years, the applications of the DORIS system exceeded the original applications of precise orbit determination of low earth-orbiting satellites to geodesy (terrestrial reference maintenance) and geophysics (tectonics, vulcanology). These results were not obtained from any major technical modification of the system, but more thanks to the availability of several DORIS satellites and from a better handling of data analysis from the different analysis centres of the International DORIS Service. More recently, new applications within the field of atmospheric sciences also arose, both for ionospheric disturbances detection (potentially related to earthquakes) or for climatology (calibration of long-term GPS-derived time series). Future satellites carrying a new generation of DORIS receivers are also planned in the near future (2008–2009), ensuring the effective availability of long-term geodetic and geophysical time series. Even if DORIS remains a French system, it is clear that an international cooperation is underway, within the scope of the GGOS (Global Geodetic Observing System) of the International Association of Geodesy.
Acknowledgements
This paper is IPGP contribution No. 2270.