

1 Introduction
A number of tropical ice cores have been drilled in the South American Andes, between 0° and 20°S, to document past climate variability. The climate interpretation of the isotopic composition of Andean ice cores (oxygen-18, δ18O)1 is however difficult and still in debate. This is mainly due to the complexity of the tropical hydrological cycle, including a number of processes affecting the isotopic composition of precipitation (convective precipitation, seasonal change of ocean moisture regions, fractionating versus non-fractionating recycling over Amazonia, partial re-evaporation of droplets during fall and re-equilibration with surrounding vapour, orographic obstacles inducing adiabatic cooling and precipitation) [6,18]. In polar regions, it has been shown that a robust relationship exists between surface temperature (T) and the isotopic composition of snow (δ) [13]. However, already in the first global analysis of water stable isotopes in precipitation [4] and reviewed by [18], it was noted that this temperature control breaks down for low latitudes, where cloud systems are dominantly of convective character and the influence of surface or near-surface temperature on the formation of precipitation becomes spurious. Thus, the δ/T covariance breaks down, and the rainout (air mass distillation) becomes the dominant control on isotopic composition, known as the ‘amount effect’ [4].
Despite the complexity of the hydrological cycle and the importance of the ‘amount effect’, a first interpretation of the isotopic composition of Andean ice cores [23–25] was done in terms of temperature as for polar ice cores. Modelling studies using the Atmospheric Global Circulation Model (AGCM) equipped with a water stable isotopes module [2,11,28–30] or recent studies based on direct observations [27] are clearly in disagreement with that interpretation. They show that at both seasonal and interannual timescales, the local precipitation and the degree of rainout upstream the drill sites are prominent factors explaining δ variations. As the previous modelling studies used a low spatial resolution where the Andes are not well represented (grid sizes vary between 125 and 420 km, and the Andes are 2500 m at their highest point), a meso-scale model including water stable isotopes has recently been developed (∼55-km resolution; Andes reach 4500 m) [21]. The first results confirm the strong impact of regional precipitation on the isotopic composition of Andean snow [22].
To increase the number of direct observations that are very scarce in tropical South America and to refine the interpretation of Andean ice cores, a calibration based on modern observations is needed. Thus, IRD (‘Institut de recherche pour le développement’) has set up a regional network monitoring daily and monthly precipitation in Ecuador, Peru, and Bolivia for several years. The goal is to measure the isotopic composition of precipitation and to seek for relationships with local and/or regional meteorological parameters. In this framework, we propose here to examine the first results obtained at the Nuevo Rocafuerte station, located in the eastern part of Ecuador (74.5°W, 0.9°S, 250 m) (Fig. 1). This Amazonian station is the first one of the Ecuadorian network encountered by air masses originating from tropical Atlantic Ocean, via the Amazon basin, before precipitating on the Andean summits [17,27]. Such a calibration, based on direct observations, is needed to correctly interpret the isotopic composition of the ice core extracted in December 2000 from the Chimborazo glacier (78.4°W, 1.3°S, 6268 m). The 54-m-long ice core covers the last 100 years with an annual resolution [16]. Although important post-depositional processes make the palaeoclimate interpretation of chemical records difficult (the snow melting and water percolation induced by the ash deposition from the nearby Tungurahua eruption in 1999 caused a preferential elution and re-localization of certain ionic species), the isotopic profile is still useful before 1999 [16,20].
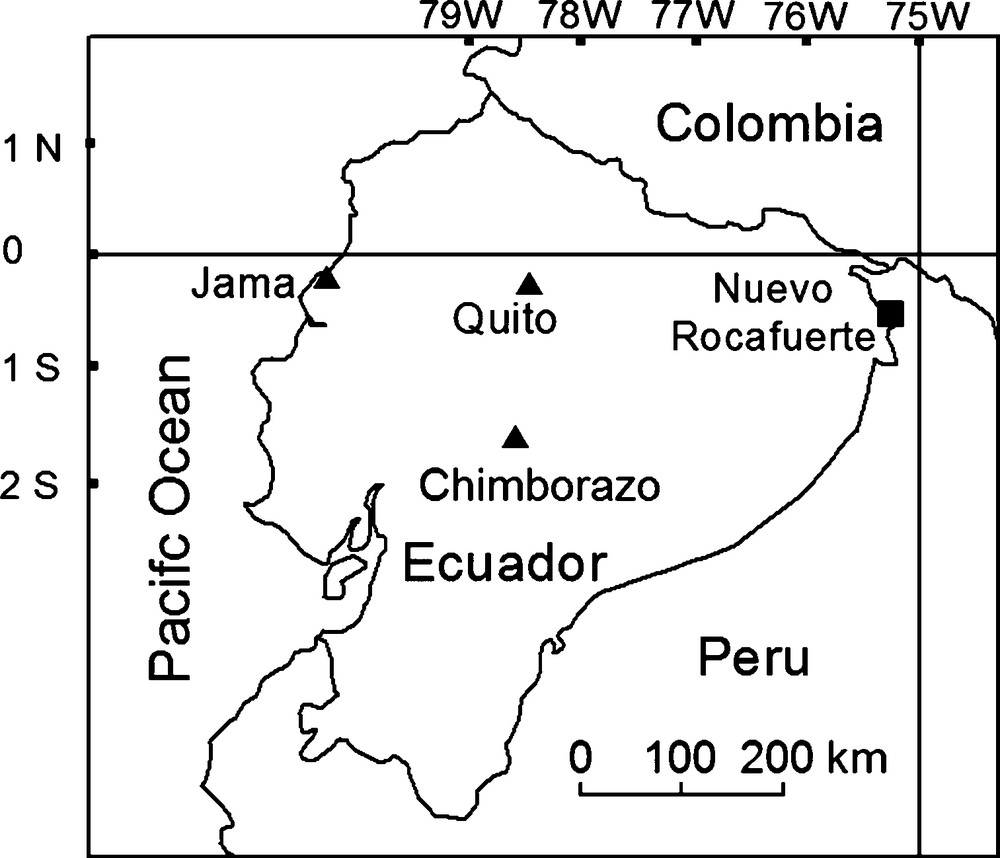
Map of the Ecuador with the location of the Nuevo Rocafuerte station (black square) as well as Quito and Jama cities (black triangles). The location of the Chimborazo glacier is also indicated (black triangle).
Fig. 1 Carte de l’Équateur montrant la localisation de la station de Nuevo Rocafuerte (carré noir) ainsi que la localisation des villes de Quito et Jama (triangle noir). La localisation du glacier Chimborazo est aussi indiquée (triangle noir).
2 Climate characteristics
The intra-annual precipitation variability in Ecuador is complex and mainly controlled by both the marine ITCZ (InterTropical Convergence Zone) seasonal displacement (during austral summer, when the marine ITCZ reaches its southernmost position, precipitation over the continent are located southern, down to 30°S, whereas during austral winter, precipitation zones are mostly located in the North at around 10°N) and the SACZ (South Atlantic Convergence Zone) development from September to March [9], inducing some important contrasts in the precipitation regime from the Amazon basin to the Pacific coast. Along the Pacific coast, we can observe a clear seasonal precipitation distribution with a dry season from May to December (18% of the annual precipitation) and a wet season reaching its maximum from January to March. In the inter-Andean valleys (location of Quito for example), we observe a bimodal precipitation distribution with two precipitation maxima in March–April and October–December. The seasonality is different in the Amazon basin. Precipitation is roughly regular all over the year with the highest values occurring from March to August (67% of total precipitation) and a minimum around January. The annual mean precipitation in the Amazon basin is high (2500–3000 mm/year) (although the highest precipitation amounts are observed along the Andean slopes above 1000 m (around 4500 mm/year)) compared with the annual mean precipitation in the Western area, varying between 400 and 1400 mm/year, except along the Andean slopes [9]. The regular precipitation in Ecuadorian Amazonia arises from the almost permanent convective cells over the year, reflecting the quasi-permanent maximum continental rainfall almost in line with the marine ITCZ with higher convection between March and August and the SACZ (South Atlantic Convergence Zone) development from September to March [9], both intercepting the Nuevo Rocafuerte station area (see, for example, Fig. 6 in [27]).
Here, we present the first results that we have obtained at the site of Nuevo Rocafuerte, located in the equatorial eastern area of the Amazon basin (Fig. 1). As mentioned above, this site shows a rather regular precipitation all over the year (monthly precipitation varies from 120 to 330 mm over the 1965–2002 period), with a maximum (minimum) from April to June (December and January) (Fig. 2). The averaged annual mean precipitation for that site from 1965 to 2002 is 2760 mm/yr.
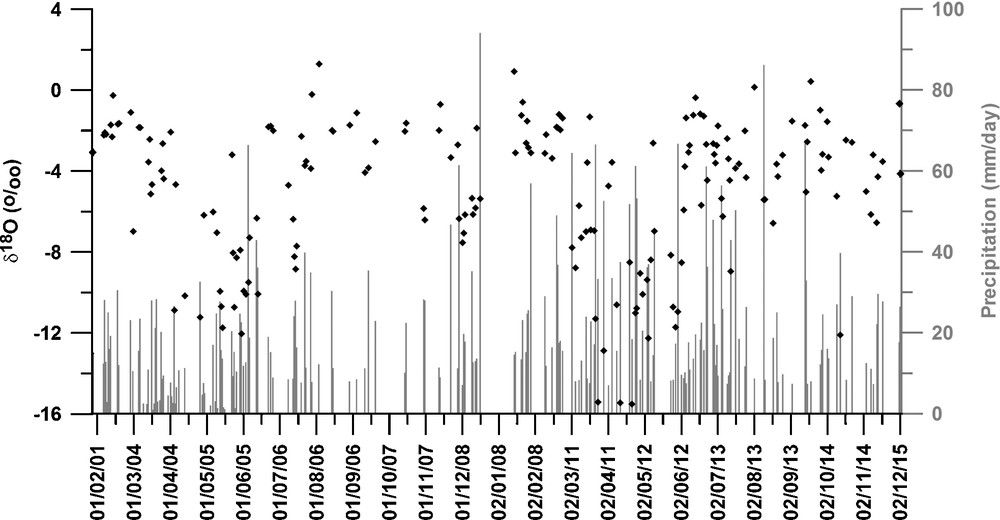
Daily isotopic composition of precipitation (δ18O in ‰, black diamond) and precipitation amount (mm/day, grey bars) at Nuevo Rocafuerte from February 2001 to November 2002.
Fig. 2. Variation de la composition isotopique journalière des précipitations (δ18O en ‰, losange noir) et des précipitations (mm/jour, barres) à Nuevo Rocafuerte, de février 2001 à novembre 2002.
Daily precipitation at Nuevo Rocafuerte has been collected since February 2001. Samples are collected every day at 7:00 am and thus it is important to note that, although some samples can be collected 24 h after the precipitation event, our pluviometers are specific (plastic pluviometer with very little holes) to limit evaporative processes inducing kinetic fractionations. The robustness of those pluviometers has been checked and, as it is shown in Vimeux et al. [27], no alteration of precipitation can be detected. It is also worth noting that precipitation samples lower that 7 mm are not measured. The main reason is that small precipitation events (1–3 mm) are likely to be altered by partial evaporation of droplets under the cloud during the fall in an unsaturated environment. We chose a threshold at 7 mm so that measured samples represent 90% of total precipitation events. Thus, our study and our calculations for the monthly scale are significant. δ18O has been measured between February 2001 and November 2002 (22 months). All δ18O measurements were performed at the IPSL/LSCE (‘Laboratoire des sciences du climat et de l’environnement’) with an accuracy of ±0.05‰ and are given versus V-SMOW (Vienna-Standard Mean Ocean Water).
It is worth noting that: (1) 2002 presents a monthly precipitation distribution that is very close to the mean seasonal cycle calculated from 1965 to 2002, except a very wet period in July (455.9 mm, whereas the monthly mean for July from 1965 to 2002 is 282 mm); (2) the year 2001 is rather dry (2018 mm of precipitation), mainly because of a drier season from May to October (45% of total precipitation occurs during this period in 2001 versus 56% for the same period averaged over the 1965–2002 period) and low precipitation in April and May (16% of total precipitation occurs during this period in 2001 versus 22% over the 1965–2002 period).
3 Results and interpretation
3.1 Daily timescale
Daily δ18O (hereafter, δRoca) varies between +1.56‰ and −15.51‰ (Fig. 2) with a highest day-to-day variability of 9.60‰. Two periods of depleted isotopic compositions are shown in May 2001 (the lowest value is −12.91‰) and in April 2002 (the lowest value is −15.51‰). Although we can observe strong depleted isotopic values corresponding to strong local precipitation events (for example, for 31 March 2002 and 4 April 2002, δRoca are −11.30‰ and −12.87‰ respectively, corresponding to daily precipitation amounts of 66.5 and 52.6 mm, respectively), it is not the case when considering a group of continuous depleted isotopic values: for example, between 27 May and 9 June 2001, the isotopic composition of precipitation is always lower than −7.90‰, whereas the precipitation amount varies from 1.4 to 66.4 mm.
We have calculated the covariance between the isotopic composition of precipitation and the local meteorological parameters (precipitation, temperature, and relative humidity). No significant correlation can be found between δRoca and daily precipitation: r2 = 0.07 (n = 185) – for example, if we consider only δRoca values for 10 < P < 11 mm, they vary between −1.98 et −10.16‰) (Fig. 2). Thus, if local precipitation could explain some of the much depleted precipitation events, other factors have to be explored to explain the observed δRoca variability. However, the correlations between δRoca and local temperature and relative humidity are even much lower (r2 = 0.01 and 0.04, respectively).
As we know that the convective activity mainly occurs during the afternoon [5], we have also calculated the same correlations with only an afternoon-averaged meteorological parameters (collected every 12 min for temperature and relative humidity), but they are not significant either.
The main point arising from that section is that local rainout (or temperature) is not able to explain many aspects of the δRoca variability in the daily precipitation at Nuevo Rocafuerte.
An intriguing observation is that a strong seasonal cycle is clearly shown on δRoca with strong depleted values in April and May, as mentioned above, whereas precipitation is somewhat regular (Fig. 2). This leads us to think that δRoca could be controlled by regional parameters exhibiting a strong seasonal cycle, by atmospheric circulation seasonal changes or by changes in the moisture source's origin. In the next section, we examine the influence of moisture transport history and the degree of rainout upstream as potential important factors to explain seasonal δRoca variations.
3.2 Monthly scale
3.2.1 Influence of local parameters
In Fig. 3a, we show the monthly isotopic signal at Nuevo Rocafuerte, calculated by weighting the daily δRoca by precipitation. It varies from −1.12‰ to −10.93‰, with depleted (enriched) values during the wet (dry) periods. It is worth noting at that stage that if the ‘amount effect’ is the first process that could explain such a seasonal variation, a number of fractionating processes are likely to be superimposed. First, partial evaporation of droplets during fall in unsaturated downdrafts, or in a dry atmosphere, induces a kinetic fractionation providing enrichment in heavy isotopes of the water [4,18,19,26]. Moreover, we know that precipitation is strongly recycled over Amazonia (50%), providing enriched water to air masses that counteracts the amount effect. If recycling varies from one season to another and impacts δRoca, we should observe a specific δRoca/P slope. Actually, a strong recycling during the dry season will lead to increase the seasonal amplitude of the seasonal cycle, independently of the precipitation variation, and thus it will artificially increase the δRoca/P slope. Recycling can be non-fractionating (transpiration and complete re-evaporation of canopy-intercepted water); however, stagnant waters (lake, river) evaporation and partial evaporation from canopy interception will induce a kinetic fractionation. The measure of deuterium excess (d = δD – 8 × δ18O) in the future will certainly help us to distinguish those two types of fractionations.
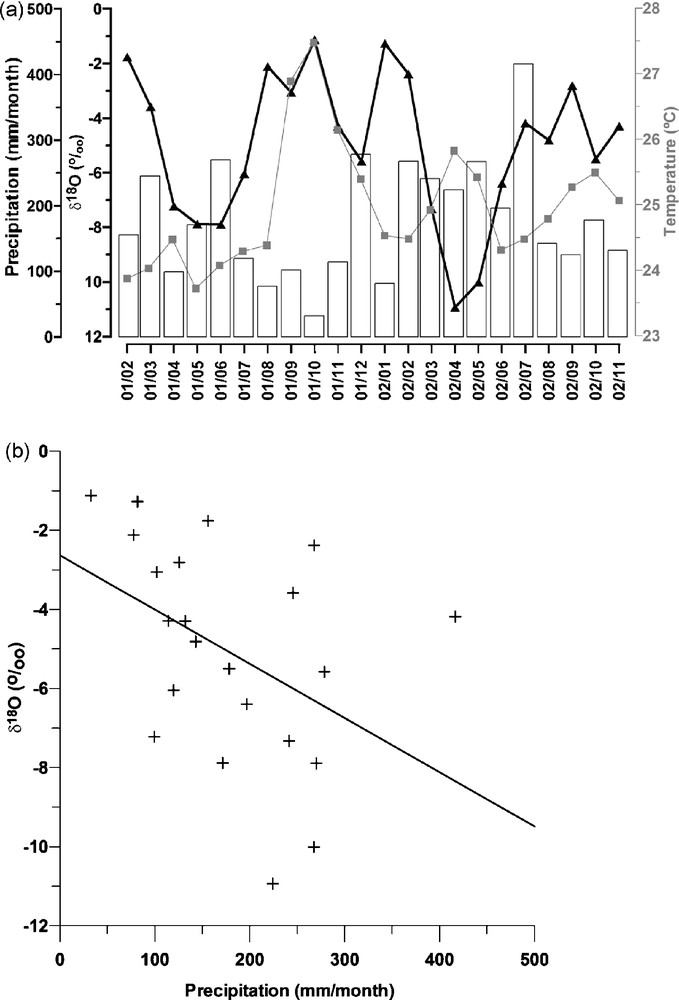
(a) Monthly isotopic composition of precipitation (δ18O in ‰, dark line with triangle markers) along with precipitation (mm/month, bars) and temperature (°C, grey line with square markers) at Nuevo Rocafuerte from February 2001 to November 2002. (b) Monthly isotopic composition of precipitation (δ18O in ‰) versus precipitation (mm/month) at Nuevo Rocafuerte from February 2001 to November 2002.
Fig. 3. (a) Variation de la composition isotopique mensuelle des précipitations (δ18O en ‰, ligne noire avec carrés) à Nuevo Rocafuerte, de la précipitation (mm/mois, histogramme), et de la température (°C, ligne grisée avec triangles), de février 2001 à novembre 2002. (b) Composition isotopique mensuelle des précipitations (δ18O en ‰) en fonction des précipitations (mm/mois) de février 2001 à novembre 2002 à Nuevo Rocafuerte.
Regardless, the δRoca/Pmonthly correlation is very low and only explains 24% of the total δRoca signal (r2 = 0.24) (Fig. 3b) (similarly, r2 is 0.03 and 0.15 with temperature and relative humidity respectively). The δRoca/Pmonthly slope is −0.014‰/mm, which is comparable with results obtained by Vimeux et al. [27] for a group of stations located at the base of the Bolivian Andes at a similar altitude.
As we know that the isotopic composition of precipitation is an integrated parameter reflecting the history of all the air masses in terms of fractionation and the degree of rainout upstream the site of precipitation collection, we seek in the next section for regional parameters that could control the isotopic composition of monthly precipitation at Nuevo Rocafuerte.
3.2.2 Influence of regional parameters
Recent studies in tropical Andes based on both direct observations and modelling studies, including water stable isotopes, have shown that rainout upstream the Andes, over Amazonia where convective intensity is maximum, is the predominant factor controlling the isotopic composition of precipitation at the seasonal and interannual timescales [8,10,11,17,27].
We thus propose to compare our isotopic record with regional precipitation. First, we use a proxy of deep convection: OLR (Outgoing Longwave Radiation) flux, hereafter OLR. OLR is regularly used to locate areas of deep tropical convection and as a proxy of precipitation by identifying the presence of cold cloud top [1]: low OLR values correspond to cold and high clouds that denote enhanced convection, and an inverse relationship generally holds between OLR and convection [1]. The data used in this study are from the National Oceanic and Atmospheric Administration (NOAA) polar-orbiting satellites [7,12]. They are available from February 2001 to November 2002 at a 2.5° latitude/longitude resolution and, in contrast to isolated station data, OLR data have the advantage of being spatially homogeneous. Thus, we can reliably compare the correlation between δRoca and various OLR from one region to another. Second, we use the NCEP precipitation reanalyses for comparisons with δRoca. The advantage of using such data is that we will be able to calculate δRoca/P slopes for comparison with the local slope. Actually, it is worth noting that the NCEP data do not offer a rigorous representation of convective zones in tropical South America [3,15]; however, a comparison over 2001 and 2002 with a merged satellite precipitation data set acquired as part of the Tropical Rainfall Measuring Mission (TRMM) [14] shows a rather correct spatial distribution of convective zones.
First, we have calculated the correlation between δRoca and OLR in the grid including the Nuevo Rocafuerte station (73.75°W, 0°S): r2 = 0.32 (Fig. 4a), which is significantly higher than the correlation found with local precipitation (r2 = 0.24). This difference could arise from the fact that OLR in that grid is already a regional average of precipitation that may be more representative of the regional controls on δRoca. Actually, the correlation between OLR and precipitation at Nuevo Rocafuerte in that grid is not significant. Therefore, we have calculated the same correlation using OLR in both close and remote grids from Nuevo Rocafuerte (Fig. 4a). Although correlations with grids located southward or eastward are low (<0.32), significant correlations are obtained at sites located northward and northeastward from Nuevo Rocafuerte, along air mass trajectories from the tropical Atlantic ocean with maxima of 0.72, 0.67, and 0.65 for the grids at a latitude of 2.5°N and centred at 63.75°, 61.25°, and 58.75°W, respectively (Fig. 4a). This clearly illustrates the key role of the degree of rainout upstream as a more important factor to explain the monthly δRoca variability than local precipitation.
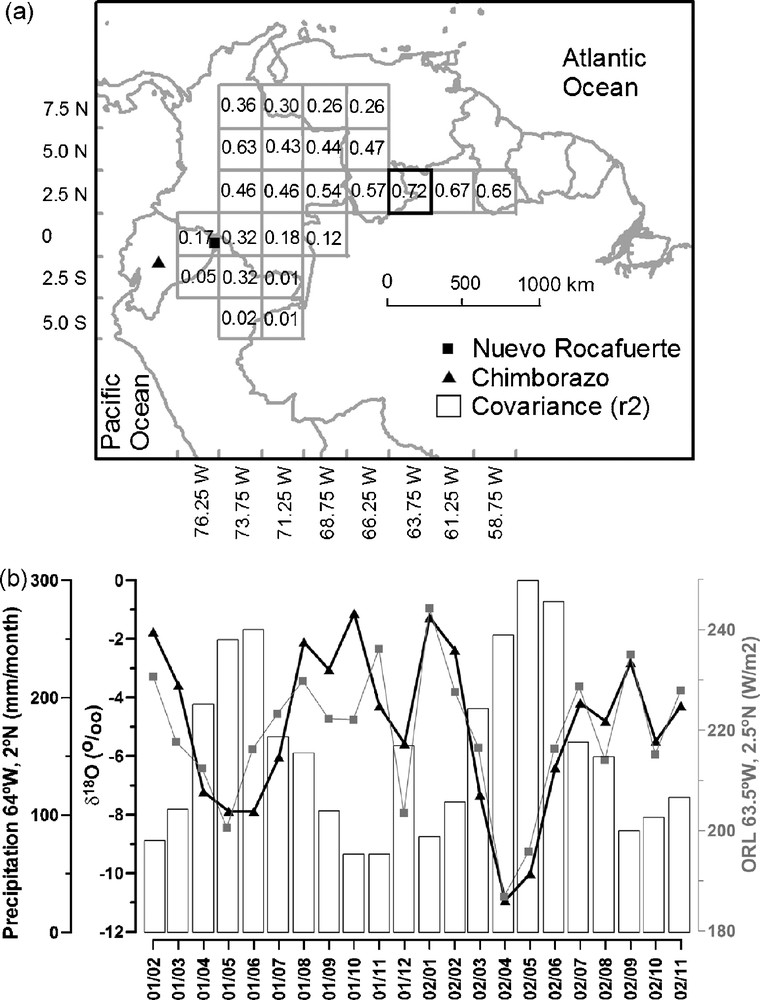
(a) Spatial distribution of covariance (r2) between monthly isotopic composition of precipitation (δ18O) at Nuevo Rocafuerte and OLR flux (W/m2) in the grid where the correlation is indicated. (b) Monthly isotopic composition of precipitation (δ18O in ‰, dark line with triangle markers) at Nuevo Rocafuerte along with the OLR flux in the (63.75°W 2.5°N) grid (W/m2, grey line with square markers) and NCEP precipitation in the (64°W, 2°N) grid (mm/month, bars).
Fig. 4. (a) Distribution spatiale des coefficients de corrélation (r2) entre la composition isotopique mensuelle des précipitations (δ18O) à Nuevo Rocafuerte et l’OLR (W/m2) dans la maille où la corrélation est indiquée. (b) Variation de la composition isotopique mensuelle des précipitations (δ18O, ligne noire avec carrés) à Nuevo Rocafuerte, de l’OLR (W/m2) mesuré dans la maille (63,75°O, 2,5°N) (ligne grisée avec triangles) et des précipitations NCEP sur la maille (64°O, 2°N) (mm/mois, histogramme).
The same analysis has been done with NCEP re-analyses precipitation, available at the 2° × 2° resolution and, again, high correlations are found with precipitation upstream and the highest correlation (r2 = 0.72) is found with precipitation averaged in the (64°W, 2°N) grid, assuming to be similar to the (63.75°W, 2.5°N) grid used in the previous paragraph, with a slope of −0.032‰/mm. However, the δRoca/PNCEP covariance for the grid including Nuevo Rocafuerte is significant (r2 = 0.54). Similarly to what we observed in the previous paragraph, NCEP precipitation on that grid should reflect an average value of precipitation around the Nuevo Rocafuerte site.
We now examine the monthly temporal evolution of OLR and NCEP precipitation in the grids of highest correlation compared with δRoca (it is worth noting the significant correlation between NCEP precipitation and OLR at that spatial scale, r2 = 0.53) (Fig. 4b). As expected, depleted isotopic values correspond to low OLR (and high precipitation) in Amazonia (from February to May), in agreement with our interpretation.
We thus wonder whether a similar control exists at the daily timescale. We again use the daily OLR data, available at 5° × 5° resolution, and compare with daily δRoca. Fig. 5 shows that the correlation of daily δRoca with OLR in the (62.5°W, 2.5°N) area, including the (63.75°W, 2.5°N) grid, is poor (r2 = 0.07). However, the correlation increases up to r2 = 0.18 (n = 185), with a three-day delay, corresponding to time for moisture transport from the Amazon basin to Nuevo Rocafuerte. Indeed, the NCEP wind reanalyses over the 22 months show that, over 15 months, including wet seasons, the wind direction between Nuevo Rocafuerte and the (62.5°W, 2.5°N) grid is northeastward, with a speed of 3 m/s at 850 mbar. Thus, it takes about four days for the water vapour parcel to travel from the (62.5°W, 2.5°N) grid to Nuevo Rocafuerte (the distance is 1075 km). In conclusion, it appears that at daily timescale, the regional precipitation is also a more important factor than the local precipitation to explain δRoca variability, although the major part of the isotopic variability is still not explained.
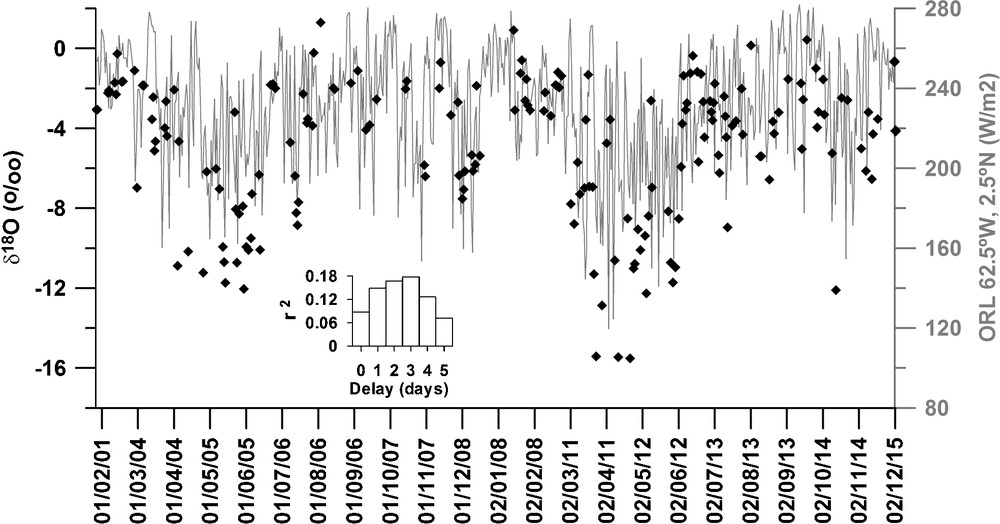
Daily isotopic composition of precipitation (δ18O in ‰, black diamond) at Nuevo Rocafuerte along with the OLR flux (W/m2) in the (62.5°W, 2°N) grid (grey line) with a three-day delay. The insert (bars) show the covariance (r2) between daily δ18O and the OLR flux in the (62.5°W, 2°N) grid for various delays between the two parameters (x-axis, from 0 to 5 days).
Fig. 5. Variation de la composition isotopique journalière des précipitations (δ18O en ‰ ; losange noir) à Nuevo Rocafuerte et de l’OLR (W/m2) sur la maille (62,5°O, 2,5°N), avec un décalage de trois jours (trait grisé). Le sous-graphique (histogramme) montre les corrélations (r2) entre δ18O et l’OLR journaliers dans la maille (62,5°O, 2,5°N), avec un décalage entre 0 et 5 jours entre les deux paramètres (axe des abscisses).
4 Conclusion
We have shown that local surface meteorological parameters (T, P, h) are not able to explain the isotopic composition of precipitation (δ18O) at Nuevo Rocafuerte both at daily and monthly timescales. Using satellite data and observations (NOAA OLR and NCEP re-analyses), we demonstrate that the moisture transport history and the degree of rainout upstream, in strong convective Amazonian areas, are more important factors explaining seasonal δ18O variations. The monthly correlation between δ18O and precipitation (convection) in the (62.5°W, 2.5°N) area is robust and can explain up to 72% of δ18O variations from February 2001 to November 2002. However, we should explore in the future the influence of air mass trajectories’ seasonal variations, given that seasonality of precipitation at Nuevo Rocafuerte is low. It is worth noting that this kind of comprehensive study has been done in Bolivia, leading to similar results, i.e. demonstrating the key role of Amazonian convection in controlling the δ18O of Andean precipitation [27]. Although we do not have a strong conclusion for the daily timescale, the major part of the δ18O remains unexplained, although our results suggest that regional precipitation upstream is also an important factor controlling δ18O.
A very recent study using a mesoscale model including a module with water stable isotopes has shown that at pentad scale (five days), δ18O in the Andean precipitation integrates both circulation and precipitation variability mainly arising from the South American Monsoon System [31]. Thus, one perspective of our work is to explore those model results for Ecuador.
Moreover, we are aware that our study deals with a unique station providing only a 22-month-long isotopic record and, therefore, we do not claim to propose here a comprehensive calibration of the isotopic composition of modern Ecuadorian precipitation. A larger network in Ecuador has been set up for more than five years now, collecting daily precipitation, and we thus have to further valid our results over the different stations to explore the isotopic composition of the Chimborazo ice. Moreover, the measurements of both isotopes (deuterium and oxygen-18) would enable us to calculate the deuterium excess to further discuss the different recycling events that may affect the isotopic composition of precipitation and to further examine the impact of changes in moisture source origin. If our results are confirmed by those next studies, we hope to reconstruct past precipitation variability from the Chimborazo ice core, covering the last century with a seasonal resolution. We could compare it with precipitation records already obtained from Bolivian and Peruvian ice cores, which show that over the last 100 years, precipitation variability in southern Amazonia is very homogeneous, and primary reflects the main phases of ENSO (El Niño Southern Oscillation) [11].
Acknowledgements
We would like to thank the two anonymous reviewers for their valuable comments. MV thanks Michel Stiévenard for his help for oxygen-18 measurements. OLR and NCEP reanalyses are available on the NOAA Climate Diagnostics Centre website. The present study was supported by IRD (“Institut de recherche pour le développement”, France) and by a grant from the French national program Amancay (INSU/PNEDC).
1 δ18O (‰) = (Rsample/RSMOW – 1) × 1000 with R = O18/O16, δ is in ‰ relative to the V-SMOW (Vienna-Standard Mean Ocean Water).