

Human populations have overall resisted in the past, more or less successfully, to a number of adverse contexts or phenomena, such as climate changes. The population of the world has grown rather regularly, with periods of stagnation and some fluctuations, but probably with no period of collapse or severe decline. Of course, this does not mean that local populations never decreased or collapsed even. We will first review data available on the world population over the last 70,000 years and some possible factors at play, and look at the main projections for the next 50 or 150 years.
1 The world population over the last 70,000 years
1.1 The world population from prehumans to humans
The major steps leading to what is called now the “human population” include Homo habilis, who appeared about 2.5 millions years ago. It was followed by the first Homo erectus, around 1–1.5 million years before present (BP). Homo sapiens developed in Europe (Neanderthal) and Java around 100,000 BP, Cro-Magnon round 30,000 BP and finally Homo sapiens sapiens (us) about 40,000 years ago. This last development coincides with the major technical innovations in hunting weapons of the Late Paleolithic, which very likely favoured rapid population growth. Estimating the sizes of these populations of prehumans and humans is not easy. The most common technique combines data from archaeological sources showing which parts of the Earth were likely to be populated with estimates of density derived from hunter-gatherer populations observed in modern times. They also include information on major climatic changes and on the physical or genetic transformation of the species. Estimates may differ notably: 8000 years ago, the population was around 250,000 according to Cook [5], six million according to Biraben [2], and between five and 10 million according to Durand [7]. According to the demographer and historian Biraben, the world population may have risen from less than one million to four or five million in about 5000 years (Fig. 1).
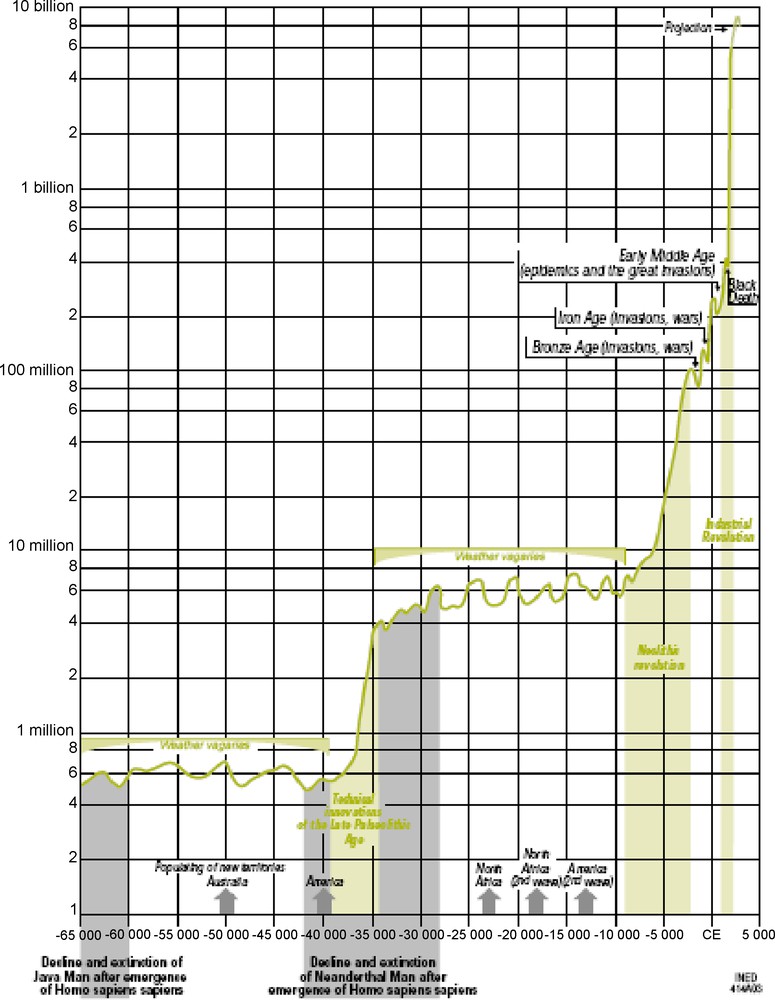
The world population over the last 65,000 years, from [2].
La population mondiale au cours des 65 000 dernières années, d’après [2] .
The next step took place 30,000 years later with the Neolithic revolution, between 12,000 and 8000 BP. This is when agriculture was invented, changing the traditional hunter-gatherers into sedentary farmers and allowing for a population of new urban residents living on trade, craftsmanship, private and public services. The direction of causality might however be discussed: those who think that demographic pressure might also force societies to improve their productivity dispute the fact that a more rapid population growth might always be due to technical innovation [3]. The lack of informations on the detailed chronology of events makes it difficult to choose between the two theses. Whatever the causality, modern economy was born, the first environmental damage occurred, and the population of Earth rose to something like 100 million (about 4000 years ago), starting a long period of growth.
The annual rate of growth during this Neolithic period was probably modest however: 0.07%, with a doubling time of around 1000 years. At the start of the Christian era the world population might have reached 200 million. The next centuries were periods of growth with temporary declines. The world population might have topped 500 million at the start of the 16th century. At the beginning of the 20th century it reached 1.6 billion and started a phase of accelerating growth: the rate of growth peaked at 2% in the 1960s and declined thereafter. In 2000, the population reached six billion and the annual rate of growth was 1.3%.
1.2 Nonlinear growth
Fig. 1 shows possible fluctuations over the past 40,000 years. Their magnitude is difficult to assess and the graph (drawn with a log scale!) aims simply to illustrate some rather well-documented episodes of climate change – wars, famines or epidemics – that have very likely induced a reduction in the total population. We have some reliable estimates of the impact of specific events, such as the plague in Europe during the 14th century: up to 30–50% of the population may have disappeared in some parts of Europe. The Chinese population may have endured a similar reduction around AD 70 due (probably) to a smallpox epidemic [4]. But such disasters rarely concerned the entire world population at the same time and their impact on the world total remained limited.
The population successfully withstood the major changes that have affected climate over time. Homo neanderthalensis overcame a series of glaciations between 100,000 and 30,000 BP, such as those well-documented in the Alps round 100,000, 80,000, 45,000 or 32,000 BP [1,12]. The last ice ages were, however, followed by a period of abrupt and global climate change episodes, the ‘Heinrich Events’. If we add that the sea level has risen by more than 100 m since the last Ice Age, we can imagine that such events must have greatly disturbed the populations settled in many parts of the Earth. The Neolithic era might have been an adaptive response to these crises.
The reasons why well-developed civilisations such as the Maya suddenly collapsed are not well known. Limitations in food or water availability might have played a role, together with more social or political causes. In Europe, a “Little Ice Age” took place between 1590 and 1850 (temperature drop of one or two Celsius). The European population, however, grew from 85 million in 1500 to 200 million in 1800 and 420 million in 1900.
1.3 Adaptation and recovery mechanisms
If populations are able to surmount periods of decline, this is doubtless due to a variety of mechanisms allowing for recovery. Demographers, historians and economists have suggested such possible mechanisms.
In the prehistoric ages, the main response to an external aggression was migration. Climate changes had direct effects on the nature of the soil, e.g. whether it was frozen or not, thus on the plants and animals that could live on it, and thus on the humans who depended on these plants or animals for food. Moving to the south or to the north was a rather natural decision for hunter-gatherers with no permanent settlement, as long as unpopulated spaces remained available.
In populations of the past, marital fertility was usually at its maximum and just balanced the level of mortality. ‘Maximum’ does not refer to a biological (and somewhat theoretical) maximum, but to a situation where fertility was not directly controlled by the couples but still limited by some behavioural and physiological parameters, such as the practice of breastfeeding. Increasing fertility after a demographic crisis was thus not possible, except under specific circumstances. But the rules of marriage could leave some room for fluctuations in the overall level of fertility. One rather well-documented case is that of prerevolutionary France (but this applies also to other western European countries, such as Italy). One striking situation of the North of France, was the great stability of settlements in terms of cities, villages and even farms between 1328 and 1713, despite episodes of Black Death and the Hundred years War [6]. Most of the land that could be cultivated was already in use, under various types of tenure, and thus almost no new settlement was possible. The dominant form of family at that time was the nuclear one, where people getting married had to quit their parental family and settle somewhere else. In practice, this means that they had to wait for a free tenancy, which occurred mostly when a tenant deceased. The level of mortality thus determined the age at marriage, which was rather high: round 27–28 years for men, and 25 years for women. If mortality suddenly increased because of some crisis (epidemic, famine, war…) then more tenancies were made available and people could marry at younger ages. Starting their reproductive life earlier, they had more children and they thus made up, at least partially, for the losses due to the crisis. This process has been quantified, for instance by Livi-Bacci [13] for Tuscany in the same period. This author has shown that a mortality increase of up to 50% over one year could be made up for. Fig. 2a shows that such crises were rather frequent during the 17th and 18th centuries: the mean interval was most often round 30 years, meaning that they were occurring at least once per generation. More severe crises, resulting in a doubling of the number of deaths during a year, were also not uncommon (Fig. 2b).
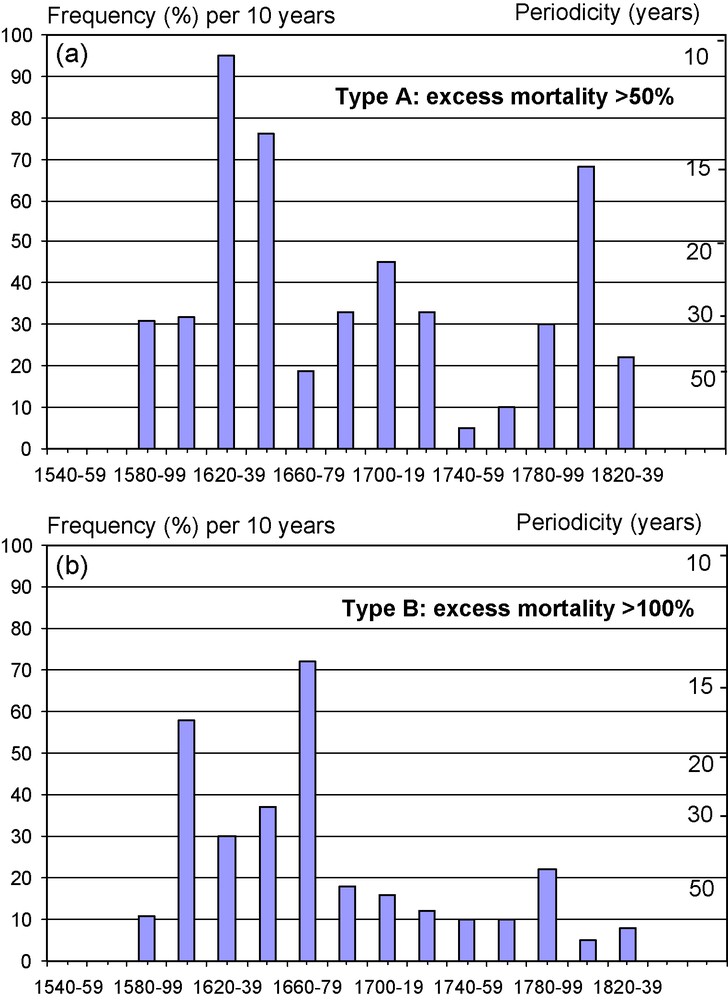
(a) Frequency of demographic crises in Italy, 1560–1840: crises of Type A (excess mortality over 50%), from [13], redrawn by present author. (b) Frequency of demographic crises in Italy, 1560–1840: crises of Type B (over 100% excess mortality), from [13], redrawn by present author.
(a) Fréquence des crises démographiques en Italie, 1560–1840 : crises de Type A (supplément de mortalité dépassant 50 %), d’après[13], redessiné par l’auteur. (b) Fréquence des crises démographiques en Italie, 1560–1840 : crises de Type B (supplément de mortalité dépassant 100 %) d’après[13], redessiné par l’auteur.
This mechanism was based on a late age at marriage, an unusual situation in many traditional societies. In most cases it was not possible to make up rapidly for a demographic crisis. Le Bras [9], for example, has estimated that a population subjected to 75% excess mortality at age 30 years could stabilize at half its precrisis size (and later start growing again if fertility exceeded mortality). In demographic terms, a ‘crisis’ results from an excess of 10–20% in the number of deaths and can be surmounted, while a ‘catastrophe’ resulting from excess mortality of over 30% cannot.
Several (and sometimes contradictory) examples of homeostatic models have been developed, such as those linking the rate of population growth to its density (and thus to its current size), the relation being often mediated by the cost of food (crop prices) or the level of wages. A negative correlation between fertility, the main determinant of population growth when mortality is stable, and density is indeed frequently observed. Under homeostatic conditions, a reduction in population size for some external reason would ease the pressure on food and thus facilitate a new episode of demographic growth. Lee [10] has estimated that after a reduction of 20%, a population could make up for half this amount within two generations (70 years). A long era of random fluctuations is however also possible [10]. In a study on a contemporary sub-saharan population, Lutz [14] has suggested a shorter period of recovery (10–15 years) after a shock of −20% on the population size.
Climate can be entered into the picture, though experts often conclude that the impact on population should not be large [16]. There are positive correlations between warm winters and population growth, as well as negative correlations in case of hot summers [8]: one degree more in winter could translate into +0.1% for the population rate of growth. This is not much, but the mean rate of growth of the world population was below 0.1% before the last 1000 years!
All in all, we must keep in mind that the greatest danger for a population was most often not the climate. Epidemics have led to severe disasters: the Black Death in Europe during the 14th and 15th centuries; the populations of South and Central America almost disappeared when smallpox was imported from Europe, between the 16th and the 19th centuries; three waves of cholera killed 400,000 French people in the second half of the 19th century; Spanish influenza increased French mortality again in 1919 by as much as a year of the disastrous First World War… Wars themselves contributed too often to high mortality peaks everywhere in the world: the death toll of World War One in France was equal to the size of two birth cohorts, and the deficit of births was as large. Famines also struck populations repeatedly. Examples include those in Europe (years 1032–1033, 1315–1317, 1335–1338…) which are well-documented; or in Bengal in 1943 and 1974, in the Soviet Union in the 1930s; or in China in 1959–1961: the ‘Great Leap Forward’ resulted in a rise in deaths and a deficit of births equivalent to the First World War in France, in proportion to the total population (the absolute values were 10–15 times higher). Finally, these three scourges often occurred simultaneously or in rapid succession.
2 The next 150 years
Forecasting the size of the world population in 20 or 50 years became a feasible exercise when valid data on current populations of almost all countries became available. Three conditions must be met to make a reasonable projection at the world level: the projection has to be made by aggregating projections performed at the country level; the sizes of the populations at the starting point must be known; and good arguments for projecting mortality and fertility in each country must be available. The United Nations Population Division made the first projections of this type in 1950. The projected populations for the next 30 years soon had to be revised upwards by 20%, because the initial population had been underestimated. The forecast was repeated at intervals varying between three and six years until 1978, every second year thereafter. The world population projected for year 2000 was finally rather well-estimated in these projections, the observed value being 6.1 billion (Fig. 3). Meanwhile, the Population Division was able to detect a unique and crucial event in the history of human population: a peak in the rate of growth was reached in the mid-1960s and the growth decelerated in the following years (1.2% per year today). When fertility started to decline in less developed countries, however, the speed of this change was underestimated: long range central projections for years 2050 and 2100 had to be revised downwards by 15% between 1973 and 1996.

The series of United Nations projections, 1950–2000 (medium variants), from [11].
La série de projections des Nations unies, 1950–2000 (variante « médium »), d’après [11] .
When good data are available on the current size, mortality and fertility levels of a population, forecasting the likely size of the population over the next 20 or 30 years is a rather easy task. Mortality rates usually change slowly, and mortality tends to concentrate on high ages (60 or 70 years), leaving little uncertainty for the projection of all cohorts under these ages. Fertility can change more rapidly, in both directions, but the error on the number of births affects only a small part of the pyramid, exactly the n younger cohorts for a projection over n years. After about 30 years the range of error is increased because the women born at the end of the n years start having children themselves: their behaviour has to be forecasted, which is a difficult task when the individuals concerned will spend all their life in a totally new environment. For a projection at 100 years we must predict the reproductive behaviour of women currently in their reproductive ages, but also of their daughters (in 30 years), grand-daughters (in 60 years) and great-grand-daughters (in 90 years). Within 100 years, the population will have been (almost) totally renewed and four different generations of women will have contributed to the annual births… Beyond this limit, projections become a mere technical exercise, quite easy to perform but saying nothing on any likely future: a slight error in one of the parameters has an enormous effect on the size of the population, as can be seen on Fig. 4. In this United Nations (UN) projection [18], the “high-medium” and the “low-medium” differ only by plus or minus 10% in the level of fertility to be reached in 2030 and maintained beyond (2.3 and 1.9 children per woman respectively, 10% above and 10% below the replacement level of 2.1). After 100 years, the projected world population would be twice as large in the first hypothesis as in the second one: 14.6 against 7.2 billion in year 2100; after 150 years the ratio would be close to 3.
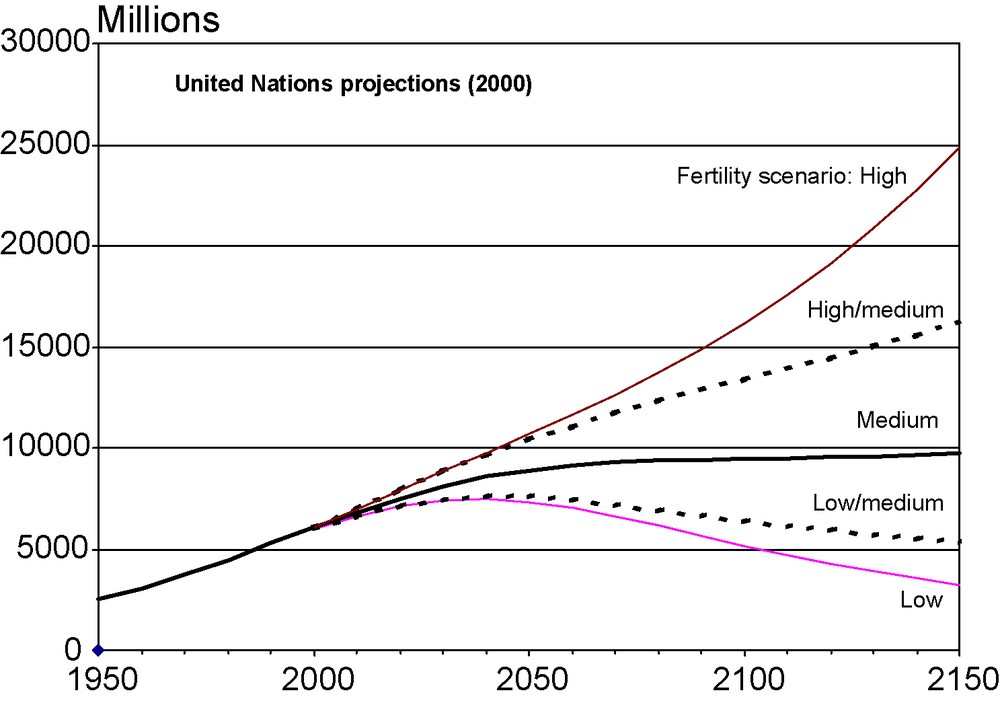
Variants of the United Nations projections (2000), from [18].
Variantes des projections des Nations unies (2000), d’après [18] .
Migrations are taken into account at the national level (the net balance is zero at the world level!), but the annual rate rarely exceeds 0.5%. The global net migration rate circa year 2000, for all more developed regions, was 0.2%; the net rate was minus 0.05% for less developed regions. According to the UN scenarios, the rates will be even lower in 2040–2050.
2.1 2050–2100: stabilization of the world population?
Various scenarios are usually explored in population projections. They differ mainly by the assumption made on the speed of change for fertility. In the past, the actual trend in world population came pretty close to the ‘medium’ scenario of the UN projections or somewhere between this scenario and the immediately lower scenario. It is now forecasted, still under the medium scenario, that the population should reach a maximum around 2075 (9.2 billion) and decline slowly thereafter [19].
Other institutions have made their own projections. They are all based on the same data and use the same methodology; they differ only by the speed of decrease for fertility. Fig. 5 shows the central projections performed by the World Bank in 1994, the International Institute for Applied Systems Analysis [15] and the UN in 2000 (base 1998). For year 2100, the projected population is respectively 10.96, 10.35 and 9.46 billions. The IIASA projection includes an attempt to estimate “confidence intervals” for the projections, based on the assumptions of experts. Each expert defines certain fractiles (e.g. upper and lower five percent) within a chosen form of statistical distribution for the projection of a given population at a given date. The combination of these subjective probability distributions forms a global probability distribution. The subjective and independent character of the approach of the various experts is not really compatible with sound statistical methodology and will certainly disqualify the study for many statisticians. If we look at the results, however, the 95% confidence interval for the 2100 projection is 6–17 billion and the 60% interval is 9–12.5 billion. It is the same order of magnitude as the difference between the UN ‘high and medium’ hypotheses and ‘high/medium and low/medium’ hypotheses.
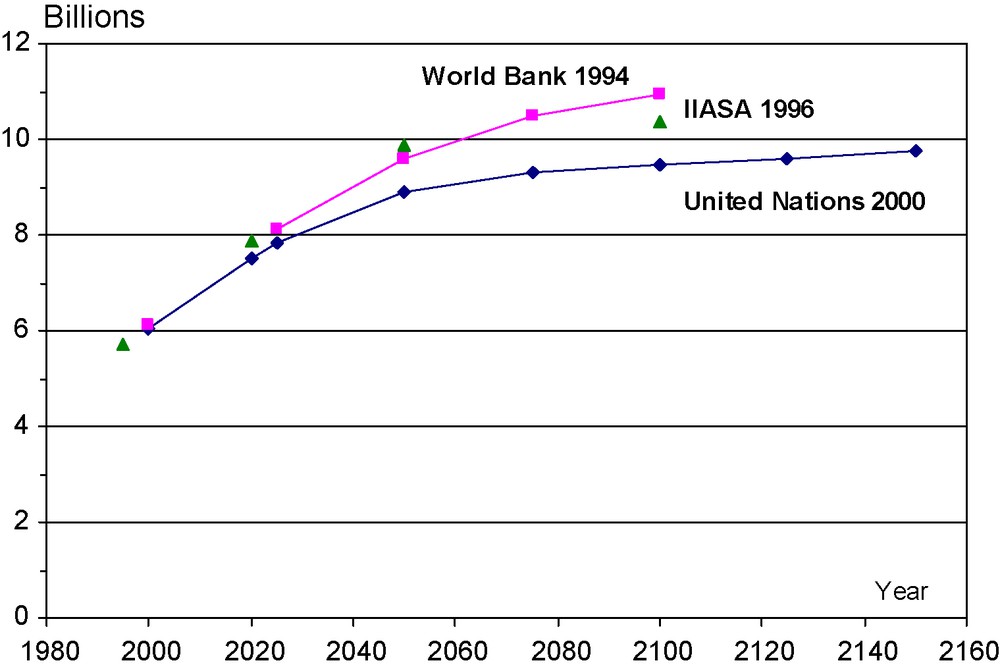
Three long-term projections of the world population (medium variants), from [15,18,21].
Trois projections à long terme de la population mondiale (variantes « médium »), d’après [15,18,21] .
2.2 Projecting catastrophes?
All the above-mentioned projections assume rather smooth changes in the key parameters, including mortality. No major crisis is taken into account, with the sole exception of AIDS, especially in African countries. In a few countries the effect of AIDS on mortality is devastating: in Zimbabwe, life expectancy has fallen from 62 years in 1985–1990 to 40 years in 2000–2005; in South Africa, life expectancy declined from 62 years in 1990–1995 to 49 in 2005–2010 (latest estimates of the UN, [20]). But in both countries the duration of life will raise again in the next decades and in most other countries AIDS has only slowed down the increase in life expectancy and has had very little effect on population growth [17]. The UN [19,20] have estimated that the population of the 40 countries affected by AIDS in Africa should be multiplied by 2.25 in the next 45 years; without AIDS, the coefficient would have been 2.50. Furthermore, the negative impact of AIDS is expected to diminish after 2010 because the rate of contamination should slow down and the availability of treatments should increase.
We have already quoted above an IIASA study [14] where a severe crisis occurring in an African country is simulated. In this simulation, a natural event kills 20% of the population of the country within a few years. The precrisis size of the population is reached again within 10–15 years, because fertility is still much higher than the ‘ordinary’ mortality level.
A less severe example of a climatic accident was observed in France in 2003. A heat wave killed 15,000 people, the number of deaths being increased by 250% during three days, 36% during one month and 3% over one year. The immediate death toll was quite visible: hospitals and funeral homes were overwhelmed for several weeks. Lessons were learnt from this bitter experience and a much better care has been taken of the elderly, who were the main victims of the heat wave. After a small decline in 2003, the life expectancy resumed its rise with a net benefit of 0.25 years after the crisis!
It is nonetheless still possible that more severe climatic events will have more catastrophic effects on population. We just have no way of estimating them at the moment.