

1 Introduction
At rifted continental margins, continental lithosphere is thinned, often by a factor of 5 or more, before finally rupturing [36]. This lithospheric thinning is accompanied by upwelling of the underlying asthenosphere, which leads to decompression melting and ultimately to the formation of oceanic crust. The ocean–continent transition (OCT) may be defined in a variety of ways. Here I adopt a relatively narrow definition, and focus on the region between unequivocal thinned continental crust and oceanic crust formed by “normal” seafloor spreading processes. This definition remains problematic because of a lack of consensus about what is “normal” oceanic crust.
Continental crust is typically characterised by low P wave velocity gradients (< 0.05 /s) and low velocities in the lower crust (< 7.0 km/s) [9], while oceanic crust is characterised by a high velocity gradient in the upper crust (c. 0.1 /s) and lower gradients (c. 0.01 /s) and higher velocities (6.8–7.2 km/s) in the lower crust [55,62]. Both types of crust are underlain by a sharp Moho transition to velocities of ∼ 8.0 km/s. Classically, the transition from continental to oceanic crust was envisaged to occur at an abrupt boundary where oceanic crust abuts directly against thinned continental crust [36]. However, geophysical studies over the last two decades have demonstrated that commonly at rifted margins there exists a region several tens or even hundreds of kilometres wide between fully continental crust and “normal” oceanic crust. Here I review the physical properties of the OCT that may be determined by remote geophysical methods; I do not attempt to review features observed in seismic reflection images.
Geophysical studies in the 1980s revealed the existence of two end-member margin types: a “volcanic” type where magmatism was widespread during continental breakup, and a “nonvolcanic” type where magmatism was much more limited [61]. Such a simple classification inevitably has limited application, but is nevertheless widely understood. In this paper I focus primarily on the OCT at magma-poor margins, but for comparison also review briefly the geophysical characteristics of the OCT at volcanic margins.
The OCT was explored thoroughly first at volcanic margins. At these margins, geophysical surveys have revealed that there is commonly a conceptually simple transition between continental crust lacking significant syn-rift intrusion, through increasing degrees of intrusion, until the point is reached where the crust consists entirely of igneous products. This initial oceanic crust is typically thicker than normal and may reach thicknesses of ∼ 25 km [24]. This transition is typically 20–100 km wide and may be characterised geophysically by changes in P wave velocity structure, density and magnetisation. Typically, the velocity gradient in the uppermost crust increases oceanward, and seafloor spreading magnetic anomalies are identified over the earliest-formed oceanic crust. The seaward limit of continental crust may be very difficult to define at such margins, since heavily intruded upper continental crust may have a very similar bulk composition and therefore physical properties to upper oceanic crust.
At “nonvolcanic”, or more accurately, magma-poor margins, a range of studies have indicated that mantle rocks may be exhumed to the seafloor during continental breakup [64]. At these margins, the OCT may be less well-defined. At some margins, the OCT may be characterised as a region of basement underlying the abyssal plain that lies between unequivocal continental and oceanic crusts, where velocities increase gradually with depth from c. 5.0 km/s at the top of basement to c. 8.0 km/s at depth, without an abrupt Moho transition [13]. In seismic reflection profiles, the OCT commonly lacks a clear Moho reflection, which may be present in the oceanic and continental crust either side, lacks evidence for tilted, syn-tectonic sediment packages, and may have low basement relief [49]. Such observations are consistent with an interpretation involving the absence of crustal rocks and the presence instead of exhumed, serpentinised mantle.
Low-amplitude magnetic anomalies may be present in the OCT at magma-poor margins and may be weakly linear [63]. The presence of these anomalies indicates the presence of rocks with higher magnetisation than the adjacent continental crust, but there exists a range of views on whether the process that generates them can be called “seafloor spreading” [51,53,56]. Many of the characteristics of the OCT are shared by some regions of oceanic crust formed at very slow spreading rates. Identification of the OCT at magma-poor margins as a distinct tectonic province may require a fuller characterisation of such regions of oceanic crust than is currently available.
2 P wave velocity structure
The physical property of the crust that is most readily determined by remote geophysical methods is the P wave velocity. The increasing availability of large numbers of reliable ocean bottom seismometers (OBS) in many countries has made possible the acquisition of many reasonably well-sampled (instrument spacing below 20 km) wide-angle seismic transects across rifted continental margins. Synthesis and comparison of the resulting velocity models can be impeded by differences in methods of analysis. Widely used methods include tomographic inversions that use first arrivals to generate smooth models without velocity discontinuities [67]; inversions that incorporate a restricted number of velocity discontinuities within such smooth models [32]; inversions without such a restriction [21]; and approaches that primarily involve forward modeling using layered models, with direct inversion used mainly for model refinement and error analysis [66]. Although, in principle, tomographic approaches are more robust because they are more objective, first-arrival models do not make full use of the rich information available in wide-angle seismic data. Models involving velocity discontinuities are largely driven by the subjective step of assigning phases to particular model layers, and inversion algorithms can struggle with the complexity of signals generated by such models. Therefore, many modern studies have reverted to the forward modeling approach of Zelt and Smith [66], with limited inverse steps. Although some details of the resulting models will depend on user preferences, particularly regarding the parameterisation, and the approach precludes a thorough examination of trade-offs between parameters, this convergence on a single algorithm allows ready intercomparison of models.
The OCT at volcanic margins is commonly distinguished from the adjacent continental crust by the presence of seismic velocities in the lower crust that are in the range of 7.2–7.6 km/s in a region c. 50–200 km wide, attributed to the presence of high-magnesian basaltic melts [23,61]. At some margins, these velocities occur in a distinct “underplated” body lying beneath stretched continental crust and overlain by a velocity discontinuity that generates wide-angle reflections [1,16]. Elsewhere, these high velocities form the lower part of a thickened oceanic lower crust and are not overlain by a velocity discontinuity [32]. Typically, the oceanic crust thins seaward to normal thickness over a distance corresponding to a few million years of accretion. The underplated body may be sufficiently thick that the Moho beneath it is deeper than beneath the adjacent thinned continental crust [1,24]. In the upper crust, thick sequences arcuate seaward-dipping reflectors (SDR), interpreted as prograding series of lava flows, are commonly observed [20]. The inferred voluminous magmatism is interpreted to result either from thermal, compositional or upwelling anomalies in the mantle at breakup time [23,38,61], or from the presence of sublithospheric small-scale convection [31].
I illustrate the P wave velocity structure of the OCT at magma-poor margins using a series of transects published during the last decade from the conjugate Newfoundland and West Iberia margins and adjacent regions, displayed at a common scale (Figs. 1 and 2). There are substantial variations in the P wave velocity characteristics of the OCT. The OCT reaches a width of more than 100 km on the IAM9 and SCREECH3 profiles [13,35], while on the ISE1 profile offshore Galicia Bank [68], the OCT is likely only ∼ 20 km wide, though oceanic crust cannot be identified clearly on this profile.
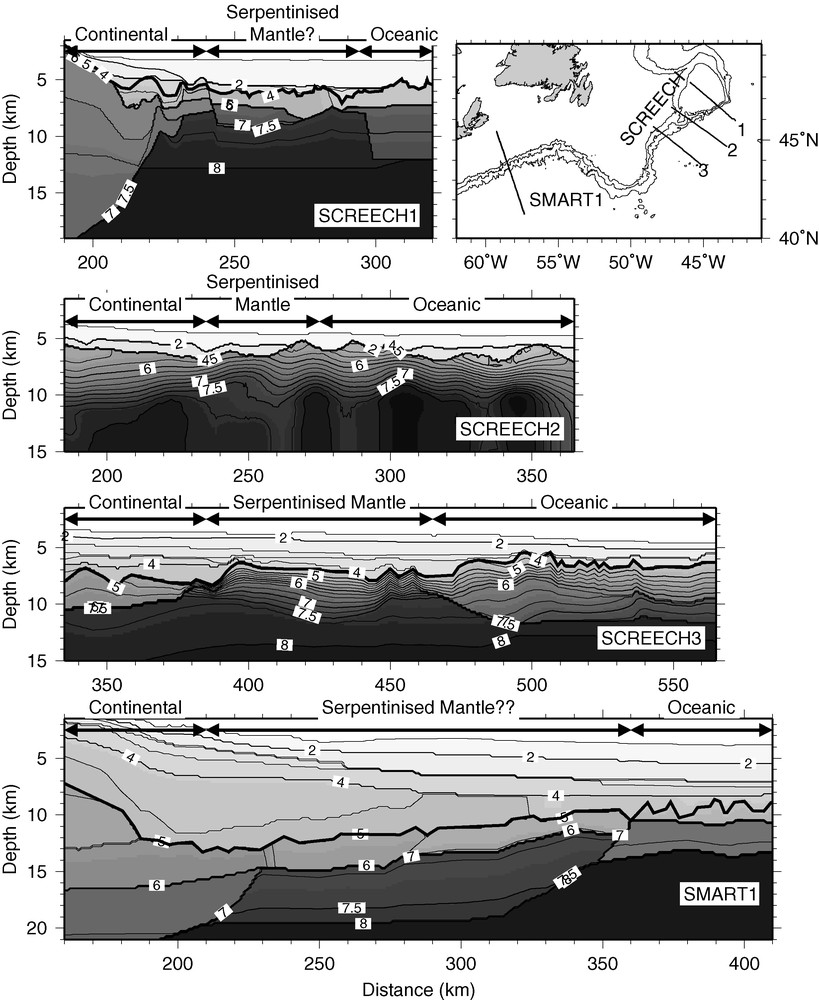
P wave velocity models for the OCT offshore Newfoundland and eastern Nova Scotia. Each profile begins 50 km landward of the interpreted seaward limit of continental crust and ends 50 km seaward of the interpreted landward limit of oceanic crust, or at the end of the profile if less than 50 km of oceanic crust is sampled or the OCT is relatively narrow. The coordinate system of the original publications (from top to bottom, Funck et al. [17]; Van Avendonk et al. [58]; Lau et al. [35]; Funck et al. [18]) is preserved. Vertical exaggeration is 4.0. Contour interval is 0.25 km/s above 5.0 km/s and 0.5 km/s below 5.0 km/s. Labels indicate published interpretations, with question marks where more than one interpretation has been put forward. All models were developed using the code of Zelt and Smith [66], except for SCREECH2, for which a first arrival tomographic code was used. Models are generally well sampled and well constrained in the regions shown, but readers should refer to the original publications to assess the reliability of individual features. The layer boundary marking the top of basement is indicated by a thick line, except for SCREECH2, where the model is not parameterised by layers but the top of basement coincides with the 4.0 km/s contour. Map shows locations of wide-angle seismic profiles with bathymetric contours at 1000 m intervals.
Fig. 1. Modèles de vitesse d’ondes P à la transition océan–continent dans l’offshore de Terre-Neuve et de la Nouvelle Écosse orientale. Chaque profil commence à 50 km, vers le continent, de la limite de la croûte continentale interprétée en direction de la mer, et se termine à 50 km, vers la mer, de la limite de la croûte océanique interprétée en direction du continent, ou bien à la fin du profil, si moins de 50 km de croûte océanique sont échantillonnés ou si la zone de transition est relativement étroite. Le système de coordonnées des publications originelles est conservé (du sommet jusqu’à la base : Funck et al. [17] ; Van Avendonk et al. [58] ; Lau et al. [35] ; Funk et al. [18]). Exagération verticale : × 4. Intervalle des contours : 0,25 km/s au-dessus de 5,0 km/s et 0,5 km/s au-dessous de 5,0 km/s. Les étiquettes indiquent les interprétations publiées avec des points d’interrogation, quand plus d’une interprétation a été proposée. Tous les modèles ont été développés en utilisant le code de Zelt et Smith [66], excepté pour le profil SCREECH2, pour lequel un code tomographique de première arrivée a été utilisé. Les modèles sont en général bien échantillonnés et bien contraints dans les régions présentées, mais il est conseillé aux lecteurs de se reporter aux publications originales, pour évaluer la fiabilité des caractères propres. La couche limite marquant le toit du socle est indiquée par une ligne épaisse, excepté dans le cas de SCREECH2, où le modèle n’est pas paramétré par des couches, mais où le toit du socle coïncide avec la limite 4,0 km/s. La carte montre la localisation des profils sismiques grand angle, avec des intervalles de 1000 m entre les courbes bathymétriques.
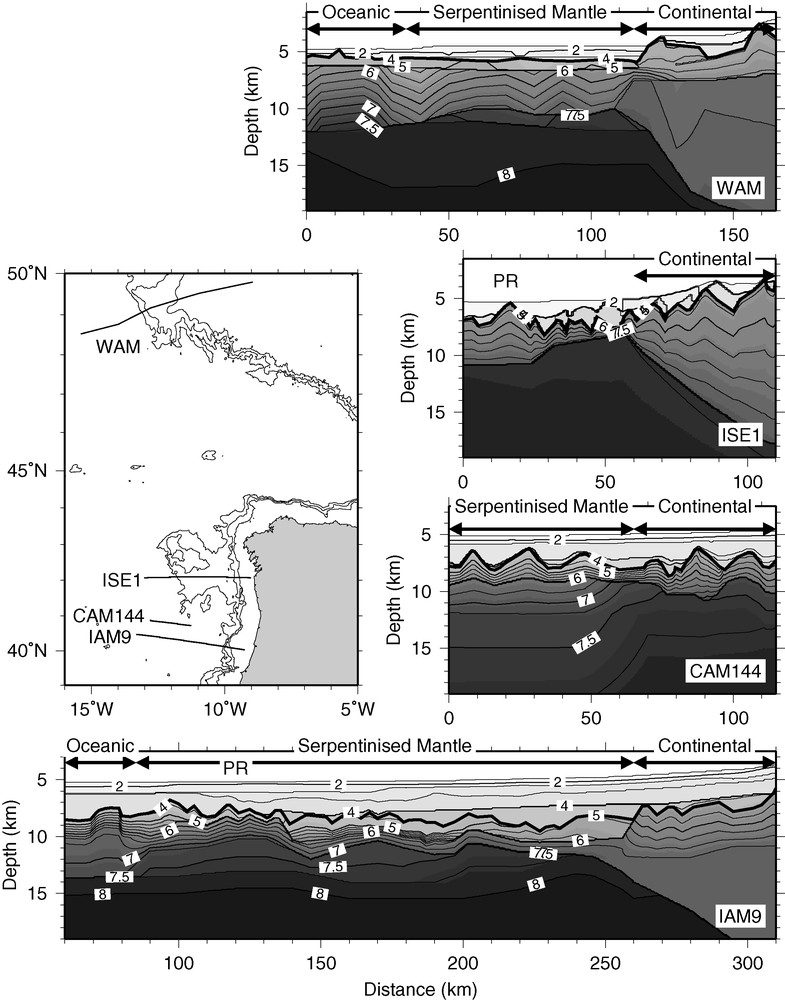
P wave velocity models for the OCT offshore the UK western Approaches and West Iberia. The coordinate system of the original publications (from top to bottom, Bullock and Minshull [5]; Zelt et al. [68]; Chian et al. [8]; Dean et al. [13]) is preserved. PR is the peridotite ridge. All models were developed using the code of Zelt and Smith [66]. Other details are as for Fig. 1.
Fig. 2. Modèles de vitesse d’ondes P pour la transition océan–continent dans l’offshore des abords occidentaux de Grande-Bretagne et de l’Ouest de l’Espagne. Le système de coordonnées des publications originelles (du sommet jusqu’à la base, Bullock et Minshull [5] ; Zelt et al. [68] ; Chin et al. [8] ; Dean et al. [13]) est conservé. Tous les modèles ont été développés en utilisant le code de Zelt et Smith [66]. Les autres détails sont les mêmes que pour la Fig. 1.
Typically, velocities at the top of basement in the OCT are below 5.0 km/s (Fig. 3), below that typically observed either in continental or in adjacent oceanic crust. In some cases [8], this characteristic allows the edge of the OCT to be mapped as a velocity contour. Higher velocities appear in models based on first arrivals only (e.g., SCREECH2) and in models where the basement above normal mantle is parameterised as a single layer (e.g., ISE1). In both cases, steep vertical velocity gradients in uppermost basement are artificially smoothed, and it is likely that models with lower velocities at the top of basement would provide an equally good fit to the data. Even within individual transects, there can be a very wide range of velocities at a given depth beneath basement (Fig. 3). Velocities appear to be systematically lower on the Iberian/European margin than on the Newfoundland margin (Fig. 3C). If velocity variations are interpreted as due primarily to different degrees of serpentinisation, such a difference might result from an asymmetry in thermal structure, with cooler temperatures and deeper mantle serpentinisation on the Iberian/European margin. Such asymmetry is consistent with models in which the Newfoundland margin formed the “upper plate” overlying a detachment during the final stages of breakup [26,64].
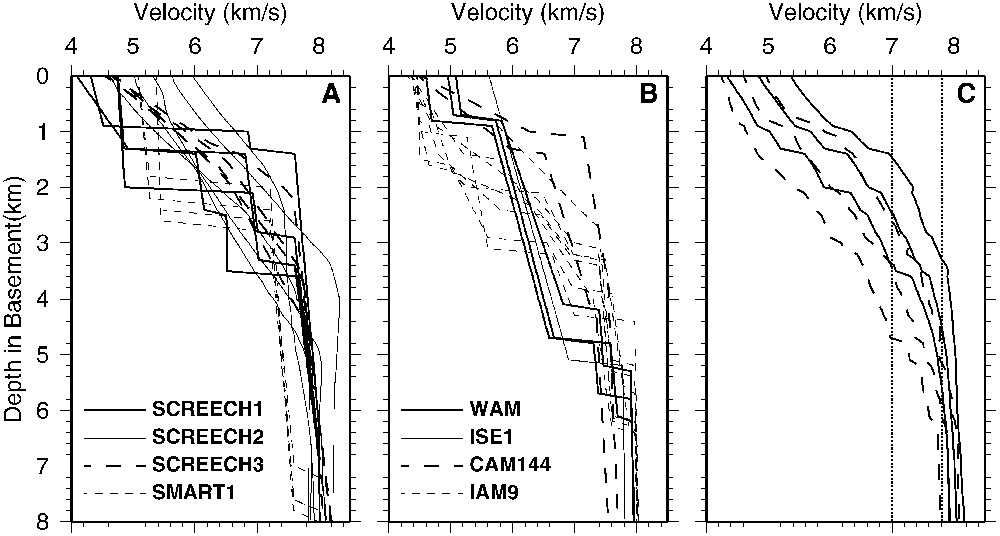
P wave velocity in the OCT as a function of depth, sampled at horizontal intervals of 20 km. A. Models shown in Fig. 1. B. Models shown in Fig. 2. C. Solid lines mark mean velocity–depth variation of models in A, excluding SMART1 because of uncertainties in its interpretation (see text), and one standard deviation above and below the mean. Dashed lines mark mean velocity–depth variation of models in B and one standard deviation above and below the mean. Vertical dashed lines mark 7.0 and 7.8 km/s.
Fig. 3. Valeurs des vitesses d’ondes P à la transition océan–continent en fonction de la profondeur, échantillonnées à intervalles horizontaux de 20 km. A. Modèles présentés à la Fig. 1. B. Modèles présentés à la Fig. 2. C. Lignes pleines marquant la variation moyenne vitesse–profondeur des modèles présentés en A, à l’exclusion de SMART1 à cause d’incertitudes dans son interprétation (voir texte) et d’un écart-standard au-dessus et au-dessous de la moyenne. Les lignes en tireté marquent la variation moyenne vitesse–profondeur des modèles présentés en B et un écart-standard au-dessus et au-dessous de la moyenne. Les lignes verticales en tireté marquent 7,0 et 7,8 km/s.
In most cases, velocities rise steeply to reach values above 7.0 km/s at 2–4 km beneath top basement and normal mantle values of more than 7.8 km/s at 5–6 km beneath top basement. The Moho is often gradational, with a lack of wide-angle Moho reflections indicating the lack of an abrupt velocity discontinuity, but such reflections are sometimes present. Nowhere is a normal oceanic Layer 3 present. It has been suggested recently that the OCT may be much wider at the Iberia and Newfoundland margins than is indicated in Figs. 1 and 2, with normal seafloor spreading not developing until tens of kilometres seaward of SCREECH2 and IAM9 [53,57]. It is beyond the scope of this paper to comment in detail on this suggestion, but in terms of P wave velocities, the seaward limit of the OCT appears to be well-defined on the IAM9 profile (Fig. 2), where a well-constrained normal oceanic Layer 3 appears seaward of ∼ 80 km model distance [13].
In these models of the OCT at magma-poor margins, velocities of 7.2–7.6 km/s have been interpreted as indicating the presence of weakly serpentinised mantle rocks, while the overlying thin section of lower-velocity material has been interpreted as comprising either crustal or more highly serpentinised mantle rocks [8]. In all cases, therefore, exhumed mantle rocks are inferred to occur either at or very close to the top of basement (Figs. 1 and 2). This interpretation has been confirmed by seafloor sampling and by drilling at the West Iberia margin [2,64], but elsewhere it remains untested. Depth of alteration in the mantle may be limited to 5–6 km by the depth of the 400–500 °C isotherm after the entire crust becomes brittle [48]. The velocity variation with depth matches closely that observed in crust of similar age formed at fracture zones on slow-spreading mid-ocean ridges (Fig. 4A), where the presence of mantle rocks close to the top of basement is also inferred. Here also, despite probable differences in the thermal evolution from that of a magma-poor OCT, normal mantle velocities are reached typically also at 5–6 km depth [41]. Velocities are significantly lower in young fracture zone crust where porosities remain high. Serpentinisation may only reach deeper depths when extensional faulting occurs in a lithosphere that is brittle to much greater depths, such as mature oceanic lithosphere bending into a subduction zone [50], though an alternative view is that thermal stresses may promote deep cracking and serpentinisation even in normal oceanic lithosphere [30].
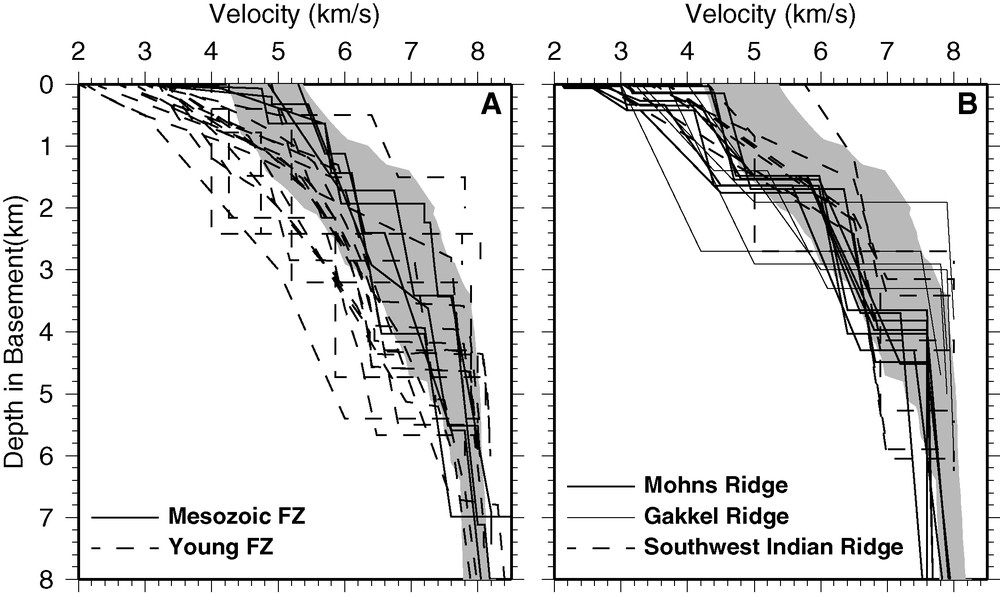
P wave velocity as a function of depth for: A: fracture zone crust formed at slow-spreading mid-ocean ridges (data compiled in [41]). B. Oceanic crust formed at ultraslow-spreading mid-ocean ridges and outside fracture zones [27,29,42,45,46]. Grey shading in each panel marks the region enclosed by the highest and lowest values from the velocity–depth plots shown in Fig. 3C.
Fig. 4. Valeurs des vitesses d’ondes P en fonction de la profondeur pour A : croûte de zones de fractures formées au niveau des dorsales à accrétion lente (données compilées par [41]). B. Croûte océanique formée dans les dorsales médioocéaniques à très faible taux d’expansion [27,29,42,45,46]. L’ombre en grisé dans chaque panneau marque la région circonscrite par les valeurs les plus hautes et les plus basses des points vitesse–profondeur présentés à la Fig. 3C.
A question that then arises is: how can partially serpentinised mantle rocks with velocities of 7.2–7.6 km/s be distinguished from underplated mafic rocks with velocities also of 7.2–7.6 km/s? On the basis of P wave velocities only, there are several characteristics that commonly allow such a distinction to be made. Firstly, the base of magmatic underplates is normally substantially deeper than the 5–6 km beneath top basement quoted above. Secondly, magmatic underplates are often overlain by a substantial thickness either of thinned and intruded continental crust or of oceanic upper crust. Thirdly, it is unlikely that mafic rocks could reach such velocities at shallow depths (e.g., less than 5–6 km) because of the presence of residual crack porosity [34]. Fourthly, oceanic crust seaward of inferred magmatic underplates tends to be thicker than the normal 6–7 km, whereas oceanic crust seaward of exhumed mantle OCTs tends to be thinner. However, where characteristics of both margin types are present, such a distinction becomes more difficult. An example of such a margin is the eastern Nova Scotia margin sampled by profile SMART1 (Fig. 1) [18]. Here, velocities of more than 7.0 km/s are reached only ∼ 2 km beneath top basement and the adjacent oceanic crust is not unusually thick, but normal mantle velocities are not reached until 7–8 km beneath top basement. Here, either interpretation would appear to be viable. A second example is the Angolan margin [12]. Here, a layer with velocities of ∼ 7.6 km/s appears both as a thick (4–6 km) layer at the landward edge of the survey, where it lies beneath a ∼ 10 km crustal section, and also as a thin (∼ 2 km) layer ∼ 5 km subbasement at the seaward end of the survey. It is very unlikely that the landward high-velocity body results from mantle serpentinisation, whereas this process provides an entirely plausible interpretation for the seaward body. This juxtaposition of volcanic and magma-poor margin characteristics might be explained if the underplated body results from localized extensional thinning of the mantle lithosphere [25] rather than from a mantle thermal or compositional anomaly.
During the last 10–15 years, serpentinised mantle rocks have been sampled extensively at spreading ridges where the full spreading rate is less than ∼ 20 mm/yr––the so-called “ultraslow” category [14]. The range of interpretations regarding the seaward limit of the OCT off West Iberia and Newfoundland raise the more general issue of how lithosphere with weak magmatic addition that is formed by a transitional process during continental breakup might be distinguished geophysically from lithosphere with weak magmatic addition that is formed by a more “steady state” process during ultraslow seafloor spreading [26]. Comparison of the velocity–depth variation for these two types of lithosphere is difficult because our seismic sampling of the former is mostly in Mesozoic-aged lithosphere, while our sampling of the latter is mostly in young lithosphere. Moreover, mature oceanic lithosphere formed at ultraslow rates is difficult to identify unequivocally because seafloor spreading magnetic anomalies tend to merge and become difficult to identify. P wave velocities at modern mid-ocean ridges formed at ultraslow rates are generally lower than those observed in OCTs at Mesozoic magma-poor margins (Fig. 4B), probably because of the presence of higher porosities. A difference that may be significant is that oceanic Layer 3 is often present at ultraslow-spreading ridges although, sometimes (e.g., Mohns Ridge), this layer has unusually low velocities. However, this distinction may be misleading, because to date most of the published modern (post-1980) wide-angle surveys of crust formed at ultraslow-spreading ridges are from regions where basalt is the main lithology sampled at the seafloor. On the basis of seafloor fabrics, Cannat et al. [6] infer that this “magmatic” type of seafloor accounts for only 40% of the seafloor formed at the ultraslow Southwest Indian Ridge. The remaining 60% of “smooth” and “corrugated” seafloor types has unknown seismic velocity structure.
Curiously, although the above margin types are commonly interpreted as end-members, rather few published P wave velocity models across rifted margin OCTs exhibit neither magmatic underplating nor mantle serpentinisation. Examples of such models include those from the Moroccan margin [11], the southern Gulf of California [38], and the margin of French Guiana [19], though the latter may be more accurately described as a transform margin. Also, since most datasets involve transects across rifted margins, the nature of the along-margin change from an underplated volcanic margin to a margin with mantle serpentinisation remains largely unknown.
3 Other physical properties
3.1 S wave velocity
S wave velocities can provide a powerful additional constraint on lithology because different rocks with the same P wave velocity can have different S wave velocities. However, S waves do not propagate through ocean water and their generation at the seabed is technologically challenging. Therefore, marine wide-angle seismic experiments must rely on mode conversion at velocity discontinuities to generate S waves. Unfortunately, such mode conversion is inefficient unless a large velocity contrast is present [60]. At rifted margins, such a contrast is rarely present at the seabed, but may be present at the top of basement. At volcanic rifted margins, extrusive basalt flows commonly mark the top of basement and provide an interface for efficient mode conversion. At such margins, it is possible to generate detailed and comprehensive S wave velocity models [44] from such mode-converted signals. In the OCT at volcanic margins, P-to-S velocity ratios are commonly indistinguishable from those of oceanic crust [40,44], and sometimes sufficiently low to rule out an interpretation involving mantle serpentinisation [43].
In OCTs at magma-poor rifted margins, S wave velocities are potentially more useful because they provide a means of distinguishing mafic igneous rocks from serpentinised mantle rocks with the same P wave velocity, although this distinction disappears at velocities greater than ∼ 6.0 km/s [7]. However, clear mode-converted S waves have been observed only rarely in such locations, perhaps because the velocity contrast between highly serpentinised mantle and compacted sediments is small. Clear S waves have been observed on the UK western approaches margin off Goban Spur [5], where the sediment thickness is only a few hundred metres and there is therefore a strong velocity contrast at the top of basement. These data indicate the presence of anomalously high P-to-S velocity ratios, as expected for strongly serpentinised mantle rocks. Here, the S waves play an important role in the interpretation because the P wave velocity profiles in the OCT are not very different from that in adjacent oceanic crust (Fig. 2).
3.2 Anisotropy
Most rocks exhibit some degree of anisotropy. However, the measurement of such anisotropy in situ requires good azimuthal sampling. Because rifted margins are large-scale features and their investigation by wide-angle seismic methods requires long source-receiver offsets, such investigations are commonly carried out in the form of transects, with very limited azimuthal sampling. Also, anisotropy is often best measured using S waves, which are sparse in such investigations. Measurements of anisotropy might in principle allow us to distinguish mantle peridotite, which might be expected to have significant anisotropy due to alignment of the fast axis of olivine crystals during lithospheric extension, and gabbroic rocks, which might have the same P wave velocity but tend to exhibit very little anisotropy. Laboratory measurements on samples of partially serpentinised peridotite suggest that the degree of anisotropy decreases with increasing degrees of serpentinisation [52], but that P wave anisotropy of up to ∼ 10% might be expected for P wave velocities between 7.0 and 8.0 km/s [10,52]. Anisotropies in this range have been inferred in the OCT off West Iberia [10].
3.3 Magnetics
In principle, magnetic anomaly data at OCTs provide critical information because the landward limit of identifiable seafloor spreading magnetic anomalies can be interpreted as the landward limit of oceanic crust. However, detailed studies of magnetic anomalies at rifted margins have illustrated the limitations of such an approach. Most studies have relied on measurements from surface-towed or airborne magnetometers; the North Atlantic is sufficiently well sampled by such measurements that a meaningful grid can be constructed [59], though track spacings are still large compared to along-track sample intervals.
At volcanic margins, SDR sequences generate strong magnetic anomalies. The identification of these anomalies with seafloor spreading chrons may be complicated by lateral flow of lavas, which smears the anomalies. At some margins, such as the eastern margin of the US [24], a thick SDR sequence gives rise to a distinctive, broad magnetic anomaly. The gradual disappearance of this anomaly off Nova Scotia provides an indication of the northern limit of voluminous syn-rift magmatism and the transition to magma-poor margins off Newfoundland [28].
In the OCT at magma-poor margins, the interpretation of magnetic anomalies has proved more controversial. For example, off Newfoundland, the anomaly identified as seafloor spreading anomaly M3 lies clearly above thinned continental crust [17]. Anomalies typically have low amplitude and are only weakly linear, so their identification is difficult. In these circumstances, the acquisition of magnetic data near the seafloor, where amplitudes are much enhanced, can be valuable [51]. The existence of these anomalies does not require the presence of a highly magnetised upper oceanic crust formed by seafloor spreading, and can alternatively be explained by magmatic intrusion at depth or simply by the presence of magnetite in serpentinites [47]. Interpretation of such anomalies in the OCT off West Iberia has proved particularly controversial, despite the availability of deep-towed as well as surface magnetic data. Srivastava et al. [56] interpreted these anomalies as a sequence of Mesozoic seafloor spreading anomalies, but required a series of abrupt changes in spreading rates to fit the observed pattern. Two more recent studies have both used spectral methods to infer the depths of the source bodies of these anomalies [51,53], but have reached contrasting conclusions. Russell and Whitmarsh [51] developed a model in which the anomalies result from magmatic intrusions at depths of several kilometres beneath top basement. Using the same data, Sibuet et al. [53] show that the anomalies can also be attributed to serpentinites in the top 2 km of basement, and use these anomalies to date the associated serpentinisation. These contrasting conclusions illustrate the fundamental ambiguity of magnetic anomaly interpretations, which may be resolved only if the shape and location of the source bodies are constrained by other, independent measurements.
3.4 Gravity
Gravity data provide an important check on P wave velocity models based on wide-angle seismic experiments, for example to confirm that a boundary identified from wide-angle reflections is really the base of the crust and not some other, intracrustal boundary. At volcanic margins, the emplacement of thick sequences of SDRs can have a significant expression in the gravity anomaly, and in some circumstances, this gravity effect may be isolated to constrain the distribution of magmatism along a margin [65]. Mafic underplates have higher densities than typical crustal rocks, so in principle their presence also may give rise to a distinctive gravity anomaly, but the trade-off in gravity models between crustal density and thickness means that the presence of such rocks cannot be inferred unequivocally from gravity data. The significant overlap between the velocity-density systematics of mafic rocks and serpentinised peridotites [39] means that gravity data are also of little help in determining lithologies in the OCT at amagmatic margins. Gravity data might be more useful in determining deeper structure at rifted margins, beyond the depths readily sampled by controlled source seismic experiments. At depth, the main controls on mantle density will be temperature and degree of melt depletion. If the thermal structure is well known, it may be possible at some margins to use gravity data to infer lateral variations in melt depletion and hence determine at what stage mantle melting is fully developed, though the associated gravity signals may be small and difficult to measure [33].
3.5 Electrical resistivity
The application of passive magnetotelluric (MT) and controlled source electromagnetic (CSEM) techniques in the marine environment has developed rapidly over the last decade. These techniques allow determination of the detailed resistivity structure of the lithosphere to several kilometres depth for CSEM and to much greater depths for MT [54]. Resistivity contrasts between different lithologies may be much greater than the associated velocity contrasts, so such techniques might provide a powerful means of distinguishing, for example, serpentinites from mafic rocks in the OCT. Unfortunately there is very little published literature on the electrical resistivity of serpentinite. It is clear that the resistivity is strongly dependent on temperature [4], and it is not clear whether sufficient data are available for reliable estimation of resistivities under in situ conditions. Some useful insights on the utility of CSEM methods for distinguishing mafic and ultramafic lithologies may come from a recent survey over serpentinite outcrops on the Mid-Atlantic Ridge [15].
4 Future developments
P wave velocities at crustal depths are relatively accessible and their measurement, through wide-angle seismic experiments, has become a routine component of rifted margin transects, not least because a good velocity model is required for accurate depth conversion of seismic reflection images. To date, wide-angle seismic datasets from rifted margins have been analysed normally by methods that require the subjective steps of picking travel-times and associating them with particular phases. Waveform inversion approaches avoid these subjective steps, and are now becoming more reliable and computationally accessible [3]. Relatively dense receiver sampling is required (∼ 5 km), but the development of smaller and cheaper OBS makes such sampling possible, even for 300–500 km transects across rifted margins. The resultant step increase in resolution of velocity models may allow lithologies to be distinguished based on statistical approaches such as those that have been applied already to seismic reflection data from the OCT [22].
P wave velocity information for the melt extraction zone (depths of tens of kilometres in the lithosphere) is more difficult to obtain, since conventional wide-angle seismic experiments do not probe such depths, and tomographic models based on passive recording have poor resolution at such depths except in seismically active regions. However, long-range wide-angle seismic data have been used successfully to constrain the detailed seismic velocity structure of the melt extraction zone in mature oceanic lithosphere [37]. These velocity variations have been attributed to variations in melt depletion [37] or in crack density [30]. Ultimately, the use of such techniques may allow clearer definition of the boundary between the OCT and “normal” oceanic lithosphere. Electromagnetic methods offer significant promise for giving new insights on the OCT and may also provide constraints on melt extraction, but are largely untested for this target.
5 Conclusions
Based on the above review, I conclude that:
Exhumed mantle in OCTs is characterised by high P wave velocities at shallow depths and a lack of oceanic Layer 3; these characteristics normally distinguish it from adjacent oceanic and thinned continental crust and from magmatically underplated crust.
Other physical properties of the OCT may also be diagnostic, but they are generally less accessible.
Other than at fracture zones, there is a lack of modern wide-angle seismic datasets for locations on fully oceanic lithosphere where serpentinised mantle is the dominant seabed lithology.
There are few constraints on the along-strike change from volcanic to amagmatic margin OCT types.
Densely sampled wide-angle seismic surveys, long-range seismic techniques, and controlled source electromagnetic surveys may provide fruitful future avenues to further constrain the structure and dimensions of the OCT at magma-poor margins.
Acknowledgements
I thank Gianreto Manatschal for suggesting that I put this review together; Thomas Funck, Donna Shillington, Helen Lau, Colin Zelt and Frauke Klingelhoefer for velocity models; and Jun Korenaga and Rolf Mjelde for constructive reviews.