

1 Introduction
Microscopic observations and geochemical analyses from speleothems have been widely reported in the past 10 years following the pioneering work of Gascoyne [15]. The petrographic observation of speleothem carbonates often reveals laminated growth sequences, which, under certain conditions, are thought to be annual [16]. Trace element records as well as isotopic composition of the growth sequences are related to environmental variations, although sometimes in a complicated manner [9,12,14,36–38]. These records are of great interest as, once calibrated, they could allow high resolution interannual to subannual descriptions of regional past climatic changes.
Reconstruction of precise annual temperature records over West Europe is established since approximately the end of the 14th century, thanks to several studies using independent methods [7,28]. Much less data exist for earlier times, and the western European climate during the Medieval and Roman period is mostly established through the analyses of regional fluctuations from Alpine glaciers and lake levels [21], but also from less precise global surface temperature multiproxy reconstructions series mostly based on ice cores oxygen isotopes and tree-ring temperature reconstructions [29].
Carbonate deposits along Roman water canalization have been reported in many sites of the Roman Empire and could help to better constrain temperature and hydrological variations during the Roman period. History of environmental policy making and anthropological impacts are also of great interest in this archeological context [26]. Such deposits have been studied by a few authors [4,11,18,19] and are characterized by laminated sequences sometimes directly related to an annual cycle. They might thus provide high resolution records of paleoenvironmental data continuously archived by flowing water. One of the other benefits of these deposits is that they often are associated with precise historical dates and could be correlated with other archeological proxies.
The city of Ostia Antica was chosen in 2003 as the support of an interdisciplinary program on water distribution in the Roman city [5] and new excavations and research were conducted under the supervision of the École française de Rome, the Soprintendenza per i beni archeologici di Ostia Antica, with the collaboration of the École normale supérieure and the Institut de recherche sur l’architecture antique. During the course of the excavations, small deposits were recovered on the interior wall of a water tower, the castellum aquae of Porta Romana, east of the city. We investigated one of the deposits, trying to address the following questions:
- • is there any long-term petrological and/or compositional variation within the deposit?
- • is there a short-term resolvable seasonal signal?
- • could we use such deposit to get insights on paleoenvironmental parameters?
Our main results are reported in the following.
2 Archaeological and geological context and collecting sites
2.1 The context
Ostia Antica, located 20 km southwest of Rome was the imperial city's harbor (Fig. 1a). The water tower of the Porta Romana built at the end of the 1st century ad, was probably part of an imperial project for the improvement of the town designed to provide a reliable supply of fresh water to the inhabitants [2]. At that time, Ostia was growing as one of the most important harbor along the Italian coast, with a population probably reaching between 30,000 and 50,000 inhabitants in the 2nd century [33]. The harbor city remained very active until the 3rd century when it progressively declined [30]. Archeological studies on the site started in the 19th century, but it is only during the years 1985–1986 that the castellum aquae was partly excavated.
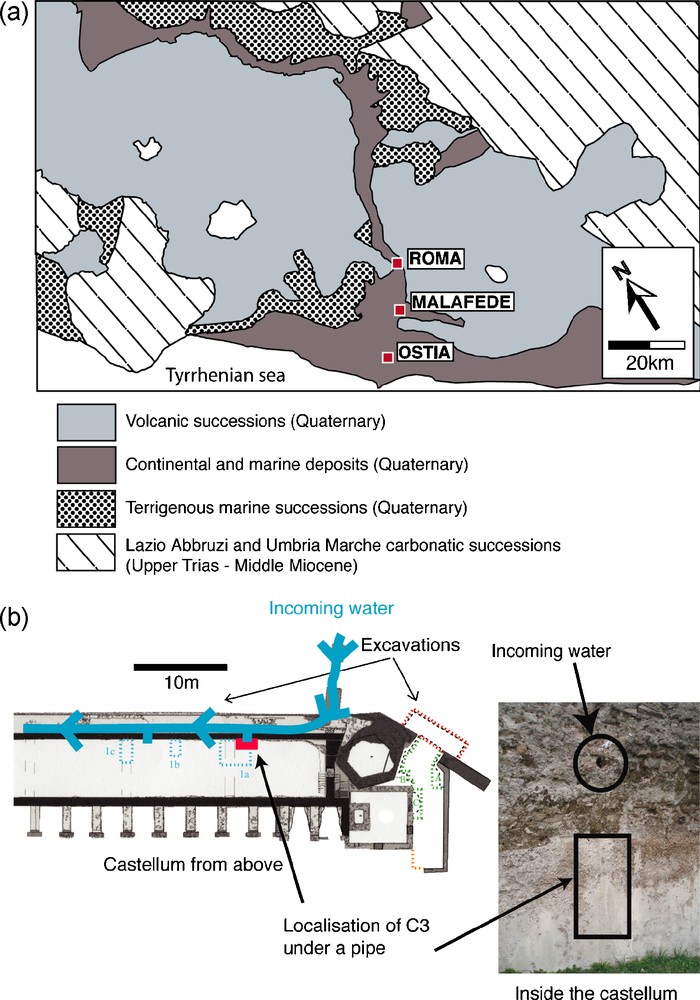
a: simplified geological map around Ostia after [3]; b: map of the castellum aquae and location of the deposit.
Fig. 1. a : carte géologique simplifiée d’après [3] ; b : localisation du dépôt sur le castellum aquae.
The castellum aquae was the central collecting point of the water then redistributed to public monuments, fountains and sometimes private houses. The water was channeled to the castellum aquae through free-flowing canals and lead pipes. Very few traces from the aqueduct and lead pipes remain, preventing us from observations on the adduction system itself. We still know from numerous archeological studies that aqueducts carrying water to Roman cities were covered to prevent the water being contaminated by dust and other impurities, and also from being heated by the sun.
Archeological investigations have shown that water used in Ostia was coming from the Malafede basin, a collecting point east of the actual town of Acilia and, from there, was dispatched to the castellum aquae [2]. The Romans had a preference for water derived from calcareous terrains [20] but the geology around the Malafede basin is complex (Fig. 1a) and we have little means of knowing the exact paths followed by the water before the basin. The water could have been in contact with three main units, Quaternary undifferentiated continental and marine sediments following the Tiber river valley, Quaternary potassic magmatic rocks forming a hill on the south and east of the basin and the major units, the Lazio Abbruzi and Umbria Marche Trias to Miocene sequences formed of limestones and marls. These contrasted terrains will induce different water rock reactions, leading to contrast in the water chemistry. While we unfortunately have very little information on the exact sources used, insights on the constructions led [5] to infer that three distinct sources had probably been used to supply the city. The first one starting during the first decades of the 1st century ad, the second one during the years 120 ad, the third one at the end of the 2nd century [2,5]. It is not known from archeological investigations if the aqueducts connecting the sources to the city were used at some point simultaneously or not.
2.2 The deposit
During utilization, the castellum aquae was partly filled with free flowing water and used as a redistributing tank. In the excavated part, carbonate deposits could be locally spotted on the inner part of the walls where they form coatings of a few millimeters thick. These carbonates grow upon the opus signinum, a thin hydraulic cement layer containing pounded terracotta. A petrological study of the coating beneath the deposit [8] shows that the opus signinum belongs to an early phase of improvement of the water tower happening during the 1st century ad giving us a rather not constraining lower age for the carbonate deposits. The carbonate sample called C3 was recovered in 2006 on a vertical wall just beneath a water arrival (Fig. 1b). This sample is supposed to have crystallized continuously during the free flowing of the water from the pipe into the castellum aquae. The sample size is 0.7 cm wide and a few centimeters long.
3 Methodology
The sample was first cut along the growth axis. Approximately 300 mg of powder were scraped at different locations, the dissolutions in 1 M HCl solution of two powder extracts were prepared in order to identify the main contributors to the insoluble residue. X-ray analyses using an Inel CPS 120 X-ray diffractometer at the Geology laboratory of the École normale supérieure (ENS) in Paris were performed to determine the broad composition of the powders. A thin section was made from the sample to perform optical microscopic observations. Major element analyses were performed on the thin section sample with a CAMECA SX100 electron microprobe at the University of Clermont-Ferrand. A polished, carbon coated slab section was also prepared for electronic microscope observations using a Hitachi S-2500 Scanning Electron Microscope (SEM) instrument at the Geology laboratory of the ENS in Paris. Backscatter mode was mostly used, as it allows one to distinguish hiatus and heavy elements with a much better contrast. Minerals composition analysis and mapping were made using an Electron Dispersive Spectroscopy (EDS) detector.
Laser ablation ICP-MS analyses were performed in the Laboratoire magmas et volcans, University of Clermont-Ferrand (France) using a 266 nm UV laser system coupled with a VG PQ2 + ICP-MS. The laser beam was around 50 μm in diameter and the analyses were carried out using the automatic stepscan mode in which the sample is moved continuously at a speed of 12.5 μm per second. The ablation cell was flushed with Ar gas and the following isotopes were measured on the ICP-MS: 24Mg, 29Si, 43Ca, 44Ca, 55Mn, 65Cu, 88Sr, 138Ba, 140Ce, 208Pb and 238U. The background for each isotope was measured during 60 s before analyzing the sample. Standard silicate glass NIST 612 was also analyzed at the beginning and at the end of the run. The data presented are background subtracted and has been corrected for ICP-MS drift during the time of the analyses with the NIST 612 measurements [6]. Precision and accuracy (both better than 10%) were assessed from repeated analyses of NIST 612 and BCR-2G standards. The use of intensity ratios (element/Ca) minimizes the matrix difference between silicate standards and carbonate samples. Two tracks were made at a few millimeters apart, parallel to each other and perpendicular to the laminations. The starting and ending point of the scans were reversed between track 1 and track 2, going respectively from the opus signinum to the outer part and from the outer part to the opus signinum in order to test possible bias linked to the stability of the LA-ICP-MS device.
4 Results
4.1 Composition and structure of the sample
The X-ray dispersion analyses made on several bulk powders show that the deposit has a very homogeneous composition, a single phase of pure calcite is detected. This result is confirmed by the electron microprobe analyses which show that all along the sample, the carbonate is pure calcite with less that 0.5% MgO. The diluted HCl residues from the bulk powders appear to be highly dominated by quartz and hematite.
The optical microscope observations show continuous horizons of alternating clear and darker laminations (Fig. 2a). The darker laminations are thinner and are associated with more numerous impurities. The calcite crystal fabric is mostly laminar, with a sparitic or micritic texture. The size of each doublets which could be clearly optically identified is ranging from less than 100 to up to 440 μm. Based on color, it is possible to determine an approximate number of growth band cycles (corresponding to a doublet of clear and dark laminations), and approximately 30 cycles were identified. In addition, the microscopic observations allow the identification of four important transitions associated with discontinuity horizons we interpret as growth interruptions. The observed section is thus divided in five layers, each containing laminations, separated by these discontinuities. Layer P1 is the closest from the opus signinum and consists of homogeneous micritic crystals and hardly resolvable laminations, layers P2 and P3 are very similar and show regular growth cycles with a more sparitic, or palisade like texture (see [17] for a description of similar textures). Layer P4 shows a more composite crystal structure with thicker laminations and bigger pores. Layer P5 is following with thin laminations similar to layers P2 and P3.
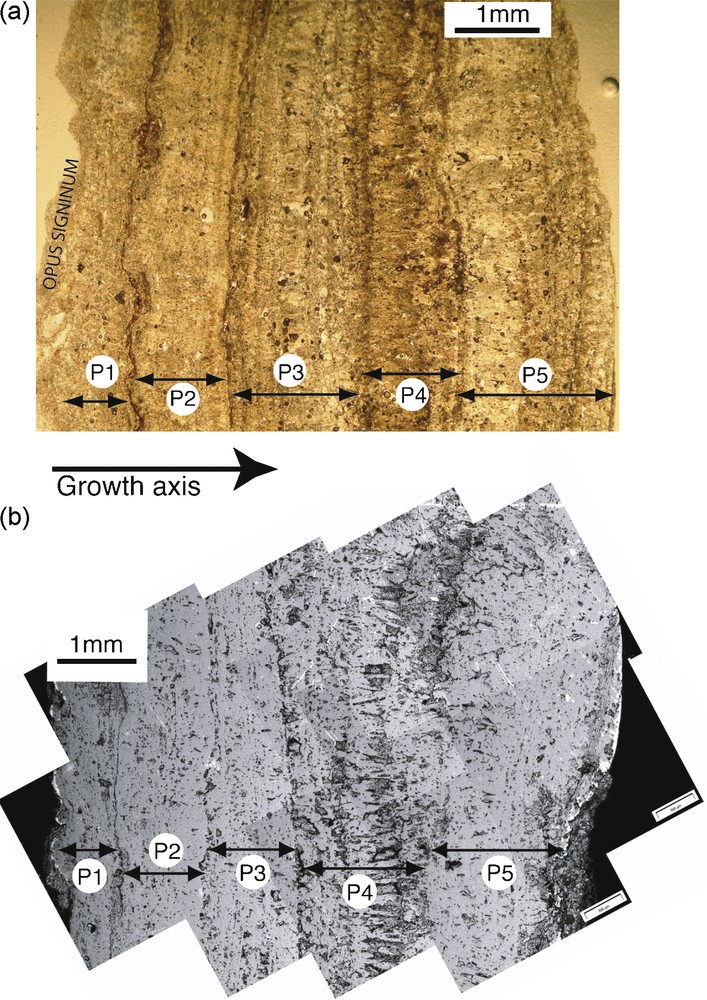
a: thin section photo from the deposit, locations of the layers separated by dislocation horizons zones are shown; b: SEM photoassemblage from the deposit in backscatter mode.
Fig. 2. a : photo de lame mince du dépôt avec localisation des différentes couches, séparées par des zones de dislocation ; b : photo du dépôt prise au MEB en mode de rétrodiffusion des électrons.
4.2 SEM observations and analyses
A SEM panoramic picture is presented in Fig. 2b. The five layers separated by discontinuity horizons observed during optical observation were also clearly identified during SEM observations (Fig. 2b). Energy dispersive X-ray (EDX) analyses were made on the micrometers grains trapped inside crystal discontinuities to determine the nature and variability of impurities. The main detected elements are Si, Al, Mg, Fe, Ti and Cu; this last element may be related to bronze objects, such as tools or water regulation devices.
4.3 Trace element analyses
The results of the LA-ICP-MS measurements for Mg, U and Pb from the first and second track are shown normalized in calcium on the Fig. 3. Data obtained for Si, Mn, Cu and Ce were below detection limit, except for occasional peaks from small grains within dislocations. These elements will no longer be considered. The displayed elements show well-defined high frequency oscillations at the 100 μm scale. Longer time scale trends are visible at the 1000 μm scale (Fig. 3a and b). The reproducibility of measurements is tested by comparing the LA-ICP-MS results along the two tracks. All the elements show very similar ranges and variations between the two tracks, reflecting lateral continuity.
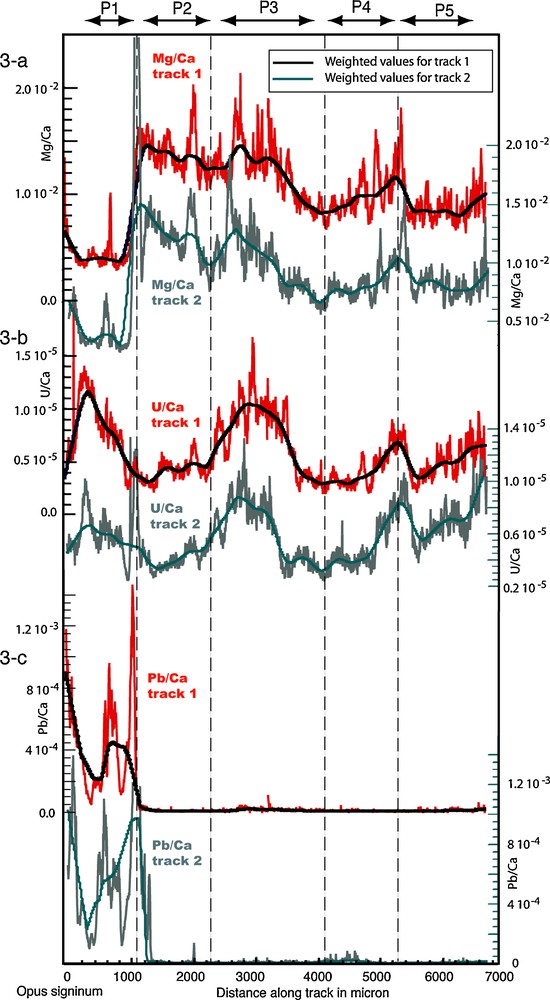
Trace elements measurements and corresponding weighted average plotted versus distance in microns over track 1 (top curves, left scale values) and track 2 (below track 1, right scale values) for Mg/Ca, U/Ca and Pb/Ca.
Fig. 3. Mesure des éléments traces et moyenne pondérée correspondante en fonction de la distance en microns au-dessus du tracé 1 (courbes du haut, valeurs sur l’échelle de gauche) et du tracé 2 (sous le tracé 1, valeurs sur échelle de droite) pour Mg/Ca, U/Ca, et Pb/Ca.
4.3.1 The lower frequency signal
In order to isolate the longer time scale, data were fitted with a locally weighted least square method (using the Kaleidagraph Synergy software tools) computed on a 100 μm running average. Raw data and the averaged values are shown in Fig. 3. The 100 μm filter efficiently cancels the higher frequency variations for most elements while preserving the lower frequencies (Fig. 3a and b), except for lead (Fig. 3c) indicating that higher frequency variations for this element are governed by a different mechanism. For each element, we observed a very strong similarity between the low frequency curves from the two tracks, the long-term trends are very reproducible. A more robust picture of the long-term variations was thus produced by calculating the mean values for each elements low frequency data from the two tracks. A fine correlation using optical observations and the ablation marks was made prior to calculation in order to account for possible variations in the layers size. The master averaged curves are presented in Fig. 4 for all the elements considered. The thin section photo is shown for comparison, albeit only indicative as the measurements were done on a polished thick section of the sample made at a few millimeters from the photographed thin section.
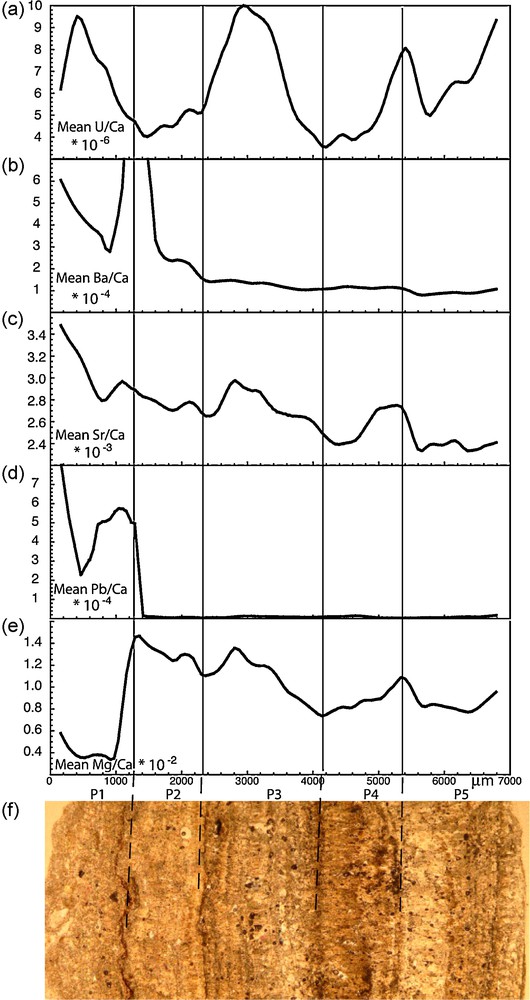
Merged weighted average trace element variations for U/Ca, Ba/Ca, Sr/Ca, Pb/Ca and Mg/Ca. The thin section photo is shown.
Fig. 4. Courbes moyennes pondérées des variations des éléments traces pour U/Ca, Ba/Ca, Sr/Ca, Pb/Ca et Mg/Ca. Une photo de la lame mince est montrée.
A first observation on the long-term trend is that episode P1 is associated with a different trace element composition. This is shown by Pb/Ca ratios where values are high within the P1 layer and decrease by a factor of 50 within the other layers. This episode is also characterized by significantly lower Mg/Ca values. High Ba/Ca values at the junction between P1 and P2 are probably linked to barium rich impurities. Another observation is that, excluding P1 layer, Sr/Ca and Mg/Ca are showing sympathetic variations, decreasing in P2, increasing at the beginning of P3 to decrease again, then increasing in P4 and showing a decrease at the junction with P5. The U/Ca ratio is showing pronounced oscillations, an antipathetic relationship with Mg/Ca and Sr/Ca within layer P2 and a sympathetic within P3, P4 and somehow P5 layers.
4.3.2 The higher frequency signal
In order to isolate the higher frequency signal the data were “detrended”. This was done for each element by subtracting from each individual raw measurement the averaged value obtained at the same location using the locally weighted least square method. A residual value is therefore obtained at each location and can be plotted. As an example the residual variations for Mg/Ca, Sr/Ca, Ba/Ca, and U/Ca, are represented in the P3 layer for the first track (Fig. 5). The same variation pattern is observed between the first and second track, an example is given with the U/Ca ratio represented for the second track on Fig. 5e, confirming the reproducibility of the high frequency signal from the two laser ablation tracks. The thin section photo is displayed, a number being given to each dark lamination. Due to the small size of the sample it is difficult to associate petrologic observations to the trace element record; however, between seven and eight laminations are observed and the same number of peaks can be counted for most elements. This is advocating for a strong first order correlation between the observed laminations and the trace element variations. However, at the peak scale the relationship between elements is variable. This can be observed on Fig. 5, a grey shading was added to the well-defined positive peaks from the U/Ca record, peak 1 corresponds to a transition between low values to high values in the Ba/Ca and Sr/Ca record and a peak in Mg/Ca while peak 6 corresponds to medium values in Ba/Ca, high in Sr/Ca and low values in Mg/Ca. This does not imply that there is no relationship between the elements but that small cycle offsets between the trace elements records occur.
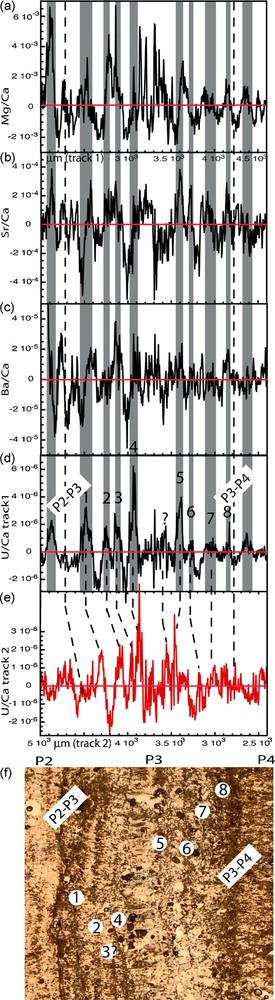
Residual trace element variations highlighting the short-term cycles for track 1 and layer P3 for Mg/Ca, Sr/Ca, Ba/Ca and U/Ca. The U/Ca ratio is also represented over track 2, the most likely correspondence between peaks is shown on the Figure. The grey shaded areas correspond to high U/Ca values. The transition between layer P2 and layer P3 and layer P3 to layer P4 are indicated.
Fig. 5. Variations résiduelles des éléments traces mettant en évidence les cycles à court terme dans le cas du tracé 1 et du niveau P3 pour Mg/Ca, Sr/Ca, Ba/Ca et U/Ca. Le rapport U/Ca est aussi représenté dans le cas du tracé 2 ; la correspondance la plus probable entre les pics est indiquée sur la figure.
5 Discussion
5.1 Trace elements incorporation within calcite
Trace element variations within the deposit depend on the changes of composition of the water from which it precipitates and on the evolution of locally controlled partition coefficients at the calcite precipitation interface. Other local parameters at the sample scale, as occurrence of preferential nucleation sites, are suspected to also play a role [24].
The chemical variability of the water is controlled by the dissolution/precipitation history along the water percolating route within the soil and canalization. Important parameters are the soil composition, water residence time, the organic matter content and partial pressure of soil CO2.
The partition coefficient for each element will be locally dependent on parameters such as temperature and growth rate [23].
5.2 Evidence for at least two water origins and the question of lead
In order to characterize the different chemical compositions within the successive layers the trace element variations were plotted against each other in Cartesian diagrams. Fig. 6 displays three examples: U/Ca vs Mg/Ca, Ba/Ca vs Sr/Ca and Ba/Ca vs Mg/Ca. On all the diagrams the P3, P4 and P5 layers form a trend, as expected for carbonates precipitating from a common water source. P1 data are clearly of different composition as already observed looking at the longer-term trends (Fig. 4). A possible issue concerning P1 is the contamination by the underlying material. Petrological observations and chemical analyses [8] show that the underlying opus signinum is rich in iron, silicium and magnesium but poor in lead (below the microprobe detection limit). The low magnesium concentration as well as high lead content within P1 layer is advocating for a low contamination from the underlying material as increase in magnesium content and decrease in lead would occur in a contaminated layer compared to the subsequent layers. This leads us to think that although diffusion could have an impact we do not believe it is significant in our case and it does not explain the chemical difference between P1 and subsequent layers.
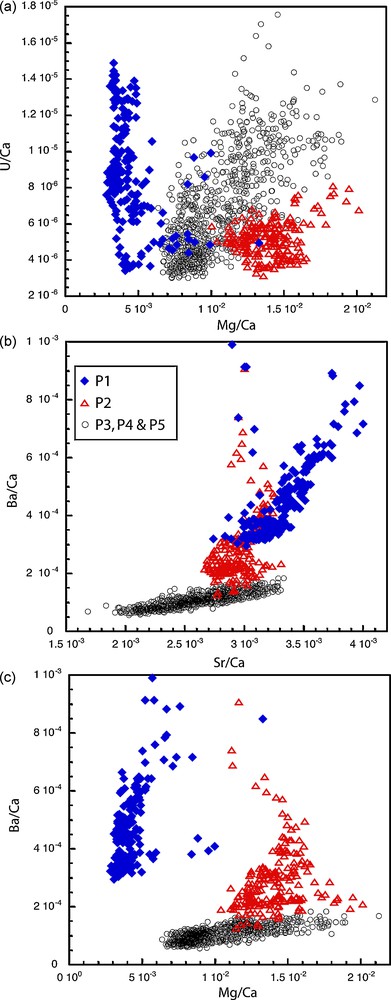
Trace elements variations represented in classical Cartesian diagrams. a: U/Ca vs Mg/Ca; b: Ba/Ca vs Sr/Ca and; c: Ba/Ca vs Mg/Ca. Blue diamonds are associated to layer P1 data, red open triangle to layer P2 data and black open circles to P3 through P5 data.
Fig. 6. Rapports des éléments traces représentés dans des diagrammes cartésiens. a : U/Ca vs Mg/Ca ; b : Ba/Ca vs Sr/Ca et ; c : Ba/Ca vs Mg/Ca. Les losanges bleus correspondent aux données de la couche P1, les triangles rouges vides à celles de la couche P2 et les cercles noirs à celles des couches P3, P4 et P5.
Interestingly, most of the P2 layer data seem to follow as well a different trend than P3, P4 and P5. This peculiar behavior was not obvious from Fig. 4. Layer P1 geochemical signal is easily interpreted as being the hallmark of an early water source, a change in the water occurring at the P1–P2 interface. Layer P2 data could be interpreted as representing an intermediate stage between the water from layer P1 and the water from layer P3, P4 and P5. This implies a progressive replacement of one source by the other and the use of two collecting sources simultaneously during P2 interval. This interpretation is consistent with all the geochemical data except the U/Ca vs Mg/Ca ratio (Fig. 6a) showing that P2 composition is slightly elongated towards Mg/Ca high values for low U/Ca values and do not plot as a transitional composition from P1 to P3. One can wonder if these three different groups of data can represent three different sources of water successively used through time but this would imply short periods of use for each source, which is unlikely. We therefore favor the hypothesis that P2 represents a transition between two different sources of water.
Among the concentration changes at the P1–P2 transition (Fig. 3) the sharp decrease in lead concentration is of high interest as lead is known to be toxic to humans, even at small concentrations. The Romans were widely exploiting this material as attested by local and distant contamination [1]; high lead content has even been found in Greenland ice cores spanning the Roman period revealing the importance of the lead industry [22]. The historical importance of lead production and use is such that anthropogenic poisoning has sometimes been invoked (although this is contested) as one of the causes of the Roman Empire decline [32]. The question of lead transfer from the contaminated environment to the people is critically raised in the case of the lead plumbing carrying water [20]. The significant lead content found within P1 is probably a hallmark of the leaching from the pipes used to supply the water but also of the low incrustation power of the flowing water. In this scenario the small P1 deposit was probably formed due to occasional crystallization made possible by transient external factors such as high evaporation due to high external temperature. We interpret the insignificant lead concentration in the following layers to the higher calcium content in the flowing water, sufficient to quickly form incrustations insulating the lead pipes. This interpretation is also consistent with the more resolved laminated growth band structures from P2 to P5 layers corresponding to denser and more continuous crystallization. In addition, a partial removal of the lead pipes could also have occurred at the P1–P2 transition. While it is difficult and beyond the scope of this article to evaluate the lead intake per liter of water drunk from the analysis of this deposit, the water corresponding to P2 through P5 deposits (also called source 2 in the following) seems to have been more suitable for human consumption. In term of source locations, the low calcium content of source 1 would relate it to the more volcanic terrain around the city of Ostia, while source 2 would be more related to the carbonatic successions below volcanic terrains (Fig. 1). The transition between P1 and the next layers would thus mark an important geographic change in the source capture area.
5.3 The long-term variations, the case of Mg/Ca, Sr/Ca and U/Ca
Except for P1, which has been discussed before, Mg/Ca and Sr/Ca follow the same long-term trend within all layers. The sympathetic long-term variations in Mg and Sr reflect similar dissolution/precipitation sequences for these elements without differential rock dissolution. Higher Mg/Ca and Sr/Ca ratio in water can be caused by prior calcite precipitation due to degassing. Because the partition coefficients for Mg/Ca and Sr/Ca into calcite is much less than one [23,35], calcite precipitation increases the trace element contents in the remaining solution. In the case of the Ostia deposit early calcite precipitation is probably important as calcite was precipitating along the water supply network before reaching the castellum aquae. An increase (respectively decrease) in Mg and Sr would be related to an increase (respectively decrease) in calcite precipitation in the plumbing. In our case it is likely that changes in the water rate, an increase due to narrowing of the plumbing by precipitation or a decrease due to cleaning of the plumbing for example will change the prior precipitation rate and therefore Mg and Sr content within the deposit. The role of bio-mineralizing bacteria and algae could also be important and contribute as a precipitation enhancement factor depending on the supply network state and the occurrence of chemical such as nitrogen within the water. Another important factor could be linked to anthropic modifications of the water routing; no interpretation is favored for the observed variations.
The U/Ca content shows opposite variations with Mg/Ca and Sr/Ca within layer P2, but mostly similar for P3, P4 and P5. This suggests that uranium is mainly controlled by the same parameters than Mg and Sr but that at least another parameter is dominant during the P2 interval. The U/Ca behavior could be controlled by the influence of the earlier source in the mixing scenario. In a recent study, Treble et al. [37] show that the uranium content in a recent speleothem has a positive relationship with rainfall in the long-term and may be a valuable paleohydrological indicator. The behavior of uranium in our deposit could thus be also more sensitive to rainfall than Mg and Sr but, because of the complexity of the deposit involving at least two sources of water, no inferences can be made.
5.4 The short-term trend: are there seasonal markers?
A few studies have been published on trace element variations from banded stalagmites and give sometimes complicated results [9,12,24,25,34,36,37]. An example is given in the study of Huang et al. [24] who reported trace element composition on modern speleothems from an Italian cave and found an annual signal in Mg/Ca and Sr/Ca and a spatial relationship with the lamination but contrasted relationship depending on the nature of the deposit (covariance of Mg/Ca and Sr/Ca in a stalagmite but antipathetic variations in a stalactite) indicating a strong influence of growth conditions. These studies show that the incorporation of trace elements within a carbonate deposit is complex and may vary at the scale of a cave. Still, the recent development of such studies has led to a better understanding of the sensitivity and relationship to environment proxies and shows that such carbonates have great potential [13]. The relationship from speleothems to archeological deposits is probably not straightforward but the same mechanisms could hold. Seasonal variations in trace element concentrations are also expected as the water composition and the distribution coefficients will both vary on a year basis. Factors such as the partial pressure of CO2 within soil are highly dependant on temperature and vegetation growth and can be an order of magnitude higher in summer than in winter [10]. This will enhance the dissolution processes along the water path and change the water composition. A higher water residence time due to shortage in rain during the hot season is also playing a role in increasing dissolution. Distributions coefficients are also seasonally driven through temperature and water flow.
Short time variations are observed on the Ostia deposit and a tentative scenario can be proposed to link these variations to a seasonal signal. Ostia benefits of a mild Mediterranean climate with rather hot and dry summer months. The Mg/Ca distribution coefficient is very sensitive to local temperature, experimental studies show an increase by 50% following temperature from 15 °C to 25 °C [23,31]. Hence, higher Mg/Ca content could tentatively be linked to summer months. A longer water rock residence time during summer months would also lead to higher Mg content. The uranium ratio values show well-defined short-term oscillations (Fig. 5); high peaks mostly correspond to darker laminations and occur within high peaks in the Mg/Ca ratio. Darker laminations could correspond to higher organic content layers formed during the dryer months. This episode would be associated with high U/Ca, as uranium is commonly associated with organic matter [27]. Sr and Ba follow lagged cycles with more structures which could be related to late summer or autumn rains. Of course this tentative scenario remains to be firmly established but archeological carbonate deposit records could be of high interest to compare to speleothem records and identify specific environmental drivers at the year scale.
5.5 Duration
If we hypothesize that trace element variations and colored growth bands are seasonal, we then can have some insights on the duration spanned by the deposit. Due to the low incrustation power of the source 1 water it is difficult to infer a duration for P1 period, the crystallization might be mostly controlled by evaporation and cycles were very hard to identify. During each of P2 and P3 episodes, seven to eight cycles can be identified, five to six during the thicker lamination event of P4 and around nine to 10 during P5. The total of c.a. 30 cycles for P2 through P5 corresponds to the recorded use of the more calcareous (source 2) water. Caution should be use to translate this cycles number in a duration, but under the hypothesis of trace element annual variations approximately 30 years of source 2 water supply would be registered in this sample. The transition between source 1 and 2, recorded during the P2 interval, would last a few years. Between successive layers, interruptions due to human intervention or to dry events happening regularly are recorded. The suggestion that variations in the long-term internal structure of carbonate deposits could reflect dryer events has been reported in the case of the Fréjus aqueduct [11]. In this study the author reported the possible occurrence of a 7–8 year hydrologic cycle maybe linked with the North Atlantic Oscillation. Similar suggestions (albeit with a 11 years solar cycle) have been made by Genty and Quinif [17] studying Belgian stalagmites. At this stage, an anthropological cause is preferred for the transitions observed in the Ostia deposit, cleaning of the canalization or short time catch of the water for another purpose are our preferred explanations.
6 Conclusions
Our study is, to our knowledge, a first LA-ICP-MS application to archeological carbonate deposits. It demonstrates that meaningful information can be derived even in the case of a very small deposit. Combinations of trace element diagrams allow to evidence differences in the chemical compositions of the deposit. This is interpreted as the hallmark of two successive sources of water used by the Romans. The two sources were possibly used simultaneously during a transition period spanning a few years. Another significant result of this study is that, as in cave speleothems, a long-term and a short-term coherent chronological geochemical signal seems to hold for such archeological deposits. On the shorter-term, the variations in trace element record are to be linked with seasonal variations of parameters as temperature and rain amount. Such deposits have great potential as paleoenvironmental proxy recorders over the Roman period especially used in complement with speleothems studies and confronted with the archeological method results.
Acknowledgements
We thank Michel Dubar and an anonymous reviewer for their comments, which contribute to improve the manuscript. We are grateful to Anna Gallina Zevi and Margherita Bedello for their collaboration on the site, to Nathaniel Findling for help with the SEM, to Julia de Sigoyer for discussions and to Isabelle Lerogeron for graphics solutions. This study was made possible thanks to École française de Rome, CNRS, École normale supérieure and IRAA financial supports.
Vous devez vous connecter pour continuer.
S'authentifier