

1 Introduction
Soil is a three-dimensional (3D) continuum characterised by a spatial variability in all the dimensions of space. Its thickness (generally decimetres to metres) is relatively small compared to its lateral extension (from hectometres to kilometres). This represents a substantial difficulty for 3D approaches. Thus, despite their obvious 3D organisation, soils are generally studied in two dimensions by pedological approaches in sequences or by geostatistics.
Pedological approaches in sequences were first theorised by Jenny [14] who studied the impact of a single factor on the evolution of the soil through time and space. For instance, he discussed the impact of the slope by studying soil distribution along toposequences, keeping all other factors as constant as possible. In this case, topography is only represented by one terrain attribute. This approach has been widely used in many pedological studies and remains a valuable tool to study soil evolution as recently discussed by Huggett [13]. However, soil sequences are generally designed to emphasise the impact of one factor of variation – often a single attribute, the slope –, while the others are generally neglected. In order to overtake this limitation, an approach called “structural analysis” was developed [3,4,9,16]. In these approaches, 3D blocks diagrams of soil distribution were derived from the analysis of several toposequences varying in intensity and orientation of the slope. As these block diagrams are based on the interpretation of the toposequences, they do not allow the observation of variations that would have been missed in the 2D approach.
Approaches based on geostatistics were developed in order to acquire an exhaustive quantification of the soil variability [17]. They aim classically at obtaining the spatial estimate of a soil variable. Nevertheless, these approaches deal mainly only with one horizon and more rarely with two that are compared [5].
Salvador-Blanes and coworkers [23,24] demonstrated that maps are useful for understanding pedogenesis by coupling toposequence and geostatistical approaches. We deduce from this work that a 3D representation of soils, as 2D maps, should improve our understanding of pedogenesis.
Despite many attempts in recent years [1,2,12,20,21], 3D numerical modelling of soils can still be considered as being in its infancy and is generally based on soil properties [22,26] less frequently on the organisation of soil volumes in the 3D space.
In this paper, we demonstrate how a 3D representation of soils evidences soil processes that were missed in the two dimensional approaches. For the sake of our demonstration, we will discuss the distribution of Planosols since their pedogenesis is driven by lateral processes [8]. These soils represent thus an ideal case for such a study.
2 Study site and sampling method
2.1 The study site
The study site is located on the Aigurande plateau in the northern part of the French Massif Central (Fig. 1). It is underlain by amphibolite and gneiss. It is a footslope where Planosols developed on B-horizons and alterites of gneiss [23,24]. The upper horizons of the Planosols are allochthonous and derived from colluvial materials of gneissic origin, while the B-horizon (below 50 cm depth) and the alterite are developed from gneiss. Colluvial materials differentiate into four horizons: a clay-loam organic-rich A-horizon (25 to 30 cm thick) and three types of E-horizons [6], noted E1, E2 and E3. E1 contains no nodules unlike E2 and E3, that both are nodule-rich. E3 also contains gravels.
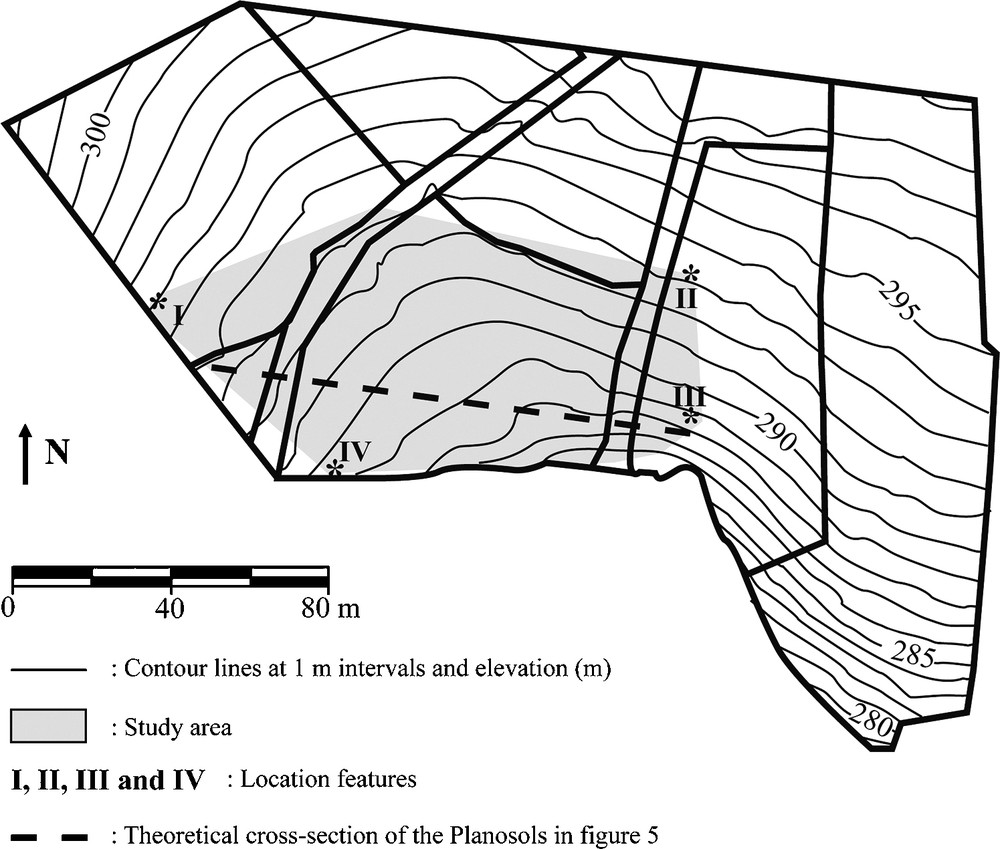
Location of studied sector after Salvador-Blanes et al. [25].
Fig. 1. Localisation du secteur étudié d’après Salvador-Blanes et al. [25].
2.2 Sampling and available data
In the studied zone, 105 sampling points were selected randomly according to two square cell grids (with 25 m and 40 m cell size respectively) during two sampling campaigns. These points were sampled with a 1.2 m auger. In the case of the sampling points located on the 25 m cell grid, soils were dug to the bedrock or to the end of the auger where the bedrock was deeper than 1.2 m. In the case of the 40 m square grid, soils were only augered to the top of B-horizon to allow surface water sampling. Each sampling point is characterised by its coordinates (X, Y and Z), the type and the thickness of each horizon, and its descriptive characteristics: texture, colour, visual abundance of gravels and nodules. Abundances in both gravels and nodules were classified, based on the soil descriptions, into the following classes: none, weakly abundant, moderately abundant, abundant and strongly abundant. B-horizons and alterites could not be differentiated by augering. They will thus be named in the remainder of this paper as “B-horizons” and characterised by their texture or redox status.
A detailed Digital Elevation Model (DEM) [25] of the area was also obtained with 4600 elevation points measured in the field using a laser tacheometer (Leica TC500).
Manganese was analysed in soil samples from horizon E3 by ICP-AES after fluoridric acid (HF) dissolution and in the free water sampled from the upper horizons (A to E3) by ICP-AES.
3 3D modelling
Horizon designation is a qualitative data. To our knowledge, available 3D interpolation methods are mostly developed for quantitative data [19]. For that reason, only few references of 3D modelling of soil horizons exist in the literature [10,11,27].
Grundwald and Barak [10,11] presented a 3D soil-landscape using virtual reality modeling language (VRML) and interpolating data in the horizontal and vertical dimensions separately.
Santos et al. [27] developed a 3D soil horizon model in a Swiss floodplain using a quadratic finite-element method. Our approach is partially derived from their work [27]. Fig. 2 summarises the various steps performed to obtain “pseudo” 3D visualisations of Planosols. Both ArcInfo® and ArcGIS® softwares were used. The pedological data are converted to a triangular irregular network (TIN) structure and then spatialised using 2D interpolation to cells raster datasets. The resulting raster represents the elevation of the soil surface, the thickness of each horizon and the other characteristics of each horizon. Rasters for the elevation of the soil surface and the horizon thicknesses can be combined to obtain the horizons upper limit elevations. These are then used to obtain “pseudo” 3D representation by horizon thickness extrusion.
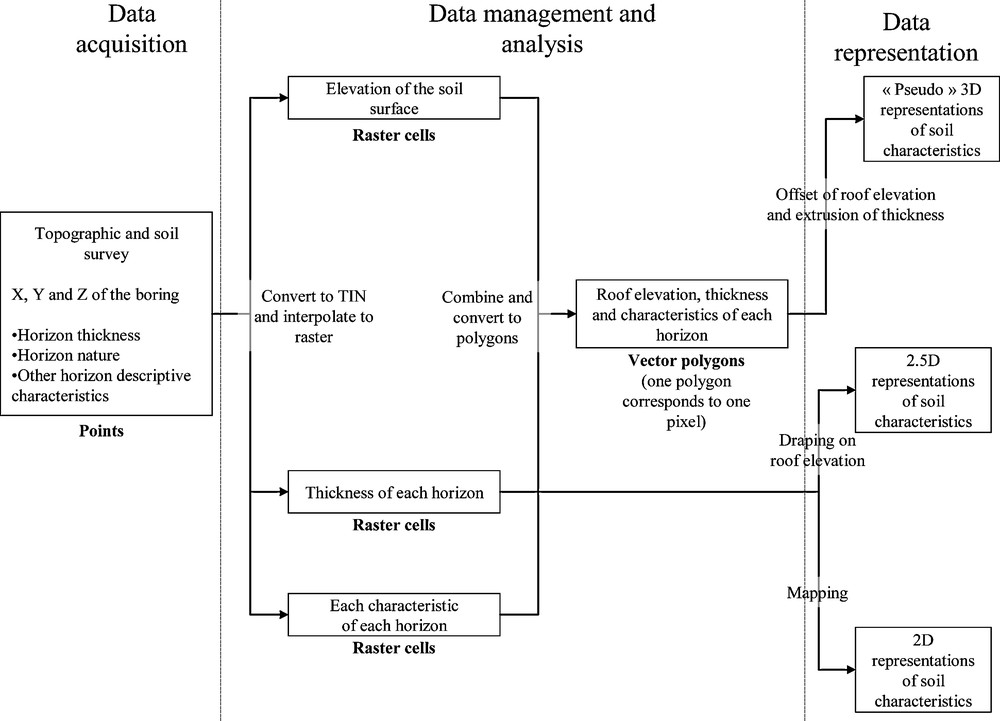
Schematic representation of the 3D approach.
Fig. 2. Représentation schématique de l’approche tridimensionnelle.
4 Impact of the spatial variability of the poorly permeable horizons on the development of the upper horizons
We first studied the 3D variability of the B-horizons, which act as a poorly permeable layer over which the lateral runoff occurs. These horizons are thus responsible for the development of the Planosol [6]. The aim was to identify whether the variability in thickness or characteristics of these horizons could influence the subsequent development of the upper Planosolic horizons and their variability described by Cornu et al. [7]. For that reason, two main characteristics of the B-horizons were considered: their oxidation status considering three classes (oxidized, gley and gley that was reoxydized) and their texture.
The 3D representation evidences the existence of a spatial organisation of the various B-horizons that was not demonstrated in the previous studies [23]. Two main features were evidenced: the presence of a heavy clay hillock (Fig. 3a) that is north-south oriented and located in the middle of the studied area, and the presence of gleyic horizons at depth.
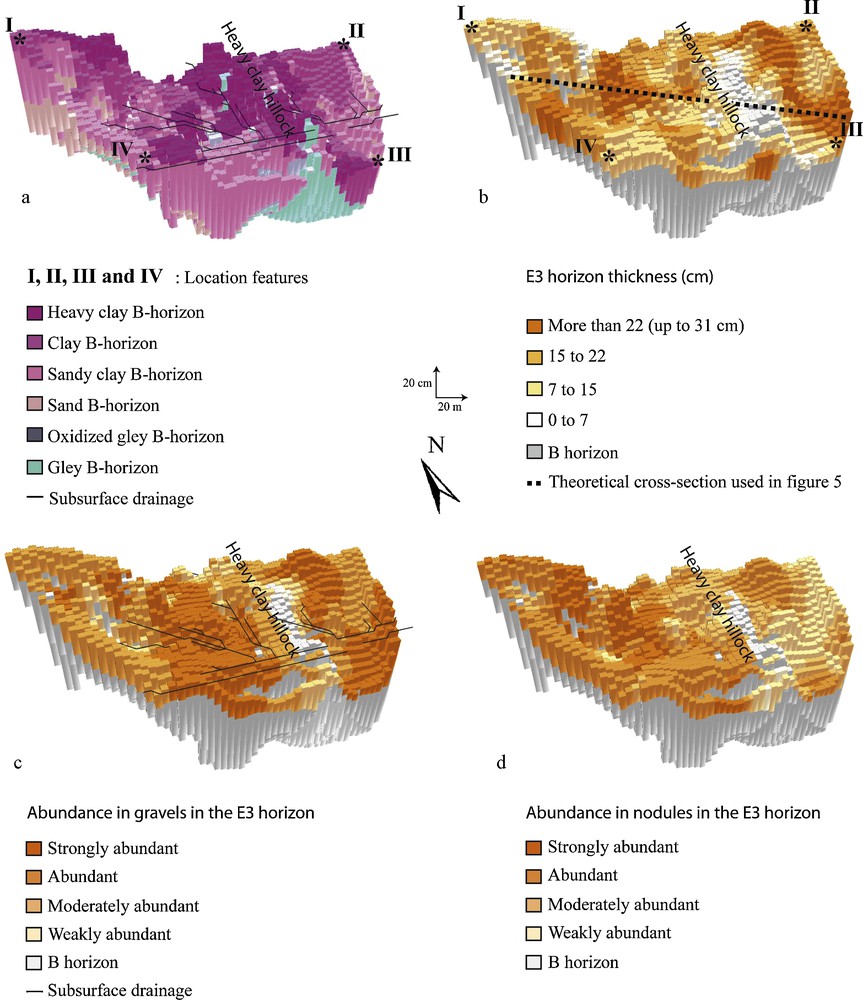
a: 3D representation of the various B-horizons and subsurface topography; b: spatial variability of E3-horizon thickness; c: abundance in gravels in the E3-horizon and subsurface drainage; d: abundance in nodules in the E3-horizon.
Fig. 3. a : représentation tridimensionnelle de la variabilité spatiale des horizons B et topographie de subsurface ; b : variabilité spatiale de l’épaisseur de l’horizon E3 ; c : abondance en éléments grossiers dans l’horizon E3 et écoulement de subsurface ; d : abondance en concrétions dans l’horizon E3.
Two textural gradients depart from the clayey hillock as the texture becomes coarser from the upper B-horizon to the deepest one and from the hillock to the edges of the studied area. This is interpreted as a weathering gradient – the finer-textured horizons being the most weathered ones – resulting from the original heterogeneity of the gneiss observed by Salvador-Blanes [23].
This subsurface topography results in two distinct subsurface drainage networks roughly north-south oriented (Fig. 4) while the surface runoff is mainly north-west to south-east oriented (Fig. 4d).
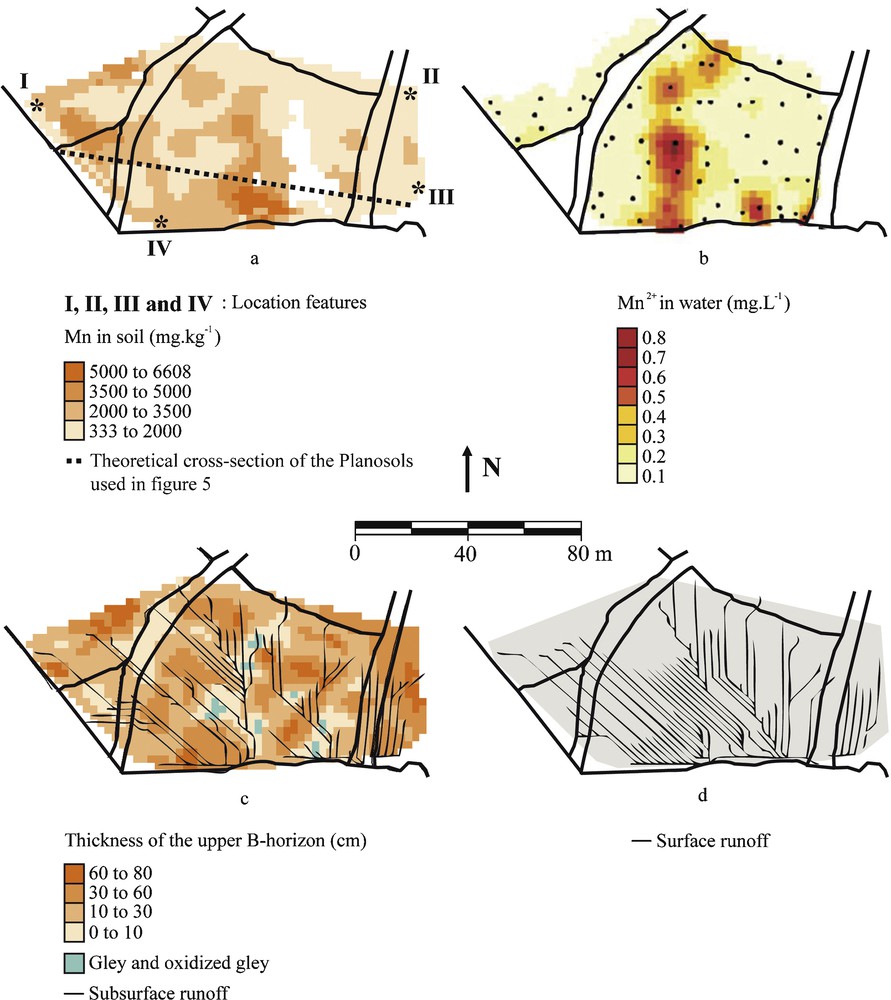
a: manganese concentrations in E3-horizon; b: manganese concentrations in the perched temporary water table; c: thickness of the upper B-horizon; d: surface runoff.
Fig. 4. a : concentrations en manganèse dans l’horizon E3 ; b : concentrations en manganèse dans la nappe perchée temporaire ; c : épaisseur de l’horizon B superficiel ; d : écoulement de surface.
As most of the transfers occurring in this soil are related to the presence of the clayey B-horizon, this spatial distribution of the subsurface drainage network should have consequences on the morphological differentiation of the upper soil horizons of the Planosol. This variability was thus studied in link with that of the underlying B-horizons. Cornu et al. [7] extensively studied the variability of the E-horizons along a toposequence. They evidence three main parameters of variability of these horizons: their thickness, their amount of nodules and of gravels. Gravels are more concentrated at the west and east sides of the heavy clay hillock where the subsurface topography is concave (Fig. 3c) and the E3-horizon is thicker (Fig. 3b); no clear correlation was however derived. The abundance of Fe-Mn nodules, in horizon E3, do not show a clear spatial distribution pattern with the exception of a lower abundance on the east side and of a higher abundance (Fig. 3d) on the west side of the hillock. The thickening of the E3-horizon and the larger abundance in gravels can be explained by filling and venting processes that occurred during the formation of the upper allochtonous horizons in link with the morphology of the B-horizon. This does not however explain the dissymmetry in abundance of nodules on both sides of the hillock.
5 A possible connection of the groundwaters
Horizons E2 and E3 are characterised by the alternation of reducing and oxidizing conditions. These are evidenced by the presence of Fe-Mn nodules [6]. This is due to the presence of a temporary perched water table in these horizons observed in the field in winter conditions (from January to April mainly). The formation of soil nodules by alternation of reducing and oxidizing conditions is well described elsewhere [15,18,29].
These horizons exhibit a thickening along the two sides of the previously described hillock, with a higher content in nodules on the west side resulting in higher concentrations in Mn (Fig. 4a). This enrichment of E3-horizons in Mn also corresponds to a higher richness in the perched temporary water table (Fig. 4b). The question is to determine whether the composition of the E3-horizon is responsible for the composition of the water, that is to say the nodules are undergoing dissolution, or the water composition is responsible for the present formation of the nodules into the E3-horizon with an external source of Mn.
Two potential external sources of dissolved Mn can be hypothesised, either a surface origin or a deep one. Indeed, the north-south drainage axis may drain waters from the neighbouring plot in which soils are developed from amphibolite. These soils are rich in Mn [23,24] and may thus produce soil water rich in Mn. Alternatively, gleyic B-horizons were observed under the clayey hillock, indicating the presence of a permanent and reducing groundwater table. Fig. 4c shows that the thickness of the upper B-horizon decreases in the western part of the studied sector, being only 0 to 10 cm thick, while it is thicker on the remainder of the sector. Thus, a possible connexion between the temporary surface water circulation and the deep groundwater located in the gleyic B-horizon could occur in this area. Indeed, the deep groundwater is reductive, it may be rich in dissolved Mn. Other samplings are needed to confirm that hypothesis as only few of them were dug in this area.
These two hypotheses may explain the spatial distribution of Mn in the water of the perched water table. A detailed characterisation of the spatial variability of these waters is needed to definitely conclude on the validity of these hypotheses.
6 Conclusion: inputs of the 3D approach to the understanding of the Planosols formation
The studied Planosols are developed on B-horizons and alterites of gneiss as already demonstrated elsewhere [7,23]. The parent gneiss material was shown to be mineralogically highly heterogeneous (Fig. 5a; [23]).
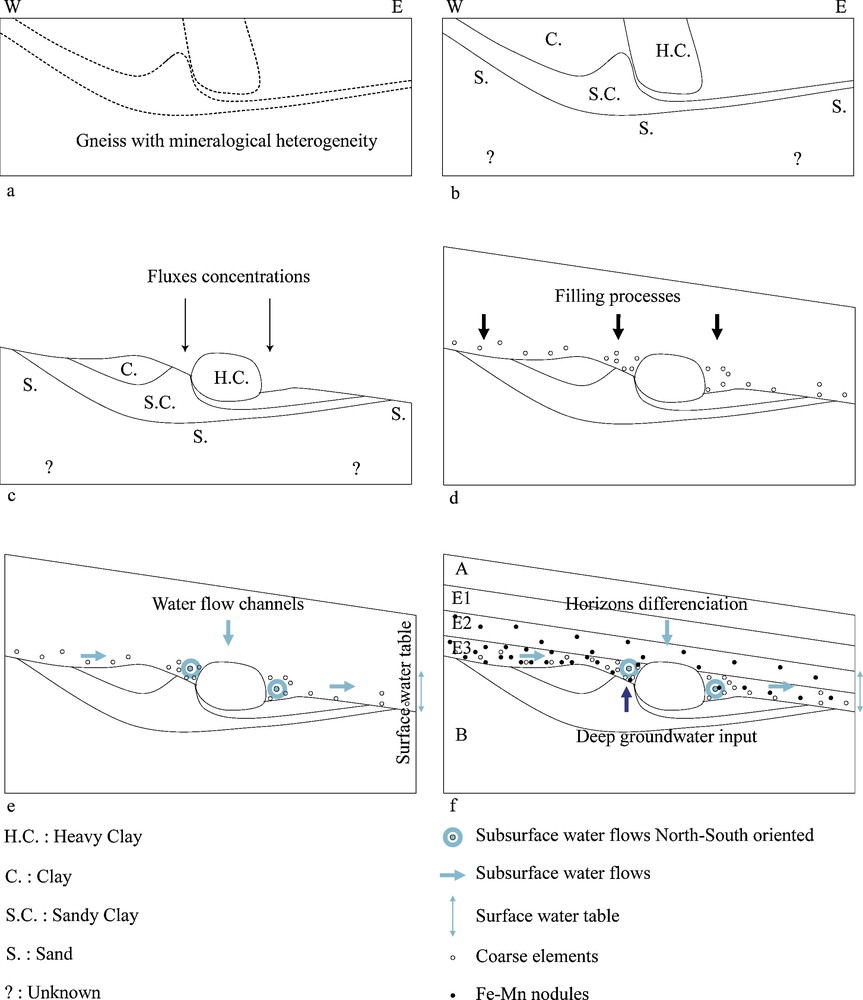
Schematic representation of the Planosols formation at Bois Maillot. a: parent gneiss mineralogically highly heterogeneous; b: differential weathering leading to a contrasted texture B-horizons; c: differential erosion phase; d: deposits of quartz gravels and fine colluvium; e: appearance of subsurface lateral flow at the upper limit of the B-horizons and subsequent formation of nodules; f: current distribution of the Planosols.
Fig. 5. Représentation schématique de la formation de la couverture Planosolique du Bois Maillot. a : gneiss parental très hétérogène minéralogiquement ; b : phase d’altération différentielle à l’origine des horizons B à textures contrastées ; c : phase d’érosion différentielle ; d : dépôt de graviers de quartz et des colluvions fines ; e : apparition de flux latéraux à la surface des horizons B et formation des concrétions ; f : distribution actuelle des Planosols.
On the basis of the B-horizons spatial variability, we suggest the following soil evolution sketch schematically represented in Fig. 5b. The weathering of the heterogeneous parent gneiss led to the development of a vertical and a lateral textural gradient along the studied area. The formation of the subsurface hillock is supposed to be due to a differential erosion phase (Fig. 5c). It could have occurred under a colder climate than that leading to the weathering of the parent gneiss material. Such succession of processes has been previously described in the literature in other pedogenetic contexts [28]. In addition, clayey material are known to be more difficult to erode than sandy ones, thus leading to the development of the present subsurface topography, including two channels on both sides of the hillock.
During the periglacial period, a new erosion phase allowed the deposits of coarse quartz (Fig. 5d). The channels along the hillock may have concentrated the deposit of gravels due to the differential surface topography at that time. Fine colluvium filled the little dimple of subsurface topography, leading to a thicker E3-horizon especially in the western part of the study area.
The textural difference between the gravels and the B-horizon induced preferential lateral flow at the top of the B-horizon and the presence of a temporary perched water table, leading to the formation of the nodules within the E2 and E3-horizons (Fig. 5e). The subsurface topography also induced two preferential water drains at the surface of the B-horizons roughly north-south oriented. However, a discrepancy in the abundance of nodules along both sides of the hillock is observed. Various hypotheses are invoked to explain this phenomenon: a higher flux concentration along the west of the hillock or the existence of another source of water, rich in Mn in that part of the area.
This pseudo 3D approach brings new elements for understanding the spatial distribution of these Planosols (Fig. 5f). Previous studies showed that they were influenced by their position along the slope [6] and by anthropogenic features [25]. We here demonstrate that subsurface topography, resulting from differential weathering that expresses the original mineralogical heterogeneity of the gneiss parent material, also influences their spatial differentiation. As a conclusion, this approach allows evidencing the consequences of the initial weathering phases on a later pedogenesis.
We thus demonstrated that 3D modelling is a useful tool for understanding pedogenesis in addition to traditional 2D approaches. Nevertheless, it should be improved on various aspects. Indeed, the technique of spatialisation performed in this study is very simple. It could be improved by the use of geostatistics that would allow assessing the spatial structure of the studied variables and estimating errors of prediction. Finally, the use of exhaustive data – obtained by geophysical survey notably – could increase our knowledge of the spatial distribution of some of the key horizons. This data could then be re-injected as input data in the 3D model.
However, this study is a first attempt at soil 3D modelling. In the absence of 3D interpolation tool for soil qualitative data, this pseudo 3D approach represents an efficient compromise, quick and simple, which highlights processes that were missed by 2D approaches.
Acknowledgment
The authors are grateful to the Region Centre that funded this work as part of the Metaloe-Metaspace project.