

1 Introduction
The Seine estuary, extending over about 160 km from the river mouth to the dam of Poses (Fig. 1), is a macrotidal and hyposynchrone estuary. The tidal amplitude reaches seven metres during spring tides at Le Havre. The mean river discharge is of 480 m3/s and varies from 100 m3/s to 2000 m3/s. In this river, suspended particle matter (SPM) varies from a few tens of milligrammes per litre at the free surface to 10 g/l near the sediment bed in the zone of accumulation of suspended materials called turbidity maximum (TM). This last zone moves downstream and upstream following the ebb and the flood tides. The extension and the movement of the TM mainly depends on the tide and the river flow. Obviously, Brenon et al. [5] showed with numerical simulations that the tidal wave asymmetry, caused by hydrodynamical and morphological effects, is responsible for the formation of the TM. Density stratification only affects the form and slightly the location of the TM.
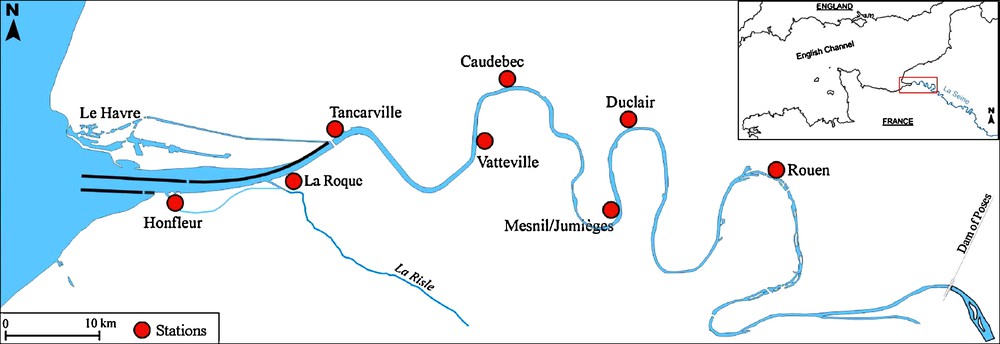
Map of situation.
Fig. 1. Carte de situation.
The hydrosedimentary models previously applied to the Seine river are based on the passive scalar hypothesis. In this approach, the settling velocity is imposed by an empirical relation [21]. The main difficulties reside in the prescription of sediment exchange fluxes between the sediment bottom and the water column [12,17] which needs a great amount of in-situ data for the calibration step [19]. Since the early 1990s, an alternative approach for sediment transport, namely the two-phase flow modelling for sediment transport, has been developed [4,13,20]. It differs from the classical one by solving mass and momentum equations for each phase: the fluid phase for the water and the solid phase for the sediment. The solid phase can be considered as a continuum since the spatial scale of averaging is large enough compared to the particle's diameter. This approach gives a theoretical framework for sediment transport modelling including fluid–particle and particle–particle interactions. Given pertinent closures, these models should be able to represent the whole sediment transport processes such as suspended transport, sedimentation and consolidation. The major interest regarding the classical approach consists in the continuous treatment of the whole domain: the sediment fluxes are integrated in the model equations.
In this article, we present intermediary results of numerical simulation for the TM in the Seine estuary, using a width-integrated 2D vertical two-phase flow model. Such an application is original and represents a step in the development of a two-phase flow model for sediment transport in estuaries. We point out that the present application is process oriented, the main objective being to demonstrate the capability of the two-phase approach to deal with the TM in an estuary. As the two-phase modelling for sediment transport is in an early stage of development, some specific processes for cohesive sediments are not accounted for in the present model. So the comparison with in-situ measurements can only be very qualitative for the moment.
2 Description of the model
In the present model, two phases are considered, a fluid phase and a solid phase for the suspended particle matter (SPM), using an Eulerian approach for both phases. Each phase is treated as a continuum and the governing equations consist of two equations for mass and momentum conservation [6]. Such a model was developed by Barbry et al. [4] for sediment transport. As the geometry of the Seine estuary presents some convergence upstream, it is necessary to take into account the variation of the estuarine width. Based on the work of Barbry et al. [4], a width-integrated two-phase flow model based on Eqs. (1)–(3) is proposed here:
| (1) |
| (2) |
| (3) |
Here, represent the volume fraction, velocity vector and density of phase k. is the gravity acceleration and B the width of the estuary. and represent the viscous stress tensor and the Reynolds stress tensor, respectively. pk is the pressure of the phase k. The interfacial momentum transfer term arises from stresses acting on the interface. It is defined following Drew and Lahey [6] by Eq. (4):
| (4) |
| (5) |
| (6) |
The two first terms represent the interfacially averaged pressure pki and shear stress of phase k. The last term represents forces associated with drag, virtual mass, lift force and unsteady effects. The particulate Reynolds number is defined by: where d represents the particles diameter, νf, the kinematic viscosity of the fluid and stands for the relative velocity between solid and fluid phases (5). In the case of small sediment particles falling in water the particulate Reynolds number is of the order of unity [11]. Thus the drag force is dominant and only this force is considered here. τfs is the particle relaxation time defined by Eq. (6) [7] where CD is the averaged drag coefficient for a single particle in a suspension given by [18]: .
The constitutive law is modelled, Eq. (7), following Lundgren [16], by introducing an amplification factor for viscous strain, namely β, Eq. (8) [9], appearing in the effective viscosity expression: . The parameter β takes into account the non Newtonian characteristic of the flow when αs reaches high values.
| (7) |
| (8) |
From geometrical arguments, Drew and Lahey [6] proposed the following formulae for ξ:
Kinematic and dynamic conditions are imposed at the free surface whereas a no-slip condition for the fluid phase velocity and a slip condition for the solid phase velocity are imposed at the bottom. The bottom shear stress is estimated by a Strickler law. Details concerning the values of the Strickler coefficient will be given in section 3. A zero equation model is used to simulate the turbulence of the fluid phase in which the mixing length is modelled by the formulation of Escudier [8]. The fluid turbulent viscosity is added to the fluid molecular viscosity in the constitutive law (7).
The numerical solution is based on a fractional step algorithm coupled with a finite difference formulation. A σ coordinate system is implemented in order to fit the computational mesh to the free surface at each time step (see [10] for a detailed description).
3 Physical and computational settings
The computational domain extends from the extremity of the semi-submersible dykes to the dam of Poses. The bathymetry of the estuary comes from the SHOM1 (bathymetry of 1989). A 320 × 31 grid is used with a horizontal refinement near the river mouth (250–1250 m) and a vertical one near the bottom (Fig. 2). The tidal elevation is imposed at the sea boundary from SHOM prediction and the velocity is given by a simplified momentum equation for each phase. A radiation condition is set for the free surface elevation at the inland boundary and the velocity is imposed with reference to the river discharge. No solid discharge is set at the inland boundary (αs = 0). The initial condition is imposed for the sediment concentration as a one metre thickness layer of sediments with a mean concentration of 25 g/l between 20 and 60 km from the river mouth. This corresponds to 650 000 tons of mobilisable sediments. The initial repartition of sediments is quite arbitrary, but it has been chosen not too far from the physical location of the TM zone in order to reduce the initialisation simulation.
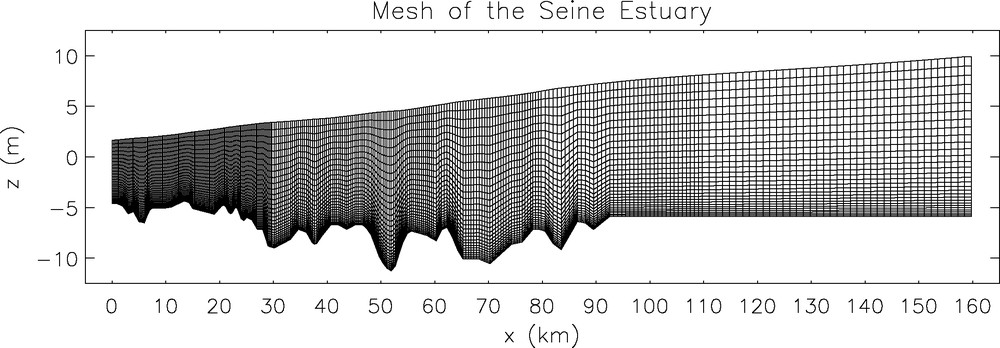
Mesh of the estuary (320 × 31).
Fig. 2. Maillage de l’estuaire (320 × 31).
The particle's diameter is chosen equal to 16 μm with a density of 1700 kg/m3. This choice is justified by observations from Lesourd et al. [15] who measured the sediment particles in the Seine estuary in the framework of the Seine Aval Project. They concluded that there are mainly two representative populations of sediment: the fine sediment particles with a mean diameter of 4 μm and a true-density of ρs = 1400 kg/m3; and the macroflocs with a mean diameter of 20μm and a true-density of ρs = 1100 kg/m3. The particle's settling velocity for the numerical simulations is greater than the observed ones. However, this choice for the particles characteristics leads to a settling velocity of the order of the one observed in the estuary (Wstokes ≈ 10−5 m/s).
The simulations have been performed over a semi-lunar cycle with a river discharge of 300 m3/s. This choice is justified to limit the exchange of sediments between the estuary and the open sea. If such exchanges arise, they are represented by a virtual reservoir. Initially, this reservoir is empty. It will be fulfilled by the sediment fluxes going out from the estuary during ebb tide. For inflow, the solid fraction at the sea boundary will be calculated by the ratio of the sediment mass in the reservoir over the total water volume outflowing during the previous ebb tide.
The Strickler coefficients decrease from the river mouth (60 m1/3/s) to the dam of Poses (20 m1/3/s). These values were obtained by a calibration step in order to fit the numerical results to the measurements of the SHOM, especially, to reproduce the tidal wave asymmetry. The comparison with the Schéma d’aptitude et d’utilisation de la mer (SAUM) [3] observations is made in the second part of the semi-lunar cycle. The initial condition for sediment is lost after seven days of simulation. We point out that only the diameter and the density of sediment particles are imposed and no critical shear stresses or erosion flux module are imposed in the following simulation.
4 Results and discussion
Water levels and mean current velocities are compared with measures of SHOM for spring and neap tide at different stations along the Seine estuary (Fig. 3). The surface water level is nearly sinusoidal at Honfleur (8 km from the river mouth) and becomes strongly asymmetric at Duclair (87 km from the river mouth). The flood lasts four hours whereas it is eight hours for the ebb tide. As a consequence, current velocity at the flood tide is stronger than the ebb's ones. These strong currents influence the suspended sediment transport by increasing the bottom erosion at flood tide leading to an upstream movement of sediment until the point where the river flow becomes dominant for the transport. This phenomenon is called “tidal pumping” [1]. In the Seine estuary, this process is preponderant for the formation and the displacement of the TM [5].
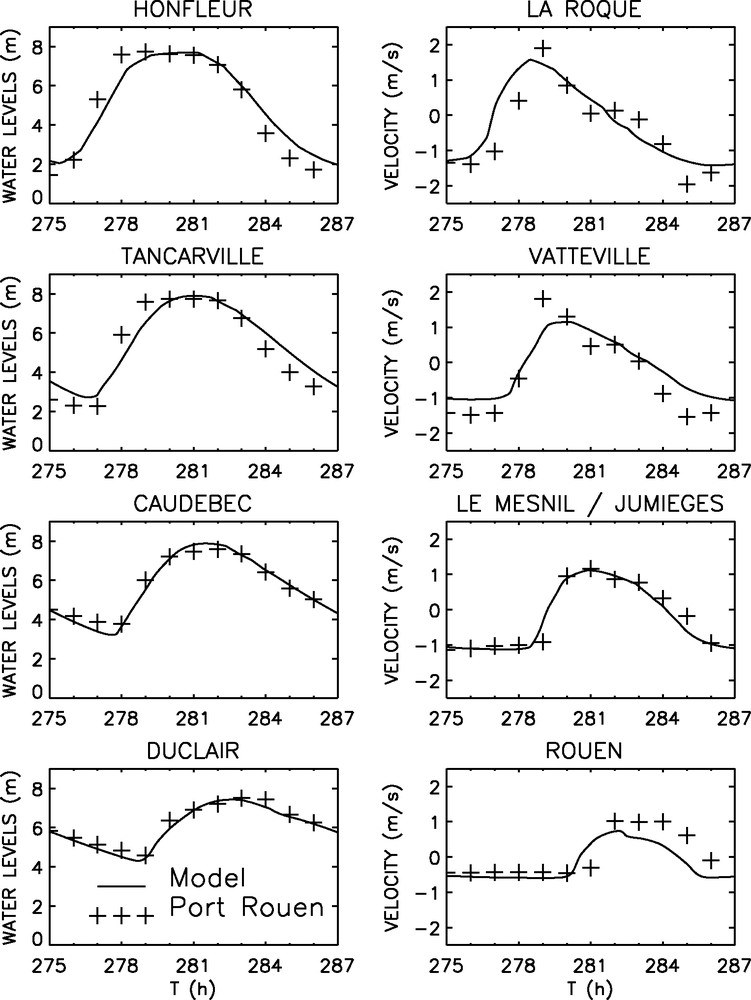
Calibration results in spring tide: two-phase flow model (−); SHOM (+).
Fig. 3. Résultats de calibration en marée de vive-eau : modèle diphasique (−) ; SHOM (+).
Afterwards, the model is run with tidal and river flow conditions closed to the one of the SAUM [3]. Fig. 4 shows the numerical results (left side) and observations of the SAUM (right side) in terms of sediment concentration. It has been observed that during neap tide and at low river discharge, the quantity of SPM is low and the concentration is about 0.2 g/l [2]. Therefore, the TM is not clearly formed. The numerical model also predicts a low quantity of SPM (less than 0.1 g/l) with a maximum near Honfleur. The TM is not developed.
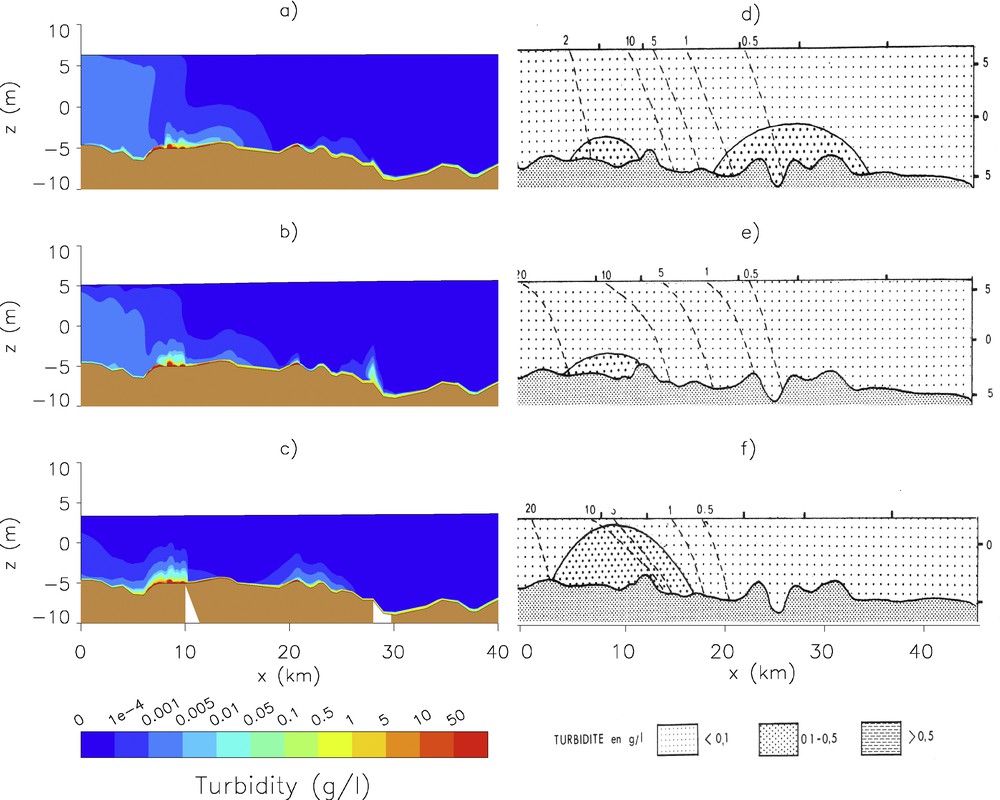
Isocontours of turbidity during neap tide. Two-phase flow model: (a) HW; (b) HW+3; (c) LW, SAUM [3]; (d) HW; (e) HW+3; (f) LW.
Fig. 4. Isocontours de concentration en marée de morte-eau. Modèle diphasique : (a) PM ; (b) PM+3 ; (c) BM, SAUM [3] ; (d) PM ; (e) PM+3 ; (f) BM.
Fig. 5 shows numerical results and observations during spring tide. The observations show a well-developped TM over the water depth at low water levels (LW) and a strong sedimentation at high water levels (HW). Concentration is greater than 1 g/l and the TM moves horizontally over a distance of about 15 km between Honfleur and Tancarville during a tidal cycle. The numerical model predicts a TM clearly formed with concentration of about 1 g/l near the bottom. Its core is located near Honfleur, less than 10 km from the river mouth, at LW and it is located at 20 km from the river mouth at HW. The numerical TM has a horizontal displacement of about one ten of kilometers during a tidal cycle. This is in quite good agreement with in-situ observations. The vertical expansion of the TM especially at LW is not well represented on the numerical results. There is no SPM in the upper part of the water column on the contrary to the observations.
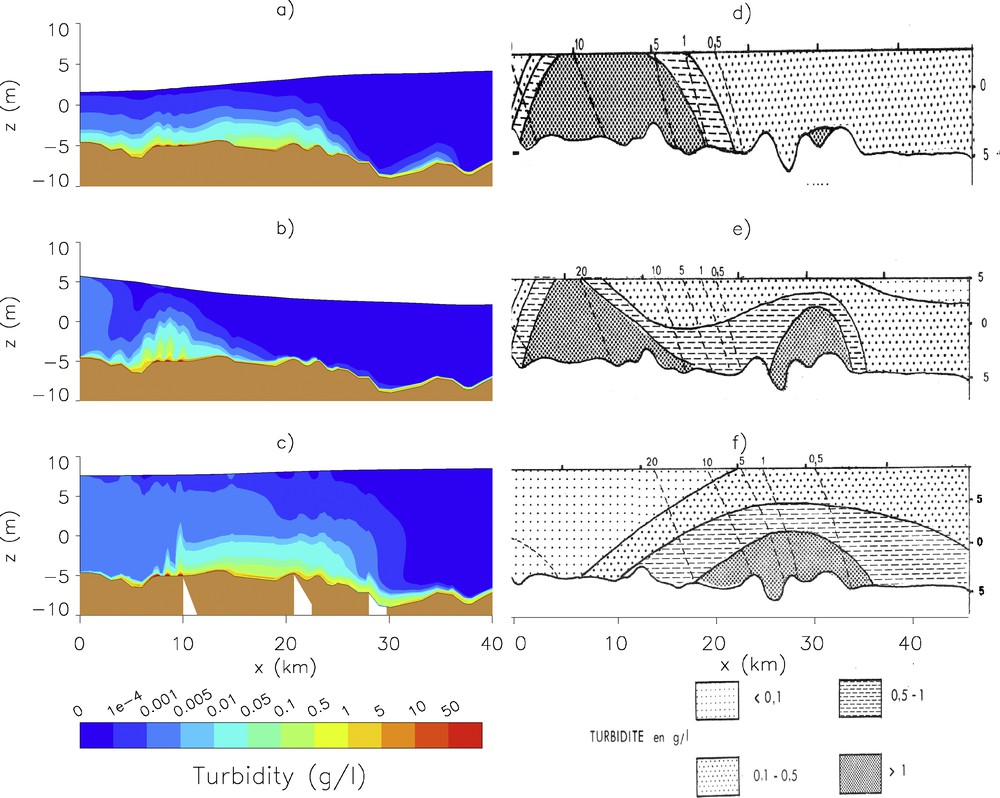
Isocontours of turbidity during spring tide. Two-phase flow model: (a) LW; (b) LW+3; (c) HW, SAUM [3]; (d) LW; (e) LW+3; (f) HW.
Fig. 5. Isocontours de concentration en marée de vive-eau. Modèle diphasique : (a) BM ; (b) BM+3 ; (c) PM, SAUM [3] ; (d) BM ; (e) BM+3 ; (f) PM.
The results presented above show that the two-phase flow model gives a coherent description of the suspended sediment transport in estuary. As stated in the introduction, the simulation of the near bed region is one of the main interest of the two-phase flow model compared to the classical approach. Fig. 6 shows sediment concentration in the near bed region during a spring tide. A relatively concentrated layer, with concentration of about one ten of gram per litre at the bottom, and a dilute suspension above this layer are observed. This concentrated layer exchanges sediment matters with the dilute suspension during the tidal cycle: it plays the role of a sediment reservoir for the SPM. This illustrates the fact that deposition and resuspension processes are potentially represented by the two-phase flow model. Moreover, this concentrated layer moves horizontally under the influence of tidal currents and river flow as shown on Fig. 6. This concentrated layer can be related to the existence of the fluid–mud layer associated with the TM . In the two-phase flow model, the fluid–mud layer is represented as a non-Newtonian fluid. This characteristic is taken into account by the introduction of the parameter β (8) in the constitutive equation (7). So the fluid–mud layer is integrated in the same domain as the suspension and the sediment bottom and it is represented by the same type of equations as the fluid. However, these results are purely qualitative for the moment and need to be further studied. In particular, a quantitative comparison with experimental measurements is necessary to validate the simulated erosion/deposition flux. Another issue raised by these results is the order of magnitude of the concentration in the “concentrated” fluid–particle layer. The concentration simulated here is of the order of one to ten grams per litre, however, the measured values for the fluid–mud in the Seine estuary is of the order of hundred grams per litre. In the actual model, the dissipation in the sediment bed and in the layer just above it, is only partially taken into account. Some other processes have not been taken into account in the present model such as the fluid–particle turbulent interactions, the flocculation, or the exchanges of sediments with the intertidal mudflats of the Seine estuary [14] or the waves action at the inlet amongst others. All these phenomena could also significantly affect the SPM dynamics in the estuary.
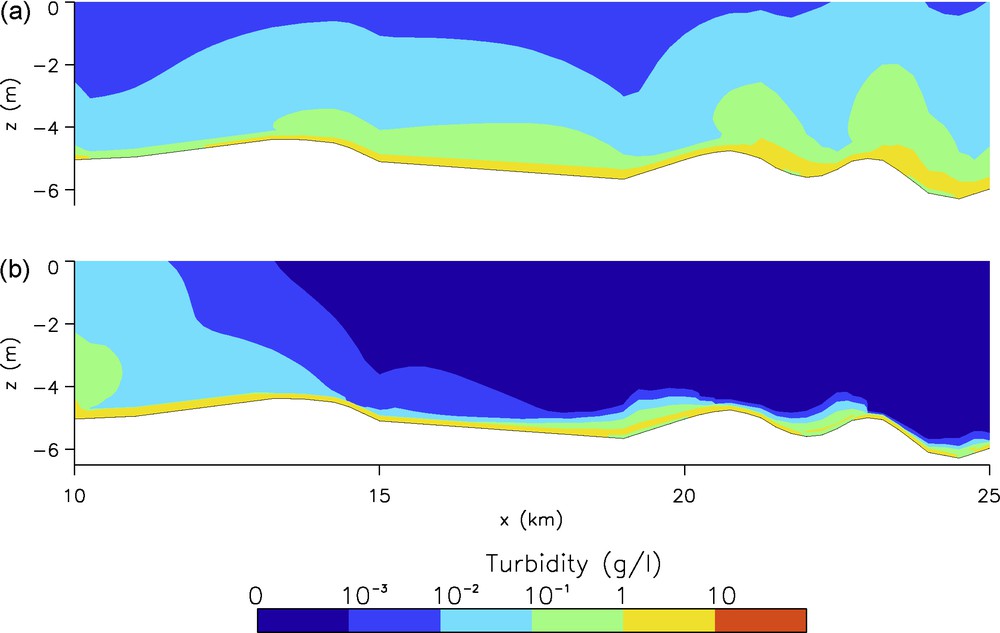
Zoom near the bottom during spring tide: (a) HW; (b) LW.
Fig. 6. Zoom près du fond en marée de vive eau : (a) PM ; (b) BM.
5 Conclusion
A two-phase flow model was adapted for the simulation of the TM in the Seine estuary. These numerical results are in rather good agreement with observations and the TM's motion is qualitatively reproduced for different tidal conditions. Moreover, a concentrated sediment layer is observed on the computational results which can be assimilated to a fluid mud layer. These results illustrate one of the major interests of a two-phase flow model for sediment transport in estuaries: the modelling of the whole water–sediment column, from the sediment bottom to the suspension.
The introduction of some other effects like the floculation or the turbulence interactions could improve the modelling. Actual developments concern the turbulence modelling and more especially the fluid–particle turbulent interactions. Concerning the long-term simulations at the scale of an estuary, one must keep in mind that such two-phase flow model is time consuming and cannot be used for such application for the moment.
Acknowledgements
This work has been financially supported by the European Commission (FLOCODS Project, FP5-Contract no ICA4-CT2001-10035). The computations have been carried out at the Centre de ressources informatiques de Haute-Normandie, Saint-Étienne du Rouvray (CRIHAN).
1 S.H.O.M.: Service hydrographique et océanographique de la marine.