

1 Introduction
The Moroccan margin formed during the initial rifting of the central Atlantic ocean in the Upper Triassic–Lower Liassic (170 à 200 Ma) [17] and is thus one of the oldest on earth. During the last three decades it was the target of several geological and geophysical industrial and scientific studies [6,13,14,21,23,24]. However, its deep crustal structure remains less well known than the conjugate continental margin off Nova Scotia [5,9]. Today the different stages of oceanic accretion have been identified due to mapping of the magnetic lineations and dating of the magnetic anomalies. However, the phases prior to rifting before seafloor spreading are still unknown [13,19].
The primary objectives of the SISMAR marine seismic survey, conducted in April 2001 on the Moroccan continental margin offshore El Jadida and Casablanca (Fig. 1), were:
- • to image the deep crustal and upper mantle structure of the margin;
- • to characterize the continent–ocean transition zone;
- • to determine the geometry of the prerift basins.
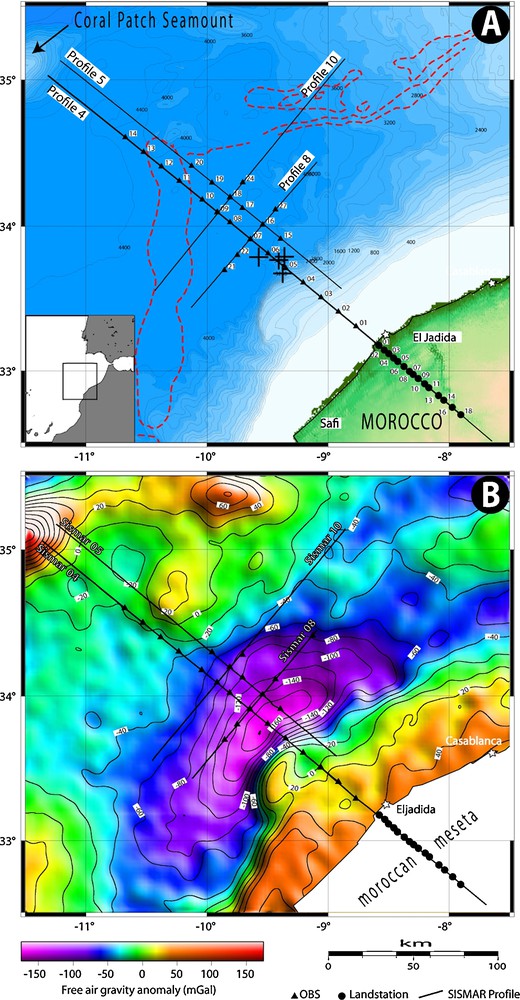
A. Bathymetry of the study area from satellite altimetry [28]. OBH positions are marked triangles. Landstations are marked by dots, the S1 magnetic anomaly by red dotted lines and DSDP drillholes by crosses. Black lines mark the wide-angle seismic profiles including landstations. B. Free air gravity anomaly of the study area.
Fig. 1. A. Bathymétrie de la zone d’étude d’après des données altimétriques [28]. Les sismomètres de fond marin sont symbolisés par des triangles. Les stations terrestres sont marquées par des cercles, l’anomalie magnétique S1 par les contours rouges en pointillés et les forages DSDP par les croix. Les traits noirs marquent les profils sismiques grand-angle incluant les stations à terre. B. Anomalie gravimétrique à l’air libre de la zone d’étude.
With these goals in mind several deep seismic profiles were acquired using a tuned air gun array with frequencies centered around 10–15 Hz to ensure deep penetration. A temporary network of 14 ocean bottom seismometers (OBH) and 12 landstations were deployed to record the shots for wide-angle seismic modelling.
First results from velocity-depth modelling of Profile 4 show that the region is characterized by an 80 km wide sedimentary basin underlain by continental crust [4]. Interpretation of the multichannel seismic data, after performing a special processing including the prestack depth migration [3], led to the proposition of the existence of a lithospheric scale fault at the ocean–continent boundary [16]. This work presents three additional wide-angle seismic profiles located in the study area, which allow us to extend the preliminary analysis and identify 3-D variability of crustal structure.
2 Geological setting
The Atlantic margin segment studied in this work represents the transition between the oceanic domain of the Atlantic and the continental domain of the western Moroccan Meseta (Fig. 1). The continental domain consists of a platform, formed during the Hercynian orogen and which has remained stable since the Middle Paleozoic. It is bounded by the Meso-Cenozoic basins of Doukkala and Essaouira which formed during the Triassic [12]. These basins developed in a basement structured by horsts and grabens defined by NNE–SSW and east–west trending normal faults [18]. The Triassic–Liassic basin is characterised by salt deposits which are well known, both on land and at sea. The seismic data from onshore and offshore El Jadida show that the salt forms diapirs which perturb stratification in the overlying sedimentary layers. The Middle and Upper Jurassic times are mainly characterised by the development of a broad carbonate platform [6,8,20]. Some authors proposed that the reactivation of older structures inherited from the Hercynian orogeny likely played an important role in the formation of this Atlantic margin [11,13,19].
The Deep Sea Drilling Project (DSDP) sites drilled in 1979 [7] provided in situ measurements and direct samples of the upper basement layers along this margin, especially drill holes 544 and 546 that reached continental basement (gneiss) and a salt diapir, respectively. Earlier work on this part of the margin and the adjacent oceanic area proposed that the continent–ocean boundary is located at a high amplitude magnetic anomaly named S1 or West African Coast Magnetic Anomaly (WACMA) (Fig. 1) [6,21,23]. It also shows that the oceanic crust along the margin coincides with the “Jurassic Magnetic Quiet Zone”, which represents a period of very weak anomalies [23]. The S1 magnetic anomaly has been proposed to represent the conjugate of the East Coast Magnetic Anomaly (ECMA) observed along the North American margin [6], and thus represents the continent–ocean transition zone [6,21,23,25,26].
3 Data processing
Marine seismic data were acquired by 14 OBH (ocean-bottom hydrophones), of which 12 were from Ifremer, one from the University of Barcelona and one from the University of Lisbon. Profile 4 was extended on land using 12 landstations (HATHOR Leas of the Institut National des Sciences de l’Univers (INSU). A total of 8624 shots were fired using an air gun array of 4850 cubic-inch tuned to the first bubble pulse to enhance deep frequencies and allow good penetration [1]. Reflection seismic data were recorded using Ifremer's 4.5 km digital streamer, which includes 360 channels. Velocities from the OBS-modelling have been used to perform deconvolution and prestack depth migration of the reflection seismic data [3]. The sample rate for all seismic data was 4 ms.
All data acquired are of good to very good quality, especially those from OBH located in the western part of the study region, where clear arrivals from sedimentary, crustal and upper mantle can be observed (Fig. 2a). Sedimentary arrivals are generally characterised by strong arrivals with apparent velocities between 2 and 4 km/s, crustal arrivals identified as first arrivals at distances greater than ≈ 20 km show velocities around 6 km/s (the reduction velocity used on Fig. 2) and the reflected arrival from the Moho (PmP) can be identified as a strong secondary arrival in most record sections. The data quality is lower for OBH situated in zones of salt tectonics, because the salt layer represents a high velocity layer and an acoustic screen for underlying sedimentary layers (Fig. 2b and c). The landstations show excellent data quality with clear arrivals up to 200 km shot–receiver distance.
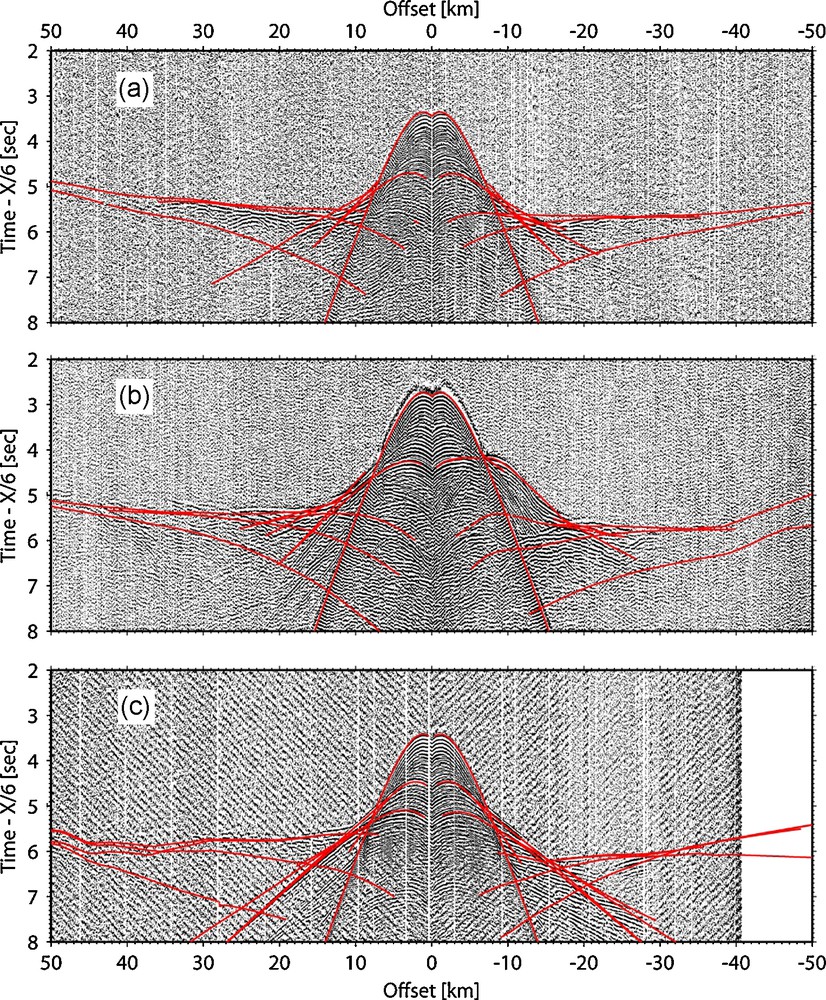
Data sections of different OBS, band-pass filtered and reduced with a velocity of 6 km/s. Red lines represent predicted arrival times from forward modeling. a: recording of OBH 13 on Profile 4; b: recording of OBH 09 on Profile 10; c: recording of OBH 21 on Profile 8.
Fig. 2. Sections de données de différents OBS ayant subi un filtre passe-bande et une réduction avec une vitesse de 6 km/s. Les traits rouges marquent l’arrivée prédite par la modélisation grand-angle. a : données de l’OBH 13 sur le profil 4 ; b : données de l’OBH 09 sur le profil 10 ; c : données de l’OBH 21 du profil 8.
Preprocessing of the OBH data included calculation of the clock-drift corrections (between 0–4 ms per day) to adjust the clock in each instrument to the GPS base time. Instrument locations were corrected for drift from the deployment position during their descent to the seafloor, using water arrivals. Picking of first and later arrivals was performed without filtering where possible (mostly between offsets of 0–40 km). Different filters were applied to the data where necessary, depending on the quality and offset to the source, as frequencies of arrivals from longer offsets is lower compared to those from short offsets.
The data were modelled using the combined forward and inverse modelling software package RAYINVR [29]. The layer stripping approach was used and layers were modelled from the top of the model downwards. Upper layers were locally adjusted to improve the fit of lower layers, only in regions not constrained by arrivals from this layer. Arrival times of the main sedimentary layers and basement were picked from the reflection seismic data. These were converted to depth using the OBH data and seismic velocities from velocity analysis of the reflection seismic data. The depth and velocities of the crustal layers and the upper mantle were modelled from the OBH data by comparison of the picked arrival times with the arrival times predicted by the forward model. Ray-paths and comparison of the arrival times indicate which regions of the model are well-constrained (Figs. 3 and 4).
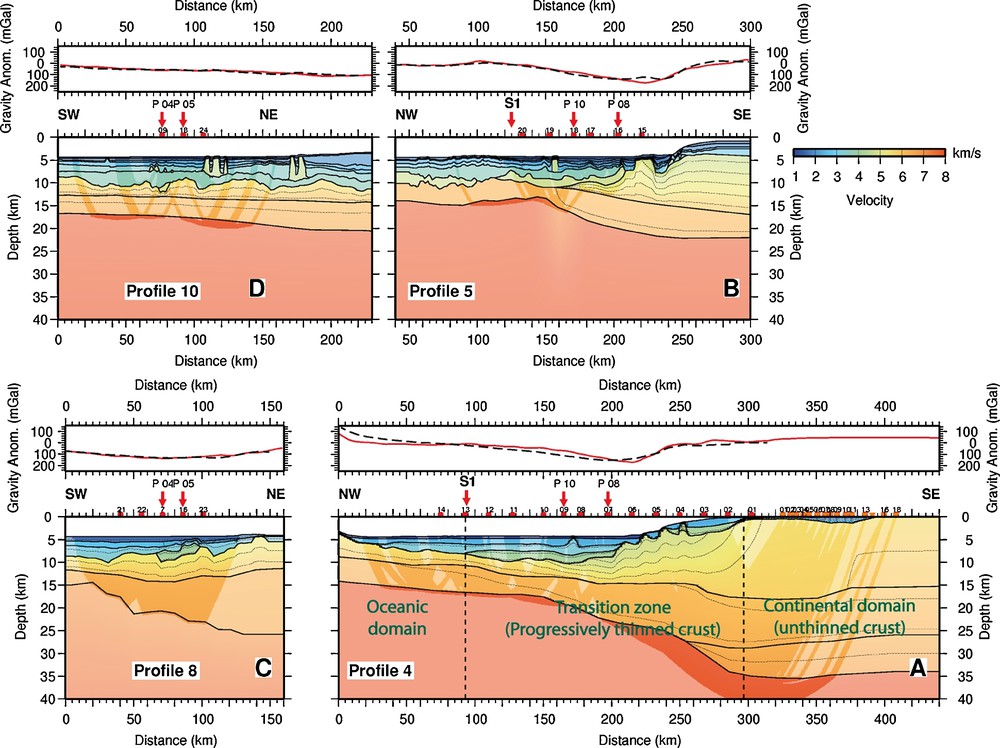
Results of the wide-angle seismic and gravity modeling. Boundaries of the velocity models are indicated and isovelocity contours every 0.25 km/s. Regions unconstrained by the ray-tracing are shaded. OBH positions are marked by red circles and landstation positions by orange inverted triangles. A. Lower panel: final velocity model of Profile 4. Upper panel: measured gravity anomaly (red line) and anomaly predicted from the velocity model (black line). B as A for Profile 5, C as A for Profile 8, D as A for Profile 10.
Fig. 3. Résultats des modélisations sismique grand-angle et gravimétrique. Les limites des couches et les contours de vitesse à 0,25 km/s d’intervalle sont présentés sur les modèles. Les zones non contraintes par les rayons sont ombrées. Les positions des OBH et des stations terrestres sont respectivement indiquées par des cercles rouges et des triangles inversés oranges. A. Panneau du bas : modèle final de vitesse du profil 4 ; panneau du haut : anomalie gravimétrique mesurée (trait rouge) et anomalie prédite par le modèle de vitesse (trait noir). B idem que A pour le profil 5, C idem que A pour le profil 8, C idem que A pour le profil 10.
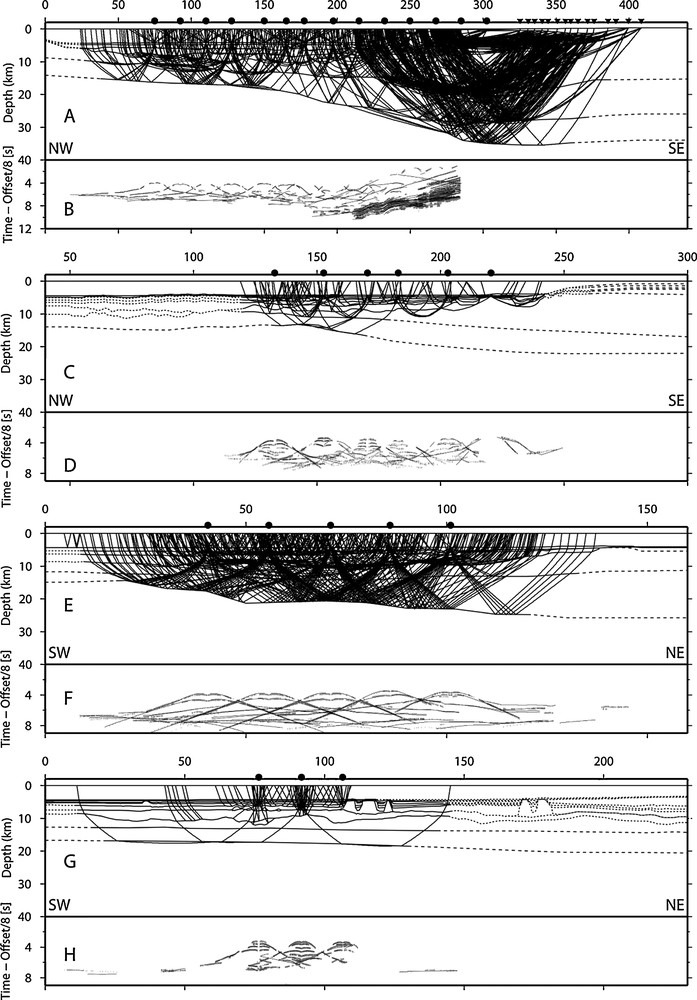
Ray coverage using 20th ray in the wide-angle seismic models and comparison of travel-time picks and predicted arrivals. Black lines represent layer boundaries constrained by wide-angle seismic modeling, dashed lines layer boundaries constrained by gravity modeling and pointed lines boundaries constrained by reflection seismic data, with extrapolation of the seismic velocities from wide-angle seismic data. A. Ray coverage of Profile 4. B. Picked travel-times (dots) and predicted arrival times (black lines). C and D as A and B for Profile 5. E and F as A and B for Profile 8. G and H as A and B for Profile 10.
Fig. 4. Couverture des modèles par des trajets des rayons (chaque 20e rayon est représenté) et comparaison entre le temps d’arrivée prédit par le modèle et les pointées. Les traits noirs marquent des couches de modèle contraintes par la modélisation des données grand-angle, les traits en pointillés ceux contraints par la modélisation gravimétrique et les traits en points ceux contraints par la sismique réflexion avec les vitesses extrapolées de la modélisation grand-angle. A. Couverture des rayons du profil 4. B. Comparaison entre le temps d’arrivée prédit par le modèle (traits noirs) et les pointées de profil 4 (points). C et D comme A et B pour le profil 5, E et F comme A et B pour le profil 8, G et H comme A et B pour le profil 10.
4 Gravity modelling
Since seismic velocities and densities for oceanic crust are well-correlated, gravity modelling can improve the seismic model by comparing the gravity signature of the lateral deep interfaces to the observed anomalies. Areas unconstrained by the seismic data are modelled by comparing calculated gravity anomalies with those observed. Average P-wave velocities for each layer of the seismic models were converted to densities using published empirical relationships [2,15]. Upper mantle densities were set to a constant 3.32 g/cm3. The calculated gravity anomalies are then compared to free-air gravity anomalies from satellite measurements [27] (Fig. 1B). To avoid edge effects all models were extended by 100 km at both ends and down to a depth of 95 km.
The predicted anomalies generally fit the observed data well, with the exception of some short wavelength variations (Fig. 3). Parts of the model, constrained by gravity modelling only, are represented as dashed lines on Fig. 4. For Profile 4 the greatest calculated negative anomaly corresponds to the maximum variation of the seafloor depth at the base of the continental slope and is slightly shifted with respect to the observed anomaly. This could be explained by 3-D effects of the basement topography in this region. A difference between modelled and calculated anomalies can also be observed at the western end of this profile. This difference is probably due to Coral Patch, a seamount rising 4–5 km high above the adjacent seafloor.
5 Results and discussion
The wide-angle seismic models of the four Sismar profiles image the sedimentary and crustal structures of the continental margin off northwestern Morocco and allow us to constrain the variability of the different layers perpendicular and parallel to the margin. The previously published model of Profile 4 [4] combined with the wide-angle seismic models of these three additional profiles reveal a high variability of crustal thickness in the study area. A variation of thinned continental crustal thickness of about 1 km is observed between Profiles 4 and 5. This variability is probably related to the original breakup and the origin of the basin from highly thinned continental crust. The margin parallel Profile 8 on which Moho depth varies between 25 and 15 km confirms this hypothesis.
The models allow us to image three distinct domains (Fig. 3A):
- • a domain of unthinned continental crust, located in the Southeast of the survey zone. It constitutes the northwest prolongation of the Moroccan Meseta, which represents a segment of continental crust structured by the Hercynian orogeny and extends seaward up to the continental platform border or hinge line, where the basement deepens and Moho depth correspondingly decreases;
- • a domain of crust with velocities and relative layer thickness characteristic for normal oceanic crust and located west of the S1 magnetic anomaly (at OBS 13 location on Profile 4 and OBS 20 on Profile 5). The basement has a roughness typical for normal oceanic crust [4];
- • a transitional zone, which separates the two previous domains, and has a width of more than 150 km. It is characterised by a crustal thinning from 35 to 8 km. It is separated into two layers of roughly similar thickness and seismic velocities typical for thinned continental crust. It is therefore interpreted to consist of highly thinned continental crust forming a 150 km wide and up to 5 km deep basin.
In the first domain, the thickness of the unthinned continental crust is about 35 km, constrained by the landstation data on Profile 4 (Fig. 4). The crust is composed of three distinct layers, of which the lowermost layer disappears at the transition zone as suggested by the disappearance of the associated reflection in the wide-angle seismic data. Four fault blocks 10 to 15 km wide are imaged by the reflection and wide-angle seismic data on the profile perpendicular to the margin (Figs. 3 and 5). Seismic velocities in the upper basement are only 5.6 km/s and can be explained by velocity reduction through fracturing, fluid flow and ensuing alteration of the rocks. The lowermost crustal layer disappears at the continental slope. They are locally associated with salt diapirs along the continental slope and imaged by reflection and wide-angle seismic data. The slope has been drilled during the Leg 79 of the DSDP program [7]. Results of this drilling campaign were used for the identification of the seismic units in the wide-angle data. These results show that the 545 site, located at the foot of the Mazagan escarpment westward of El Jadida (701 m of water depth), crossed a Middle to Upper Jurassic limestone series. Furthermore, the 544 site, situated on a high structure of the bottom of the margin (3607 m water depth), reached the basement topped by a Middle to Upper Jurassic limestone. Finally, the 546 drillhole, implanted at 3968 m water depth, penetrated a salt diapir [10].

Migrated multichannel seismic sections. OBS positions are indicated by red circles and layer boundaries from wide-angle data modeling by black lines. A. Profile 5. B. Profile 8.
Fig. 5. Sections migrées de sismique multitrace. Les positions de OBS sont marquées par des cercles rouges et les limites de couches des modèles de sismique grand-angle sont marquées d’un trait noir. A. Profil 5. B. Profil 8.
In the second domain, westward of the S1 magnetic anomaly, seismic velocities and relative layer thickness are characteristic for normal oceanic crust. A slight thickening of the crustal layers can be observed on Profile 4 in the vicinity of Coral Patch Seamount, which represents a compressional feature. This thickening is not found on Profile 5 which is located north of the seamount. This compressional phase could be the reason for the high variability of the crust in this domain.
In the third domain, the Moho depth decreases along Profile 4 from 35 km below the unthinned continental crust to 15 km at the northwestern end of the profile in the oceanic domain. Profiles 10 and 8 are located parallel to the margin in the salt basin of domain 2. Profile 5 is located parallel to Profile 4, but was not prolonged by landstations and also recorded by fewer ocean-bottom instruments (Fig. 1). Thus, it images domains 2 and 3 only. The continental crust thins at the continental slope to about 8 km thickness beneath the roughly 5–6 km thick sedimentary basin (Fig. 3A and B). This thinning occurs over a distance of about 150 km in the model. Seismic data show a good coincidence between the hinge line and the steepest Moho dip. Crustal thickness below the basin is less on Profile 5 than on Profile 4, which indicates a high degree of variability in crustal thickness along the studied segment of margin. Profile 8 is located parallel to the margin and images a crust with a thickness ranging from 7 to 20 km. These variations are better explained by the position of the profile, with respect to the S1 magnetic anomaly. The southwestern extremity of the profile is closer to the anomaly and therefore closer to true oceanic crust than the northeastern end of the profile. The associated sedimentary cover also thickens toward the southwest. Finally, Profile 10 is located offshore, parallel to the Profile 8. It images crust of 7–8 km thickness. Crustal thickness increases slightly towards the northeast. Detailed analysis of wide-angle seismic and reflection seismic data did not allow identification of extrusive volcanic structures, such as seaward-dipping reflectors, as described for the southern Moroccan margin located offshore Dakhla [10]. Together with the fact that no lower crustal body characterized by unusually high velocities for continental crust (which might correspond to magmatic underplating) has been found from wide-angle seismic modeling in the study region, we conclude that the nature of this segment of the margin is nonvolcanic. Upper mantle velocities are 8.00–8.20 km/s along all profiles and were constrained by ray-tracing (Figs. 3 and 4). This leads us to conclude that the mantle underlying this basin is not serpentinised as previously proposed for other basins consisting of highly thinned continental crust (Fig. 4) [22].
The thickness of the sedimentary layers varies considerably across the margin (Figs. 3 and 5), with an increase from 1.5 km in the northeast to a maximum of 6 km in the sedimentary basin at the base of the continental slope. In the sedimentary basin eastward of the S1 magnetic anomaly numerous salt diapirs can be identified (Figs. 3 and 5). The sedimentary layers, often disturbed by salt tectonics, are well imaged in the reflection and wide-angle seismic sections. The basement reflector is clearly visible throughout the sections, except directly underneath the salt diapirs which prevent penetration of the acoustic energy down to deeper crustal layers. In the seismic modeling, one layer containing salt was included using a velocity of 4.40–4.80 km/s. Furthermore, the fact that the model does not require a layer of relatively low density indicates that the salt does not form a massive layer and the percentage of salt in the diapirs is low. Some salt structures are also modeled as diapirs on the continental slope.
6 Conclusions
The main conclusions from modeling of four wide-angle seismic data from the continental margin off NW Morocco are: firstly, crustal thickness decreases from 35 to 8 km across a 150 km wide zone with the zone of maximum thinning located at the continental slope characterized by fault blocks and salt structures; secondly, the transition from thinned continental crust to normal oceanic crust is inferred from oceanic basement roughness, crustal thickness and relative layer thickness to occur at the position of the S1 magnetic anomaly, indicating that the sedimentary basin is underlain by thinned continental crust; thirdly, no lower crustal body associated to underplating and volcanic products have been observed in the region; the NW Moroccan margin is therefore nonvolcanic. Upper mantle velocities are 8.00–8.20 km/s, excluding a high degree of mantle serpentinisation underneath the thin continental crust of the basin; eventually, the thickness of the sedimentary cover reaches 6 km at the base of the continental slope.
Acknowledgements
We would like to thank the captain and the crew of the N/O Le Nadir and the N/O Almeida Carvalho as well as the OBS teams of Ifremer and the University of Lisbon. Many thanks also to all people involved in the landstation and OBS deployment. The stay of M. Jaffal at the University of Brest was funded by the “Action intégrée MA/03/75F” between Morocco and France. We thank two anonymous reviewers for very constructive and helpful comments.