

1 Introduction
The solid inner core is one of the most puzzling parts of our planet. Its structure is principally constrained by the propagation of the compressional waves PKPdf (also called PKIKP), which have revealed that the inner core is anisotropic both in seismic velocities [20] and attenuation [28]. Propagation is faster and attenuation is stronger for waves propagating parallel to the Earth's rotation axis (hereafter denoted “polar paths”), than for waves parallel to the equatorial plane (hereafter denoted “equatorial paths”) [8,11,17,22,34]. P-velocity is 1 to 3% faster for polar paths than for equatorial paths, a result confirmed by the analysis of the free oscillations of the Earth (see review, [25]). This observation is generally ascribed to a preferred orientation of anisotropic crystals of iron in hexagonal compact form or other forms stable at core conditions. The anisotropy is not uniform: the uppermost 100 km are nearly isotropic at worldwide scale [29], and a different form of anisotropy is present in the central part [3,15]. Moreover, a hemispherical pattern has been detected [12,32], the western hemisphere being more anisotropic than the eastern one, a pattern possibly induced by liquid core dynamics [1,30]. In parallel to velocity anisotropy, an anisotropy in attenuation has been observed, high attenuation being related to fast propagation [8,11,17,22,34]. This correlation is opposite to that in the mantle, where viscous attenuation due to thermal heterogeneities is dominant [23]. Viscous attenuation, which implies conversion of seismic energy into heat, is likely to be present in the inner core [10,17], in particular if partially molten material is present [19,24]. However, wave scattering by the inner core texture seems a preferred mechanism to explain the observed velocity-attenuation correlation [10,11]. The identification of scatterers in the uppermost inner core [33] gives additional credit to this hypothesis, but elements are missing to characterize their relative contribution to attenuation.
It is of major interest to specify the structure of the uppermost inner core, in order to understand its growth mechanism through crystallization of the liquid outer core. As attenuation is more sensitive than velocity to the structure properties, attention has been primarily focussed on wave amplitudes.
2 Data
Events of magnitude M ≥ 6.0 sampling a small region of the inner core beneath Africa have been selected in the period 1986–2008, providing PKPdf rays with many different orientations at their turning points (Fig. 1). The data are vertical broadband records. The distance range is limited to 149–152°, which gives turning points 200 to 300 km beneath the inner core boundary (ICB). In the selected distance range, it is possible to compare PKPdf with another core phase, PKPbc, which turns in the liquid core and has a nearby path (Fig. 2a). Most of the source effects and propagation perturbations through the mantle are thus eliminated in the PKPdf/PKPbc amplitude ratio (hereafter noted DF/BC). The only remaining contribution is the propagation of PKPdf through the inner core, as the liquid core is laterally homogeneous and has a very low attenuation [9].
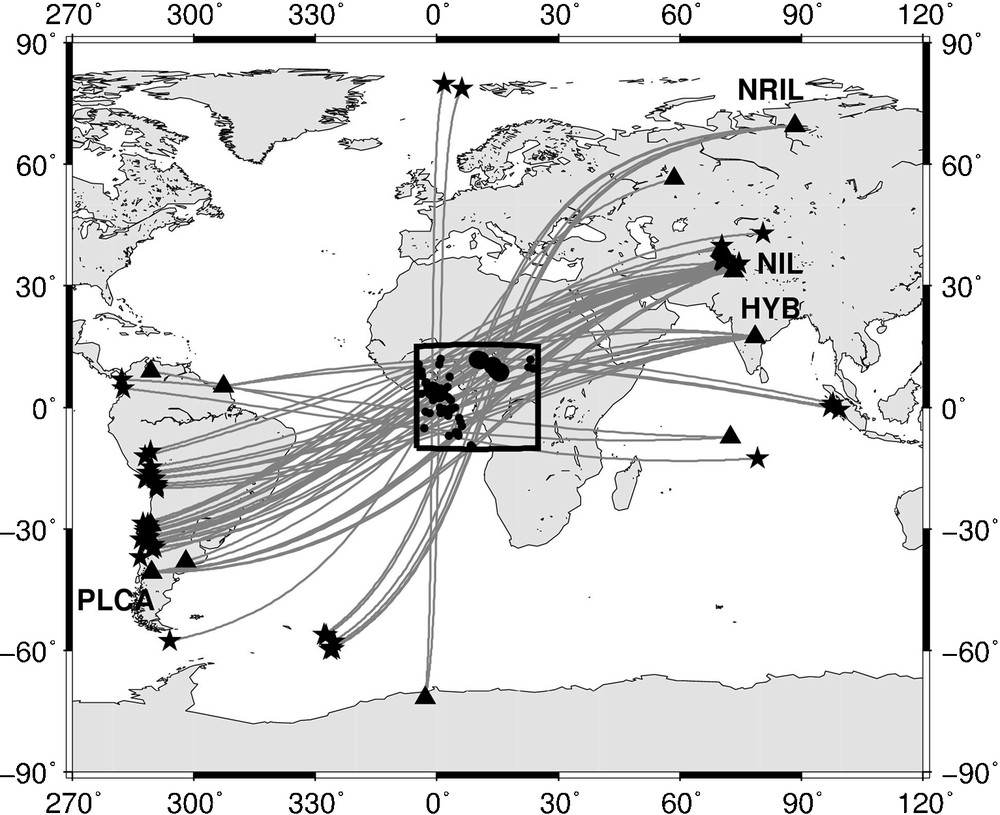
Selected paths with various orientations with respect of Earth rotation axis, and turning points beneath Africa (box). Stations with codes are those used in Fig. 3 and 4.
Fig. 1. Trajets étudiés, avec le point le plus bas sous l’Afrique (cadre) et différentes orientations par rapport à l’axe de rotation de la terre. Les stations avec des codes sont celles utilisées dans les Fig. 3 et 4.
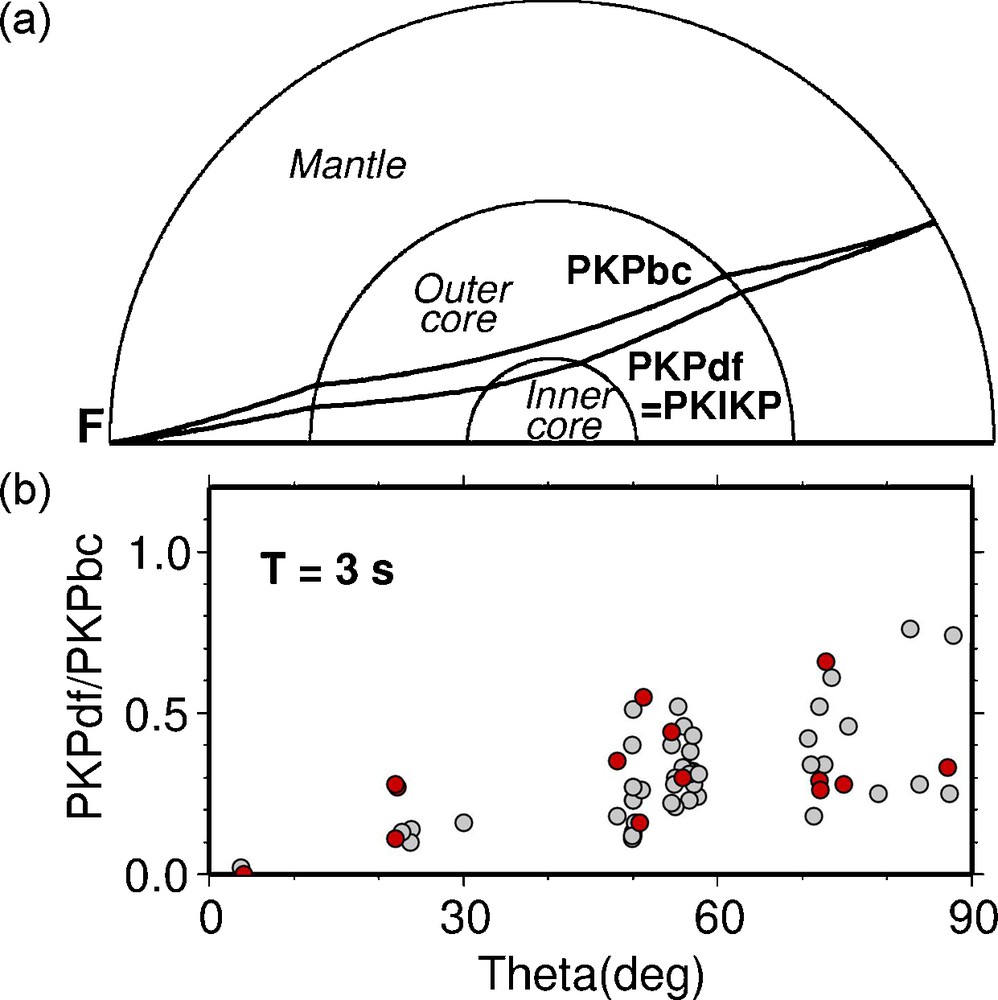
a: ray paths of PKPdf and PKPbc inside the Earth at distance 150°; PKPbc is the reference phase; b: amplitude ratio PKPdf/PKPbc as a function of θ, the angle of the PKPdf ray with respect to Earth rotation axis, at period 3 s. The amplitude ratios have been corrected for distance Δ and focal depth (red dots [darker dots] for Δ >151° to check a possible influence of PKPbc diffraction at ICB). Note the anisotropy in PKPdf amplitude, with a strong attenuation for paths parallel to Earth rotation axis. Masquer
a: ray paths of PKPdf and PKPbc inside the Earth at distance 150°; PKPbc is the reference phase; b: amplitude ratio PKPdf/PKPbc as a function of θ, the angle of the PKPdf ray with respect to Earth rotation axis, ... Lire la suite
Fig. 2. a : trajets des rais PKPdf et PKPbc dans la Terre, à la distance de 150°; PKPbc sert de référence ; b : rapport des amplitudes PKPdf/PKPbc à la période de trois secondes, en fonction de l’angle θ entre le rai et l’axe de rotation de la Terre. Les valeurs sont corrigées de l’influence de la distance Δ et de la profondeur du foyer (points rouges [plus foncés] pour les rais susceptibles d’être perturbés par la diffraction, Δ > 151°). On observe l’anisotropie d’atténuation de PKPdf, avec une forte atténuation pour les trajets parallèles à l’axe de rotation de la Terre. Masquer
Fig. 2. a : trajets des rais PKPdf et PKPbc dans la Terre, à la distance de 150°; PKPbc sert de référence ; b : rapport des amplitudes PKPdf/PKPbc à la période de trois secondes, en fonction de l’angle θ entre le rai ... Lire la suite
Each PKPdf ray is characterized by its ray parameter, which is directly related to its turning depth, and which is fully determined from the epicentral distance Δ, focal depth h and Earth's model. The PKPdf ray parameters of the selected data range from p = 1.50 s/deg (for Δ = 152° and h = 0) to p = 1.61 s/deg (for Δ = 149° and h = 0). The reference velocity model is ak135 [16], which is presently the best core model for compressional body waves. In particular, it exhibits a low velocity gradient at the base of the liquid core which correctly reproduces the propagation times and amplitudes of PKPbc. As this model does not provide attenuation parameters, the quality factor Q of model PREM [14] is used. It is mostly constrained from eigenmodes. The Q-model in the mantle has only a marginal influence, as the DF/BC ratio will be considered.
Before investigating any frequency dependence, it has first to be checked that an anisotropy in attenuation is effectively observed, as in previous studies [8,11,17,22,34]. The experimental ratios DF/BC are determined at period 3 s. A ray-parameter correction equivalent to a distance-focal depth correction is determined using synthetic seismograms computed using the reflectivity method [21] for the reference model. It is applied to the experimental ratios, to refer all the data to the value p = 1.6 s/deg. Despite a strong data scattering likely due to lower mantle heterogeneities, the corrected DF/BC ratios (Fig. 2b) clearly show a decrease for small ray angle θ with respect to the Earth's rotation axis, with values close to zero for two quasi-polar paths. Note that no perturbing effect of the diffraction of PKPbc at ICB may be observed for the large distances (red dots on Fig. 2b). The DF/BC variations of more than one order of magnitude thus confirm the existence of an anisotropy in attenuation.
3 The frequency dependence of wave amplitudes: method and observations
Important information may be given by the variations of DF/BC with frequency f. If the quality factor Q is not frequency dependent, Ln(DF/BC) decreases linearly with increasing frequency [6,27] with slope −π*tic/Q, tic being the time spent by PKPdf inside the inner core. This may occur if attenuation is characterized by a broad absorption band with constant Q resulting from the superposition of multiple viscous mechanisms [18], as postulated in PREM [14]. On the other hand, scattering attenuation occurs when the waves meet heterogeneities of scale length close to their wavelength, so that some energy is deflected outside the source-station direction. In this case, attenuation becomes generally frequency dependent with a dependence which reflects the heterogeneity spectrum. Attenuation may become maximum at a particular frequency, if heterogeneities have a prevailing wavelength [7,11]. Ln(DF/BC) is generally no longer a linear function of f and may exhibit a strong frequency dependence [11].
The variations of Ln(DF/BC) with frequency are examined in the frequency range 0.2–2.0 Hz for the data of Fig. 1. Note that the highest frequencies have rarely been explored for core studies, but that Q in the reference model is defined at low frequencies (about two orders lower than those considered here). The investigated frequency domain is restricted at the low-frequency side by the time delay between PKPdf and PKPbc (Fig. 3a, b). Moreover, large magnitude events with long time duration must be eliminated, because PKPdf may overlap PKPbc and biases the PKPdf/PKPbc amplitude ratio (it turns out that no such event was present in our initial selection, for paths turning beneath Africa). At high frequency, the spectral domain is limited by the noise level. Records are band-pass filtered at 20 different frequency values f0 (frequency bands from 0.6*f0 to 1.4*f0), with causal Butterworth filters to avoid perturbation of the low amplitude PKPdf signal by the large amplitude PKPbc wave. Measurements of DF/BC have been made automatically on the filtered data. Two methods have been checked: 1- compute the cross-correlation of the signal selected inside the PKPdf and PKPbc windows, 2- compute the ratios of the peak-to-peak maximum amplitudes. In each case, the windows are defined by taking into account the time shift due to filtering, and for PKPdf the influence of velocity anisotropy. The two methods give globally similar results, the second one gives generally more stable results and has been adopted.
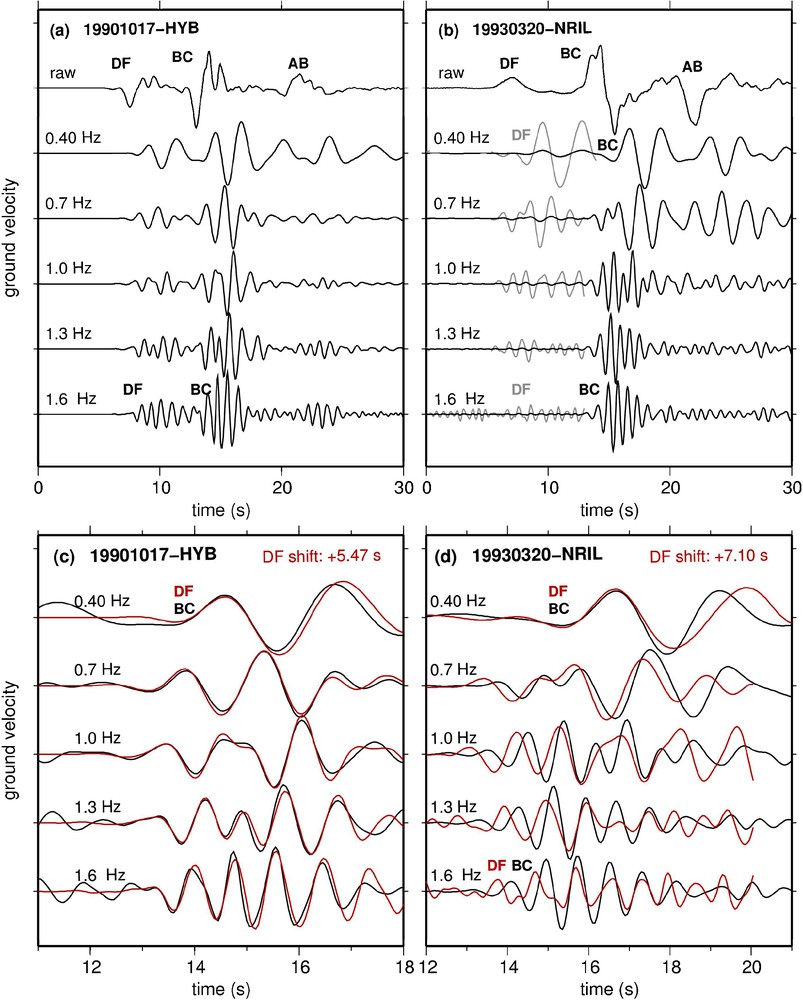
Vertical components of two events with turning points beneath Africa, with raw data and data bandpass filtered at different frequencies. a: quasi-equatorial path (October 17, 1990 recorded at HYB, distance 149.6°, depth 599 km, angle to Earth rotation axis ∼73°); b: quasi-polar path (March 20, 1993 recorded at NRIL, distance 149.6°, depth 116 km, angle to Earth rotation axis ∼23°). The three core phases are well observed: DF = PKPdf, which samples the inner core, BC = PKPbc and AB = PKPab which turn at the base and in the middle of the liquid core, respectively. Traces are scaled to the PKPbc amplitude. The time shift on the filtered traces is due to the causal filtering. In (b), grey traces correspond to the signal enhanced by a factor of 10. Note the mild decrease of the PKPdf amplitude with increasing frequency for the equatorial path, and its very strong decrease for the polar path; c, d: close-up on the PKPbc phase for filtered traces (in black), and PKPdf scaled to the PKPbc amplitude (in red [lighter line]) and shifted in time of a constant value to be superimposed to PKPbc at 0.4 Hz. A dispersion is clearly observed for the quasi-polar path. Masquer
Vertical components of two events with turning points beneath Africa, with raw data and data bandpass filtered at different frequencies. a: quasi-equatorial path (October 17, 1990 recorded at HYB, distance 149.6°, depth 599 km, angle to Earth rotation axis ∼73°); b: ... Lire la suite
Fig. 3. Composantes verticales de deux enregistrements ayant leur point le plus bas sous l’Afrique, avec les données brutes (en haut) et filtrées à différentes fréquences. a : trajet quasi-équatorial (séisme du 17 octobre 1990 enregistré à HYB, distance 149,6°, profondeur de foyer 599 km, angle du rai ∼73° par rapport à l’axe de rotation de la Terre) ; b : trajet quasi-polaire (séisme du 20 mars 1993 enregistré à NRIL, distance 149,6°, profondeur du foyer 116 km, angle du rai ∼23° par rapport à l’axe de rotation de la Terre). On observe les trois phases du noyau : DF = PKPdf qui échantillonne la graine, BC = PKPbc et AB = PKPab qui échantillonnent respectivement la base et le milieu du noyau liquide. PKPbc sert de référence. Le décalage temporel des différentes traces est dû au filtre causal, les traces grises (en b) sont multipliées par un facteur 10. On note la décroissance lente de l’amplitude de PKPdf avec la fréquence pour les trajets équatoriaux et sa décroissance très rapide pour les trajets polaires ; c, d : zoom sur les traces filtrées, PKPbc (en noir) et PKPdf (en rouge [traces plus claires]) ramené à la même amplitude et décalé en temps d’une valeur constante pour que les traces soient superposées à 0,4 Hz. Une dispersion est clairement observée pour le trajet quasi polaire. Masquer
Fig. 3. Composantes verticales de deux enregistrements ayant leur point le plus bas sous l’Afrique, avec les données brutes (en haut) et filtrées à différentes fréquences. a : trajet quasi-équatorial (séisme du 17 octobre 1990 enregistré à HYB, distance 149,6°, profondeur ... Lire la suite
Fig. 3a, b shows two examples of filtered records, for a nearly equatorial path and a nearly polar path. They confirm the anisotropy in attenuation, but they also reveal a drastic difference in amplitude decay with frequency between the two paths. Fig. 3c, d focus on the time delay between PKPdf and PKPbc. The elastic anisotropy is well observed: The time delay between PKPdf and PKPbc is 5.47 s for the quasi-equatorial path, 7.10 s for the quasi-polar path at 0.4 Hz, which results in a difference of 2.1 s after correction of epicentral distances and focal depths. This corresponds to an anisotropy of about 2%. A strong dispersion is also observed for polar paths, the PKPdf propagation being about 0.36 s faster at 1.6 Hz than at 0.4 Hz. Such a dispersion is not observed for the equatorial path. It is quite unusual to observe such a large dispersion for body waves. The dispersion is linked to attenuation, PREM isotropic model with Q ∼ 440 predicts a time shift of only 0.13 s. Theoretical models show that dispersion curves may give strong constraints on the attenuation mechanisms [11,17,18]. Unfortunately, absolute measurements of dispersion are not possible here, so that dispersion will not be further considered.
4 Amplitude spectra for various ray orientations
Fig. 4 gives the amplitude ratios as a function of frequency for four, well sampled paths, which correspond to different θ-values. Also reported are the values obtained from synthetic seismograms at 0.2 Hz for the reference model (Q = 440 in the uppermost inner core) for two ray parameters (p = 1.5 and 1.6 s/deg), and the linear variations expected if Q is independent of frequency. For the quasi-equatorial paths from South America to HYB, India (θ ∼ 73°, Fig. 4a), the variation of Ln(DF/BC) with f is nearly linear, supporting a model of viscous attenuation with constant Q. The results agree with the predictions of the mean Earth model (Q = 440) at the low frequency side, but the slope gives a higher Q-value (Q ∼ 800–1200), an inconsistency which suggests that different mechanisms may contribute to attenuation, depending on frequency.

Amplitude ratio DF/BC as a function of frequency for selected paths turning beneath Africa, with decreasing values of the angle θ of the ray with respect to Earth rotation axis. a: quasi-equatorial paths; b, c: intermediate θ-values; d: quasi-polar paths; e: results for another polar path with turning point beneath Western Pacific. In each figure, each thin curve corresponds to a record, and the thick black curve corresponds to the mean. The two black dots correspond to the theoretical values for the mean reference model (see text) for two values of the ray parameter (1.5 and 1.6), and the two dashed lines are the expected values if Q is not frequency dependent. Note the drastic influence of the θ-value, the departure from linearity and the strong amplitude decay at high frequency for polar paths. Masquer
Amplitude ratio DF/BC as a function of frequency for selected paths turning beneath Africa, with decreasing values of the angle θ of the ray with respect to Earth rotation axis. a: quasi-equatorial paths; b, c: intermediate θ-values; ... Lire la suite
Fig. 4. Rapport d’amplitude DF/BC en fonction de la fréquence pour différents trajets ayant leur point le plus bas sous l’Afrique, et pour des valeurs décroissantes de l’angle θ entre le rai et l’axe de rotation de la Terre. a : trajets quasi équatoriaux ; b, c : valeurs intermédiaires de θ ; d : trajets quasi polaires ; e : résultats pour un autre trajet polaire avec un point le plus bas sous le Pacifique ouest. Pour chaque figure, chaque courbe fine correspond à un enregistrement ; la courbe noire épaisse correspond à la moyenne. Les deux points noirs correspondent aux valeurs théoriques du modèle moyen de référence (voir texte) pour deux valeurs de paramètre de rai (1,5 et 1,6). Les deux droites pointillées sont les valeurs attendues, si Q ne dépend pas de la fréquence. On note l’influence très importante de θ, l’écart à la linéarité, et la forte décroissance des amplitudes à haute fréquence pour les trajets polaires. Masquer
Fig. 4. Rapport d’amplitude DF/BC en fonction de la fréquence pour différents trajets ayant leur point le plus bas sous l’Afrique, et pour des valeurs décroissantes de l’angle θ entre le rai et l’axe de rotation de la ... Lire la suite
For paths at intermediate θ-values, a different behaviour is observed, although the dispersion in the results is rather large at low frequency. For θ ∼ 57° (Fig. 4b), the curves tend to depart from linearity, with a decay somewhat steeper at low frequency than at high frequency. The DF/BC ratio is slightly below that of mean Earth model at low frequency, but becomes significantly lower when f increases. For θ ∼ 49° (Fig. 4c), the most robust feature is the nearly flat section at frequencies higher than 4 Hz. The very sharp decrease at low frequency is marginally significant, as it could be observed for a few records only, because of the short time delay between PKPdf and PKPbc for most of the records of the relevant path (central Asia to PLCA, Δ ∼ 149.5°). The shape of the curve is in any case different from that observed for θ ∼ 57° (Fig. 4b) or for θ ∼ 23° (Fig. 4d).
For the most polar paths (θ ∼ 23°, Fig. 4d), the curves all reveal a very low DF/BC ratio at high frequency (see also the waveforms in Fig. 3b), and again a departure from linearity. The sharp decrease of the DF/BC ratio with frequency for polar paths, compared to the mild decrease for equatorial paths, is also clearly apparent on Fig. 3. At 0.4 Hz, DF/BC is five times smaller for polar paths than for equatorial paths. It is 25 times smaller at 1.6 Hz, with DF/BC as low as 0.016 for polar paths.
In order to check whether this spectacular decrease of DF/BC with frequency is a general characteristic of polar paths, or a regional effect, polar paths have been investigated at worldwide scale. They all exhibit similar features [26]. As an example, Fig. 4e shows the result for the path from Kamchatka to QSPA at South Pole, with a turning point beneath New Hebrides.
5 Discussion
Two main observations have to be explained. The first one is the now well known anisotropy in attenuation and its correlation to the anisotropy in velocity, with fast paths and strong attenuation in the polar direction. The second and new one is the varying frequency dependence of wave amplitude decay with ray orientation, with a mild linear decay of Ln(DF/BC) with frequency for equatorial paths, and a strong, non-linear decay for non-equatorial paths. This results in a very strong anisotropy in wave amplitude at high frequency, with very low DF/BC ratios for polar paths. Also noticeable is the influence of θ on the spectral shape, observed for paths turning beneath Africa. It will be important in the future to investigate other areas in order to check whether these features are present worldwide, the difficulty being to find favourable geometric configurations of ray paths.
An other important observation is the significant dispersion observed for polar paths. A consequence is that the inner core anisotropic velocity model will depend on frequency, a point to take into account in reconciling eigenmode and body wave models.
It seems unrealistic to ascribe our observations to mantle or to inner core heterogeneities or anisotropy lateral variations [35], even so they may be responsible of part of the scattering in the results. The simultaneous observation of amplitude decay and dispersion is a strong argument in favour of inner core attenuation as the prevailing mechanism.
Previous studies have been able to explain part of our observations with either anelastic attenuation with a specific absorption band [13,17], or scattering by a fabric with specific characteristics [5,7,11,31]. The method used in some previous studies [11,13,17] is based on PKPdf pulse shape modelling, whereas we consider spectral ratio DF/BC, but these two kinds of observations contain potentially the same information. In a model of solidification texturing involving a dendritic growth perpendicular to rotation axis [4], the strong attenuation for polar paths could be explained by the large number of crossed grain boundaries, compared to equatorial paths. By contrast, the mild, linear decay of Ln(DF/BC) with f for equatorial paths, which corresponds to a large quality factor (Q ∼ 800–1200), suggests that the contribution of viscous processes to attenuation (if any) is very low. For polar paths, the strong amplitude decrease and the strong dispersion increase observed in the frequency range 0.2–0.5 Hz would correspond to scattering by structures as large as 20–50 km, which seems unrealistically large [7,11]. Other mechanisms will have to be explored [2], related for example to the possible presence of thin fluid sheets between dendrites or along grain boundaries, to melting-freezing in liquid inclusions, to viscous flow between inclusions, or to texturing induced by outer core flow or internal deformation.
Acknowledgments
I thank the Institutions who provided data for this study through FDSN (CD, G, GE, II, IU GT, PS), and M. Calvet, M. Monnereau, V. Cormier, M. Bergman and two anonymous reviewers of a first version of the manuscript for helpful comments.