

1 Introduction
Monsoon systems are critical features of the global climate. They are characterized in the Northern Hemisphere by a humid season in summer and a dry season in winter, as well as a seasonal reversal of winds. This study is focused on three main regions, the Indian monsoon, the East-Asian monsoon and the North-African monsoon. It has been shown that they are responsive to changes in insolation induced by variations of Earth's orbital parameters [16,18,34]. Paleoclimate records suggest that these monsoon systems have significantly evolved during the Holocene and that they were enhanced in the Northern Hemisphere during the Early to Mid Holocene compared to present-day [9,10,13,15,19,28,29,33].
This work is complementary to the study by Marzin and Braconnot [25] who have analyzed in detail the response of Indian and African monsoons to changes in insolation at 6 and 9.5 kyr BP using the IPSL–CM4 ocean–atmosphere coupled model. Monsoon rainfall was intensified at 6 and 9.5 kyr BP, compared to 0 kyr BP, as a result of the intensified seasonal cycle of insolation in the Northern Hemisphere. These three periods of the Holocene were chosen for their orbital parameters’ differences, the precession being the most varying parameter throughout the Holocene. This results in a warmer boreal summer for 9.5 kyr BP in phase with the present-day insolation maximum and in a delayed warming (by approximately one month) for 6 kyr BP compared to present-day. This previous study showed that the relative response of the Indian and African monsoon is a function of precession. When the maximum change in insolation occurs in phase with the development of the monsoon system, the amplification is larger, which explains why in their simulations the decrease of the Indian monsoon is more gradual during the Holocene than that of the African monsoon which is larger in the second half of the Holocene. The role of precession on the timing and on the relative amplification of monsoon seasonal cycle is highlighted. Stronger moisture advection, enhanced meriodional gradient of tropospheric temperatures and the feedback of the Tibetan Plateau snow cover were the mechanisms analyzed to explain the monsoon variations and the differences between the subsystems. However, Marzin and Braconnot [25] did not isolate the role of the ocean feedback. We address this issue in this paper by comparing the results of the coupled simulations with the corresponding forced simulations, for which sea surface temperature (SSTs) are taken from the present-day coupled simulation. This study focuses on the African, Indian and East-Asian monsoons.
Several modeling studies have shown that the ocean feedback introduces a delay in the response to the change in summer insolation at the Mid-Holocene [3,12,18,21]. In the tropical Atlantic, the dipole of SST anomalies described by Kutzbach and Liu [18] indicates the role of the evaporation feedback in strengthening the ocean warming north of 5° N. Zhao et al. [35] have compared the role of ocean circulation changes on monsoon evolution for several coupled models which participated in the second phase of the Paleoclimate Modeling Intercomparison Project.
Braconnot et al. [4,5] further analyze how the dipole is created and maintained. In addition to the evaporation feedback, they show that the change in the Ekman transport also plays a role. The larger the dipole, the larger the monsoon change [6]. Liu et al. [20] investigated the role of ocean feedback on global monsoons evolution for several time slices of the Holocene. These studies have also demonstrated a positive ocean feedback for the African monsoon during the Mid-Holocene whereas it is negative for the Asian monsoon. Several studies have highlighted a dampening of the Asian monsoon due to ocean feedback [5,27], a warmer Indian Ocean and western Pacific during late summer inducing reduced convection over the land.
Braconnot and Marti [1], Braconnot et al. [7] further showed that the seasonal cycle of SST in the Indian Ocean depends on precession. It involves a feedback loop between the monsoon winds, precipitation, river runoff and mixed layer depth. In late summer the west Indian Ocean warming creates a dipole across the Indian Ocean which delays the southward withdrawal of monsoon over the ocean [35]. Braconnot et al. [3] have also shown that the changes in the meridional ocean heat transport is as large as the atmospheric heat transport in the Tropics.
In this study we investigate the impact of the ocean feedback on the African, Indian and East-Asian monsoon amplifications at 6 and 9.5 kyr BP. The models used for the coupled and forced simulations are presented in section 2, as well as the experiments and the radiative forcing changes at 6 and 9.5 kyr BP. The monsoon responses in the coupled simulations are described in section 3. In section 4, we examine the impact of the ocean feedback and interesting regional features. A summary is given in section 5.
2 Model, experiments and insolation variations
2.1 IPSL–CM4 coupled model
The coupled simulations are performed with the version of the IPSL coupled model [23,24] used for future climate projections as part of the WCRP/CMIP3 multi-ensemble experiments [26] that served as a basis for the last IPCC assessment [31]. IPSL–CM4 couples the grid point atmospheric general circulation model LMDz [14] developed at Laboratoire de Météorologie Dynamique (LMD, France) to the oceanic general circulation model ORCA [22] developed at the Laboratoire d’Océanographie et du Climat (LOCEAN, France). On the continent, the land surface scheme ORCHIDEE [17] is coupled to the atmospheric model. Only the thermodynamic component of ORCHIDEE is active in the simulations presented here. The closure of the water budget with the ocean is achieved via a river routing scheme implemented in the land surface model. A sea-ice model [8], which computes ice thermodynamics and dynamics, is included in the ocean model. The ocean and atmospheric models exchange surface temperature, sea-ice cover, momentum, heat and fresh water fluxes once a day, using the OASIS coupler [32] developed at CERFACS (France). None of these fluxes are corrected. In its present configuration, the model is run at medium resolution. The atmospheric grid is regular, with a resolution of 3.75° in longitude, 2.5° in latitude, and 19 vertical levels. The ocean model grid has approximately 2° resolution (0.5°near the equator) with 182 points in longitude, 149 points in latitude and 31 vertical levels.
The representation of monsoon systems in the coupled model IPSL–CM4 is discussed in detail in Marzin and Braconnot [25]. The global dynamic features of monsoon circulation are well reproduced; however, the rainfall over the land in Sahel and India is underestimated and does not penetrate north enough. The amplitude and seasonal cycle of East-Asian monsoon precipitation are well represented in this model.
2.2 Experimental design
Three simulations were performed with IPSL–CM4 for the climates of 9.5 kyr BP, 6 kyr BP and of the preindustrial periods (hereafter 9.5k, 6k and 0k respectively) considering only the variations of the orbital parameters described below. The vegetation cover and green gas concentrations are kept to modern values. Climatologies are computed from the last 100 years of each simulation. The methodology to separate the ocean feedback from the total response is to run the same simulations with the atmosphere-land component of the model. Following Braconnot et al. [2], we extracted 20 years of daily SST from the control simulation with the coupled model and prescribed them in all the atmospheric alone simulations. In these simulations, the SST is prescribed the same as the modern control coupled simulation so that we consider only the atmopsheric response to the orbital parameters variations (hereafter 9.5fk, 6fk, 0fk for the forced simulations). These experiments are integrated for 20 years and averaged over these 20 years for the monthly climatologies. By sub-tracting the sets of coupled simulations by the atmospheric simulations, we can extract the ocean feedback on the climatic response to orbital parameters variations during the Holocene.
With this methodology, the coupled control simulation would be the reference for the paleo simulations either with the coupled model or with the atmosphere model alone. However, the version of the atmospheric model we used for the SST-forced simulations is slightly different from the one of the coupled model. We thus ran also a control simulation with the atmosphere model alone to check that we discuss the role of the ocean feedback and not the difference between two model versions. This introduces a bias between the two sets of simulations. We have to take this into account while looking at the ocean feedback. However, the differences are not significant enough to qualitatively affect the results presented here.
2.3 Insolation variations
Changes in insolation due to slow variations of the Earth's orbital parameters are the major driver of climate variability during the Holocene. Precession and obliquity are the two parameters that shape the insolation forcing over this period. The values of the orbital parameters for the 0, 6 and 9.5 kyr BP climates are given in Marzin and Braconnot [25]. Precession controls the seasonal variations of insolation, whereas obliquity controls the contrast between low and high latitudes. With the summer solstice close to the perihelion at 9.5 kyr BP (ω – 180 = 303.03), the magnitude of the seasonal cycle of insolation was enhanced in the Northern Hemisphere at 9.5 kyr BP compared to present-day and in phase with the present seasonal cycle (Fig. 1). As a result, summer seasons were warmer and shorter and winter seasons cooler and longer. At 6 kyr BP, the autumnal equinox is near the perihelion (ω – 180 = 0.87). This leads to a shift in the timing of the seasonal variations. The difference in insolation averaged over the Northern Hemisphere (10°–50° N, Fig. 1) lags the change in insolation at 9.5 kyr BP by about one month. The maximum amplification is reduced at 6 kyr BP (25 W m–2) compared to 9.5 kyr BP. The change in obliquity has almost no impact between 6k (ɛ = 24.105) and 9.5k (ɛ = 24.231) but explains the difference in the high latitudes compared to the control. We will then consider both the changes in the magnitude and timing of the seasonal cycle when analysing the impact of insolation forcing on the African and Asian monsoons. To take into account the changes in the length of the seasons, we should have used a celestial definition of the calendars for each climate, as in Joussaume et al. [16], Marzin and Braconnot [25], but for convenience we used the modern definition of calendar, as it does not change qualitatively the results presented here.
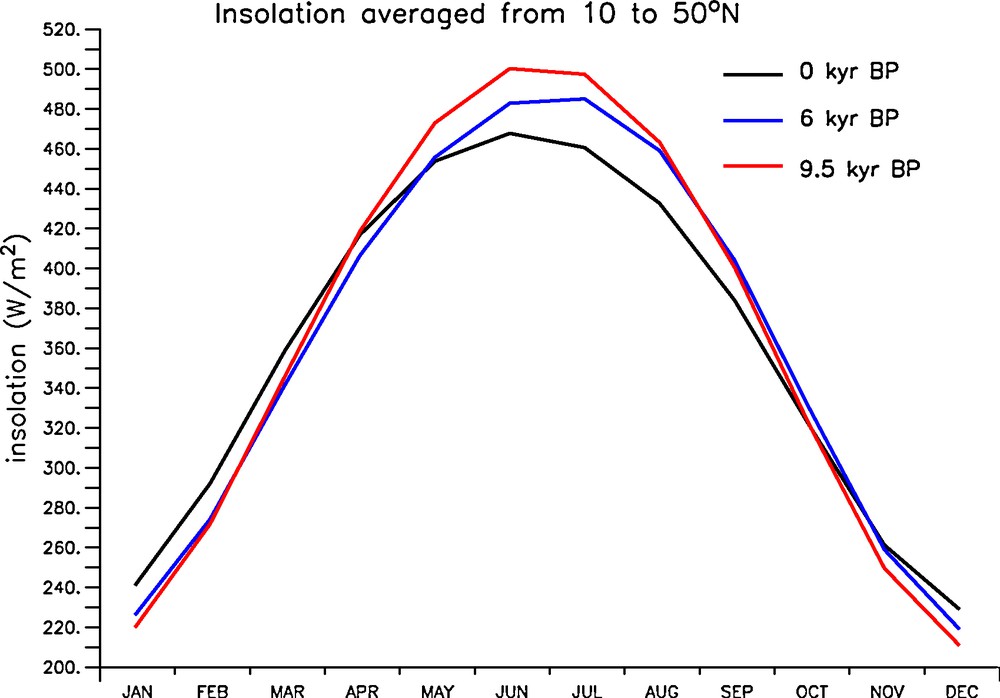
Incoming solar radiation at the top of the atmosphere (W/m2) averaged from 10 to 50̊ N and plotted as a function of months, for 0, 6 and 9.5 kyr BP. The celestial calendar is used to compute the monthly means.
Rayonnement solaire incident au sommet de l’atmosphère (W/m2) moyenné de 10 à 50̊ N et tracé en fonction des mois pour les périodes d’il y a 0, 6000 et 9500 ans (0 ka, 6 ka et 9,5 ka). Les moyennes mensuelles sont calculées en utilisant le calendrier céleste.
3 Large-scale characteristics of the different periods
3.1 Monsoon responses in the coupled simulations
In response to increased boreal summer insolation averaged from June to September (JJAS), the model produces higher temperatures over the northern Hemisphere continent (Fig. 2) both at 6 and 9.5k compared to present-day. However, the ocean remains cool in summer, except in the northern Atlantic and northern Pacific. This results from the latitudinal gradient in the insolation forcing and the thermal inertia of the ocean. In addition, the melting of sea ice in high latitude strengthens the warming there. The land-sea temperature contrast is enhanced, as well as the seasonal contrast of temperatures. Low pressure centres are intensified over the Himalaya and the Sahara, favouring the advection of moist monsoon flow into the continent and thus increasing precipitation (Fig. 3). Monsoon regions present a cooling anomaly due to local recycling and cloudiness. The local SST patterns will be discussed more in detail in the next subsection.
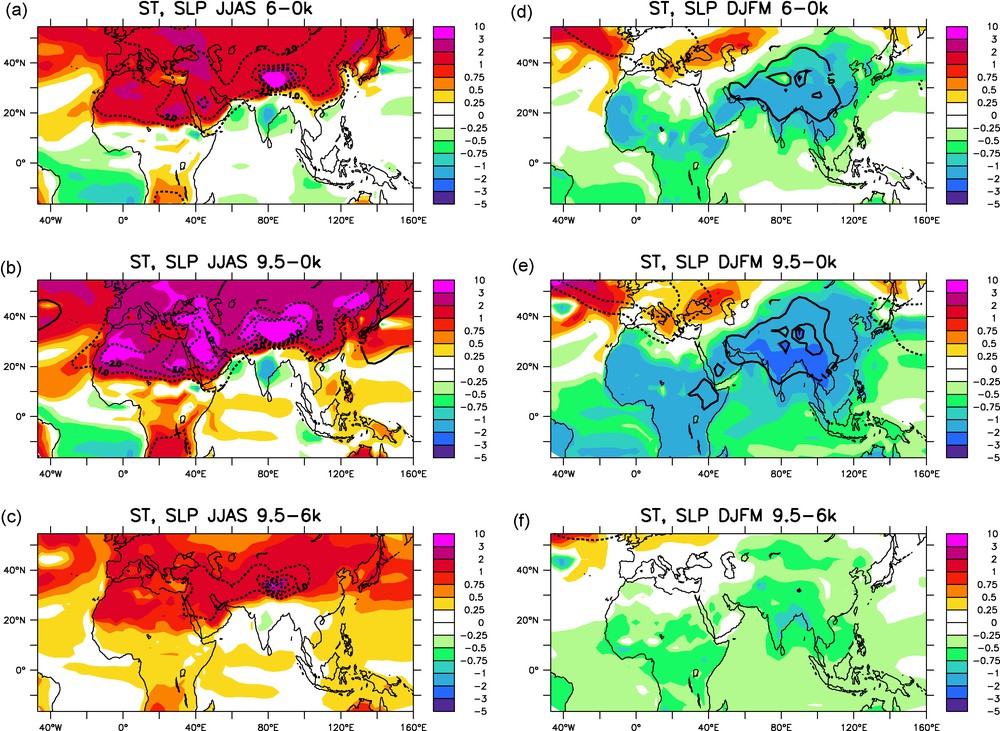
Surface temperature (K) and sea level pressure (hPa) differences for JJAS between (a) 6–0 kyr BP (b) 9.5–0 kyr BP (c) 9.5–6 kyr BP coupled simulations; and (d), (e), (f) for DJFM.
Différences de température de surface (K) et de pression au niveau de la mer (hPa) pour l’été boréal (gauche moyenne JJAS) et l’hiver boréal (droite, moyenne DJFM) entre (a, d) 6–0 ka (b, e) 9,5–0 ka (c, f) 9,5–6 ka.
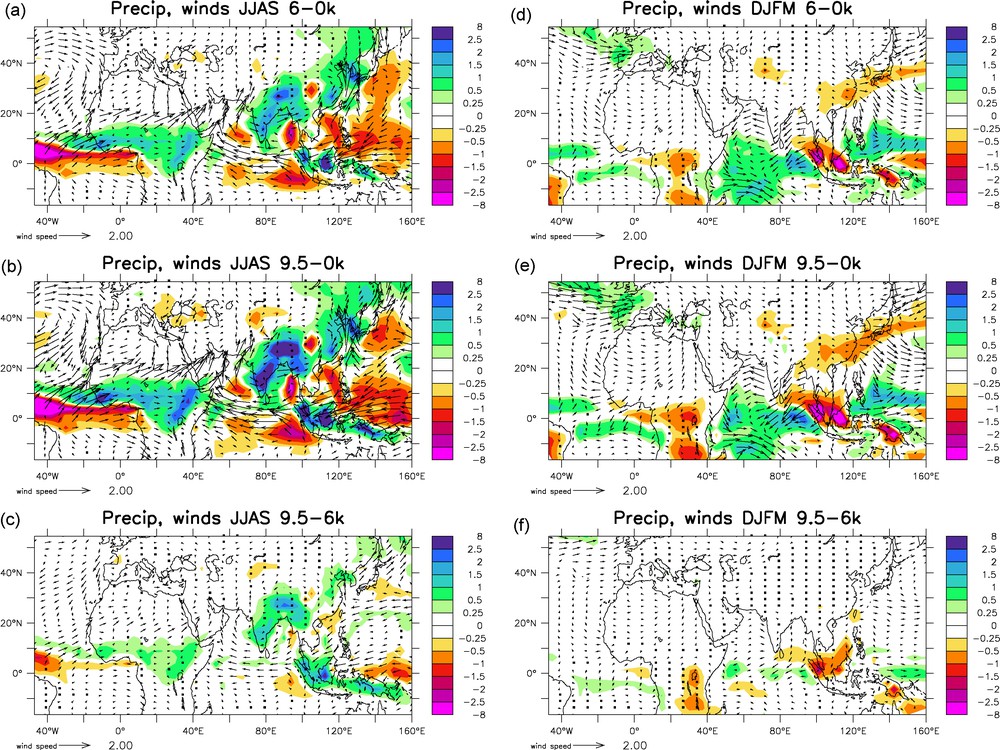
Precipitation (mm/day) and surface winds (m/s) differences for JJAS between (a) 6–0 kyr BP (b) 9.5–0 kyr BP (c) 9.5–6 kyr BP coupled simulations; and (d), (e), (f) for DJFM.
Différences de précipitation (mm/j) et de vent de surface (m/s) pour l’été boréal (gauche moyenne JJAS) et l’hiver boréal (droite, moyenne DJFM) entre (a, d) 6–0 ka (b, e) 9,5–0 ka (c, f) 9,5–6 ka.
The amplification of monsoon systems at 6 and 9.5k is clearly seen on Fig. 3. Precipitation are increased by 1 to more than 2 mm/day over the Sahel, East Africa, the whole Indian continent and the eastern part of China. As for the surface temperatures, the change is even more visible at 9.5 than at 6k. The surface winds indicate a strengthening of the monsoon flow, and it has been shown in Marzin and Braconnot [25] that 80% of the changes are due to advection processes and the rest to local recycling. Marzin and Braconnot [25] highlighted the impact of the tropospheric temperature meridional gradient on the amplification of the Indian monsoon; this is also valid for the East Asian monsoon [11].
The most important result brought out by Marzin and Braconnot [25] is the relative difference of amplification of the Indian and African monsoons between 6 and 9.5k. The increase in precipitation between 6 and 9.5k is relatively stronger over the Indian region than over Africa. On Fig. 3, the response over East Asia is similar to the African monsoon, with a small amplification between 6 and 9.5k and a larger delay in the Late Holocene. Several hypothesis and mechanisms have been detailed in Marzin and Braconnot [25] to explain these differences. The precession plays an important role on the seasonal cycle of insolation to favour one monsoon system more than the other according to the seasonal cycle of the phenomena. The positive feedback of the snow cover over the Tibetan Plateau contributes to enhance the Indian monsoon at 9.5k. In addition, the teleconnection between India, the Mediterranean Sea and North Africa has been investigated, showing that the strength of the increased subsidence around the Mediterranean Sea is well correlated with the strength of the Indian monsoon as would be expected from the triggering of Rossby wave by the convection over India [30].
During the Northern Hemisphere winter, the reduced insolation averaged from December to March (DJFM) results in a large cooling over the ocean and a maximum cooling over Africa and Asia at 6 and 9.5k (Fig. 2). The large high-pressure centre is amplified over the Himalaya and favours advection from the land to the ocean. This results in a stronger convergence over the tropical oceans, with more precipitation and a southward shift of the ITCZ in the tropical Atlantic, The Indian Ocean and the equatorial western Pacific (Fig. 3). This large scale features are in good agreement with previous modelling intercomparison studies for the Mid-Holocene [5,21,35].
3.2 Response of the ocean
The summer SST variations between 6 and 0k and 9.5 and 0k are similar at the global scale, with a maximum warming in mid and high latitudes in the Northern Hemisphere that is directly related to the insolation forcing (Fig. 2a and b). The amplitude of these SST variations is increased at 9.5 compared to 6k over the northern Atlantic and Pacific oceans, following the differences in the magnitude of insolation. However, between 6 and 9.5k, the tropical oceans SST patterns are significantly different in some places, highlighting shifts in seasonality between the two periods and feedbacks from the response of the ocean circulation to the local insolation forcing and the large scale dynamics. Between 6 and 0k, an overall ocean cooling is observed in the tropical oceans, as shown in previous studies [35], but between 9.5 and 0k, a warming is observed over the equatorial Atlantic, the tropical Indian Ocean and the tropical Pacific. This signal is highlighted in the difference between 9.5 and 6k simulations (Fig. 2c).
Following Zhao et al. [35], we plotted the seasonal evolution of SST over key boxes in the Atlantic Ocean, the Indian Ocean, the warm pool and the North-West Pacific. Fig. 4a shows that the warming of the tropical ocean occurs later in autumn at 6k compared to 9.5k due to the delayed response of the ocean to insolation forcing. Also, the difference between the Early and Mid-Holocene are as large as the differences between these periods and the control. Over the tropical Atlantic, (Fig. 2a and b) show a SST gradient anomaly with a warmer northern tropical Atlantic box (60° W–20° W, 10° N–20° N) and a colder southern tropical Atlantic box (30° W–0° E, 10° S–5° N) between 6 and 0k and 9.5 and 0k. This is associated with a northward shift of the ITCZ induced by a stronger surface wind convergence over the northern tropical Atlantic (Fig. 3). This dipole in the Atlantic is driven by the insolation forcing meridional gradient. Zhao et al. [35] further show that it is reinforced by a wind-evaporation feedback in the northern box and by changes in the ocean circulation. Fig. 4a represents the seasonal cycle of the SST gradient over the tropical Atlantic for the three periods. The amplification of this gradient of about 0.5 °C compared to 0k from spring to autumn is the same for the Mid and the Early Holocene. Therefore, the ocean feedback does not explain differences in the strength of the African monsoon between these two time periods. The monsoon intensification between 6 and 9.5k is mainly driven by continental warming. At 9.5k, a warming anomaly occurs along the Equator and contributes to the warming of the southern Atlantic box, counteracting the effect of the insolation on the northern box. This anomaly is directly related to the reduction of the equatorial upwelling forced by the westerly surface wind anomaly (Fig. 3). As already mentioned in several publications (see Marzin and Braconnot [25]), the strengthening of the African monsoon results from increased moisture advection from Atlantic Ocean. However, the source region is located to the north of the Equator strengthening the northern branch of the monsoon flow and decreasing the branch from the Gulf of Guinea and the interhemispheric transport across the Equator. Therefore, the southeasterly trade wind is less intense which prevents the full development of the summer upwelling along the Equator [18]. This effect is stronger at 9.5k.
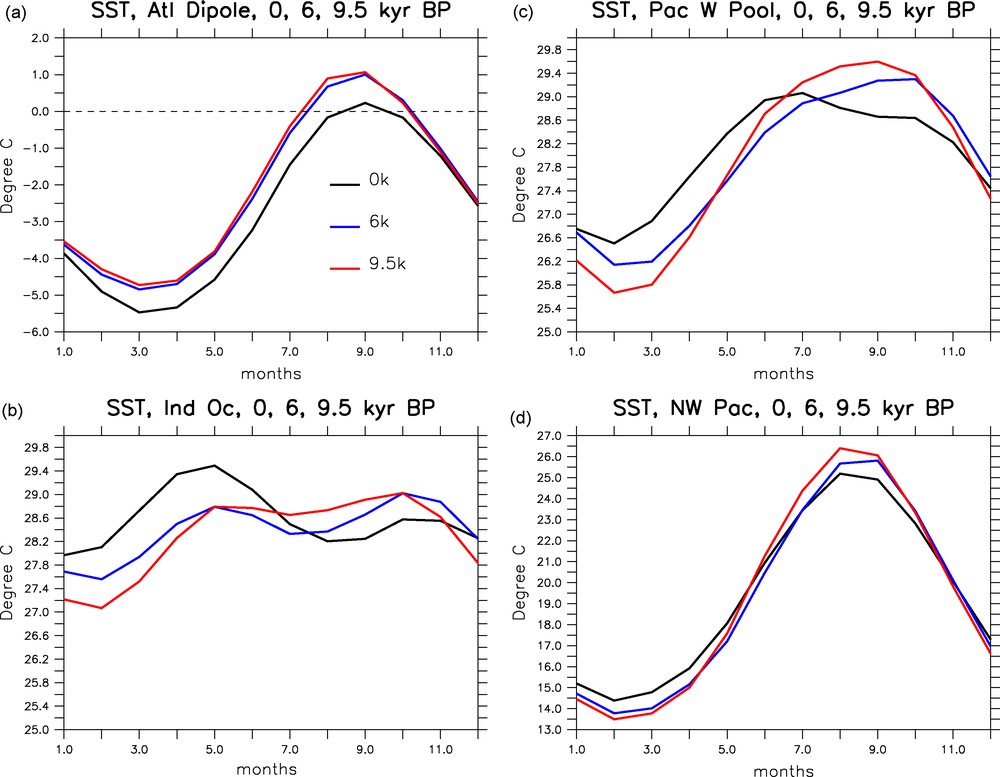
Monthly SSTs (°C) averaged over (a) difference between northern tropical Atlantic (60° W–20° W, 10° N–20° N) and southern tropical Atlantic (30° W–0° E, 10° S–5° N), (b) Indian Ocean (60° E–100° E, 0° N–10° N), (c) western Pacific warm pool (110° E–150° E, 5° N–15° N), (d) north western Pacific (110° E–150° E, 25° N–35° N).
Cycle annuel des températures de surface de la mer pour (a) la différence entre les moyennes obtenues pour l’océan Atlantique tropical Nord (60° O–20° O, 10° N–20° N) et l’océan Atlantique tropical Sud (30̊ W–0̊E, 10̊ S–5̊ N), (b) l’océan Indien (60° E–100° E, 0° N–10° N), (c) la « warm pool » de l’Ouest Pacifique (110° E–150° E, 5° N–15° N) et (d) le Pacifique Nord-Ouest (110° E–150° E, 25° N–25° N).
Another significant feature at 9.5k compared to 6k is the warming of the tropical Indian Ocean and Pacific. Fig. 4b, c and d represent the seasonal cycle of SST for the three periods over the Pacific warm pool, the Indian Ocean and the North-West Pacific. The SST warming occurs later than July at 6k compared to 0k, with a cooling before. However, at 9.5k, the warming starts earlier and is larger in the three regions. Zhao et al. [35] have shown that over the selected region of the Indian Ocean, there is a significant contribution of the wind-evaporation feedback to the warming and that the variations of the mixed layer depth increase the rate of warming in this area.
The mixed layer depth difference for JJAS between 9.5k and 0k plotted on Fig. 5 gives more insight in the SST features described above. A large deepening of the mixed layer is observed along the equatorial Atlantic, and is consistent with the weakening of the trade winds and of the equatorial upwelling between 9.5 and 0k. The shallowing observed over the northern tropical Atlantic is more related to a negative anomaly of the wind stress curl (verified but not shown). Another feature is the large shallowing of the mixed layer depth over the whole northern Indian Ocean. Braconnot and Marti [1], Braconnot et al. [7] have shown that it is related to the decrease of the salinity at the surface, due to the increase of precipitation and runoff at the beginning of the Holocene. The stratification reduces the thermal inertia of the upper layer of the ocean and enables a stronger response to the insolation warming in autumn (Fig. 4b). Braconnot et al. [7] have discussed more in detail the differences in the temperature and salinity seasonal cycles between 6 and 9.5k and the impact of the precession. Fig. 4b shows that at present-day, the SST maximum is reached in April before the onset of the monsoon. Then SST decreases and a secondary maximum occurs in autumn. Due to direct insolation forcing and feedbacks, the spring warming is damped at 6 and 9.5k and the secondary maximum in August is amplified. The reduced SST in summer also disappears at 9.5k. The warming over the north-western Pacific and over the warm pool are more directly linked to the insolation forcing (not shown). The impact of the ocean interaction on the tropical response to changes in insolation is significant. Over the warm pool SST maximum is reached in April at 0k. From the Early to Mid Holocene, the warming is such that the SST maximum is reached during boreal summer or in autumn and that SST are larger than at present during the summer monsoon season. This warming slightly damps the land sea contrast in this region.
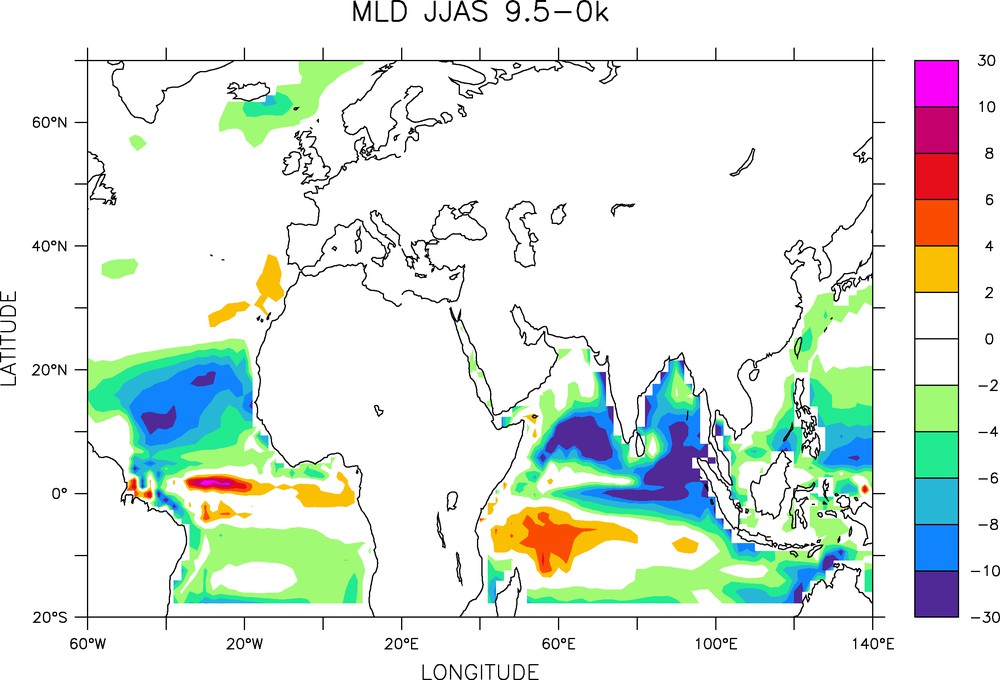
Mixed layer depth (m) difference between 9.5 kyr and 0 kyr averaged for JJAS.
Différence de profondeur de la couche de mélange (m) pour JJAS entre 9,5 ka et 0 ka.
4 Impact of the ocean feedback on monsoon systems
4.1 Summer and winter response of the global climate and monsoons to the ocean feedback
To isolate the ocean feedback on the change in precipitation from the direct insolation impact, we analyse the climate produced by the atmospheric model when SSTs are prescribed to those of the 0k coupled simulation in all the simulations. The impact of the response of the ocean to the insolation forcing is then obtained by the difference between the climate change with the atmosphere and the coupled models. To be consistent with 20 years of SSTs chosen to force the atmospheric model, the climatology used for the 0k coupled simulation is averaged over the same 20 years. Because of the small change between the versions of the atmospheric model, we need to take into account the difference between the control simulations by sub-tracting the climate change from the coupled simulations from the climate change from the forced simulations. The ocean feedback effect on summer and winter precipitation is presented on Fig. 6. The first significant feature is the positive ocean feedback over the tropical Atlantic, which is a common feature for most of the models [5,35]. This is associated with a northward shift of the ITCZ driven by the SST dipole anomaly described in the previous section. Over Sahel, we cannot conclude about the ocean feedback on the precipitation change from the JJAS average; however, Fig. 7a shows that it is positive in the first part of the monsoon season as discussed in the next section. The ocean feedback impact over Sahel is not significantly different between 6 and 9.5k suggested by the fact that the change in the dipole across 5° N is similar at 6 and 9.5k.
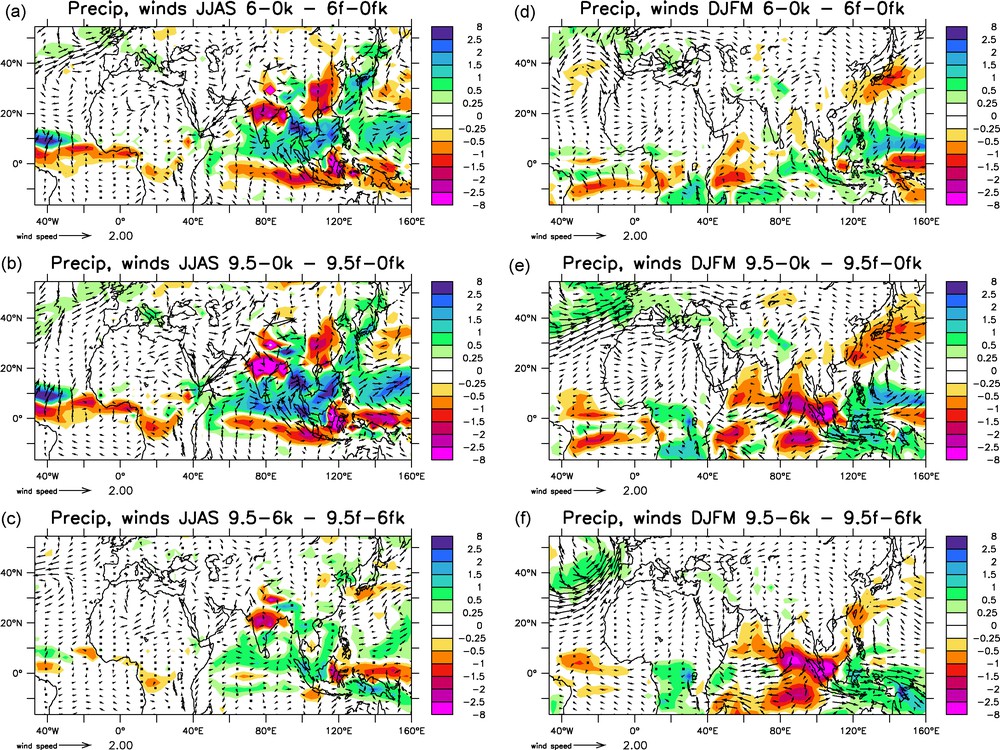
Differences between coupled simulations and forced simulations of precipitation (mm/day) and surface winds (m/s) differences for JJAS between (a) 6–0 kyr BP (b) 9.5–0 kyr BP (c) 9.5–6 kyr BP; and (d), (e), (f) for DJFM.
Différence de précipitation (mm/j) et de vent de surface (m/s) entre les simulations couplées et les simulations forcées pour JJAS (gauche) et DJFM (droite) et (a, d) 6–0 ka (b, e) 9,5–0 ka (c, f) 9.5–6 ka.
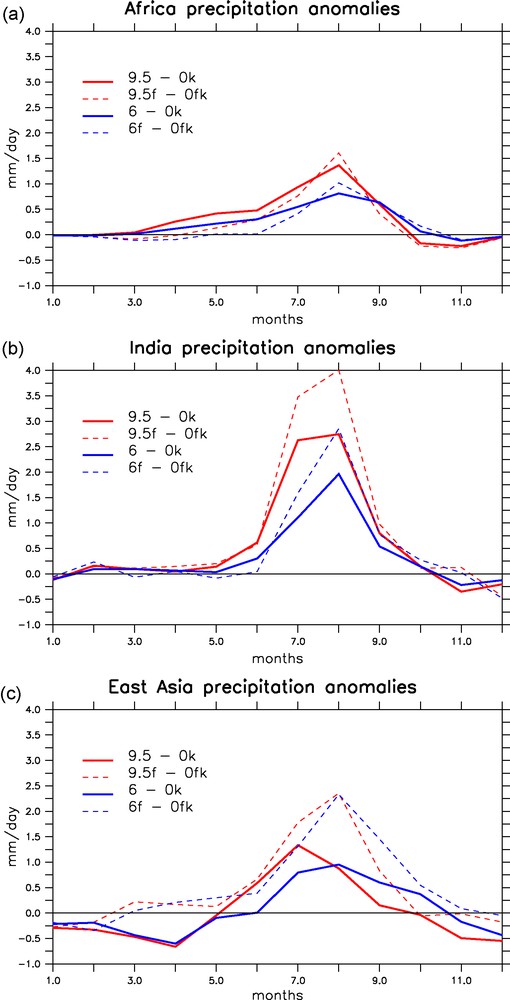
Monthly land precipitation averaged over (a) North Africa (20° W–20° E, 7° N–18° N), (b) India (70° E–95° E, 10° N–35° N), (c) East Asia (105° E–125° E, 20° N–40° N).
Évolution saisonnière des précipitations continentales moyennées sur (a) le Nord de l’Afrique (20° O–20° E, 7° N–18° N), (b) l’Inde (70° E–95° E, 10° N–35° N), et (c) l’Est de l’Asie (105° E–125° E, 20° N–40° N).
Over Asia, the ocean feedback on precipitation seems more complex. It is strongly negative over North India, with an Indian monsoon less amplified in the coupled simulations than in the forced simulations. This negative feedback of the ocean is associated with a strong positive feedback increasing precipitation over the Indian Ocean and the western tropical Pacific. At 9.5k, this moisture convergence over the ocean is associated with a warming to the South of the Indian subcontinent and of the western tropical Pacific (Fig. 2b). Higher SSTs are observed particularly at the end of the summer towards autumn both at 6k and 9.5k (Fig. 4b and c). This triggers an intensified Hadley-type circulation, reducing convection over North India. This negative ocean feedback is still effective between 6 and 9.5k (Fig. 6c), even though its magnitude is reduced at 6k.
Over East Asia, the ocean feedback is strongly negative between 6 and 0k and 9.5 and 0k, but is not significantly different between 6 and 9.5k. The reduced precipitation over North-East China is associated with more moisture convergence to the east over the ocean and to the south over the western tropical Pacific. This is associated with a warming anomaly over the North-West Pacific and the western tropical Pacific, reducing the East–West and North–South land sea contrast.
During boreal winter, a clear southward shift of the ITCZ is observed over the tropical Atlantic, the western Indian Ocean and the tropical Pacific. It is driven by the intensified interhemispheric gradient of temperature due to the cooling of the Northern Hemisphere. For the change between 9.5k and 0k, there is a large dipole structure of precipitation with increased rainfall over the tropical western Pacific and reduced rainfall over eastern tropical Indian Ocean. The difference between the coupled and forced simulations in winter is due to colder ocean and a reduced evaporation over the ocean.
4.2 Seasonal timing of the monsoon response to ocean feedback
The impact of SST changes on the seasonal timing of monsoon is also investigated by analyzing the changes in the seasonal cycle of rainfall for monsoon regions and the changes in SST seasonal cycle in key regions. The positive ocean feedback on precipitation over Sahel (Fig. 7a) seems to be predominant in the first part of the monsoon season, in June–July. Later, there is no difference for the change between 6 and 0 and 9.5 and 0k for the coupled and forced simulations. The cold tropical SST and the strengthening of the Atlantic dipole favours an earlier onset of the monsoon. The ocean feedback in August is slightly negative. It is however not possible to analyse further the simulations, since the slight difference between the versions of the atmospheric model used in the coupled and forced simulations produce different lengths of the African monsoon because of small changes in the land surface scheme. The gradient of SST between a northern tropical Atlantic box and a southern tropical Atlantic box (Fig. 4a) is very weak between 6 and 9.5k.
The seasonal cycle of precipitation changes over India in both coupled and forced simulations indicates the large negative feedback of the ocean in this region (Fig. 7b). However, at the beginning of the monsoon season, the ocean feedback on precipitation seems to be positive in June for the 6-0k difference. The SST seasonal cycle shape is considerably changed compared to present-day over the Indian Ocean (Fig. 4b). The dominant peak in spring at present-day becomes secondary at 6 and 9.5k compared to the SST peak in autumn. As a consequence, the Indian Ocean is cooler in spring and beginning of summer at 6k favouring the moisture advection towards the land. From July, it becomes warmer, especially at 9.5k, and favours the retreat of the moisture convergence over the ocean, reducing land precipitation over India. The negative ocean feedback does not affect the proportional change of precipitation over India between 6 and 9.5 kyr BP. The increase is consistent with the insolation forcing and the delay in the ocean response compared to Early Holocene.
The ocean feedback over East Asian monsoon is more complex and is not directly related to the surrounding surface ocean temperatures. It is strongly negative throughout the monsoon season (Fig. 7c), with a peak in August corresponding to a maximum warming of the tropical western Pacific and the north-western Pacific between 9.5 and 0k (Fig. 4c). However, the feedback is of similar amplitude between 6 and 9.5k (Fig. 6). As a conclusion on the relative amplifications between the monsoon subsystems, the ocean feedback does not explain the dominant amplification of the Indian monsoon between 6 and 9.5k in the coupled simulations, as it is also in this region that the negative feedback of the ocean is the strongest. The role of the precession and of the snow cover feedback over the Tibetan Plateau detailed in Marzin and Braconnot [25] are more plausible.
5 Conclusions
The role of the ocean feedback on monsoon precipitation during the Holocene is investigated by comparing 2 sets of experiments: coupled ocean–atmosphere simulations at 0, 6 and 9.5k and atmosphere-only simulations for the same periods forced by the SSTs of the control coupled simulation. The amplification of the Indian, East Asian and African monsoon systems is seen at 6 and 9.5k for both sets of simulations. Their relative amplification responding to different seasonal insolation forcings is specific to each system. The Indian monsoon is largely amplified between 6 and 9.5k, whereas the difference in land precipitation between these two periods is small over Sahel and East Asia. Mechanisms and the role of precession on these seasonal amplifications are detailed in Marzin and Braconnot [25] for the coupled simulations.
In the coupled simulations, the ocean responds to the seasonal insolation forcing by a delayed cooling in winter and warming in summer. Also, following the seasonal shift in the minimum and maximum of insolation forcing between Early and Mid Holocene, the ocean response is delayed by about one month at 6k. The Atlantic dipole anomaly with warmer SST to the north of 5° N and colder SST to the south of it strengthens the early stage of the African monsoon. The amplification of this dipole is similar at 6k and 9.5k, because the large insolation of 9.5k is partly compensated by higher SST along the Equator resulting from a damping of the equatorial upwelling. The effect of precession on the surface ocean changes is more highlighted in the Indian Ocean, the warm pool and the north-western Pacific with a maximum warming from July to September at 9.5k, and a warming at 6k that is smaller in amplitude but more delayed towards autumn. The results at 6k are consistent with Zhao et al. [35].
The ocean feedback on monsoon precipitation is shown to be consistent with previous studies [5,21,27,35]. It is positive at 6 and 9.5k over Sahel, especially in the first part of the monsoon season and strongly negative throughout the season for the Indian and East Asian monsoons. Ohgaito and Abe-Ouchi [27] have shown that the thermodynamic effect of the ocean feedback was dominant for the Asian monsoon changes and that the negative feedback was more important during early summer. This is also true in our case for the Indian monsoon but not for the East Asian monsoon. Our results are overall consistent with their findings even though a detailed comparison is not possible because of the difference in the area of interest.
The originality in this study relies on the fact that the three monsoon systems respond in different ways to insolation forcing and to ocean feedback for the three periods. The monsoon amplification is small between 6 and 9.5k over Sahel and East Asia whereas it is large over the Indian continent [25]. The ocean feedback over precipitation is positive for the African monsoon but of similar amplitude at 6 and 9.5k. Over the East-Asian area, it is negative but also of similar amplitude at 6 and 9.5k. However, the strong effect of the negative ocean feedback on the Indian monsoon is even larger at 9.5k than at 6k. Even though the ocean feedback plays a role on the amplitude and timing of the monsoon response to insolation changes, it does not explain the relative amplifications of the monsoon systems within the three periods [25]. These are related to the direct impact of the precession and to land surface processes.
Our results show that the ocean response in the Tropics results from a combination of direct insolation forcing, and feedbacks involving fresh water forcing and changes in the large scale atmospheric and ocean dynamics. The response of the mixed layer depth is large in some places, such as in the Indian Ocean, and locally affects the ocean inertia. The impact on the ocean biology needs to be analysed in depth to better understand the signature of the monsoon variations in time as reported from different marine proxies [33].