

1 Introduction
Half of the global population presently lives in urban centers. In these large urban areas, air quality is becoming a major concern, and as a result an important area of research has emerged during the last decade to quantify the emission sources of pollutants, to model the chemical and physical transformation that leads to the production of secondary pollutants, and to study the transport pathways for the dispersal of pollution.
Atmospheric composition can be measured from space, using remote sensing instruments onboard satellites based on different technologies and using various spectral ranges. Satellite observations complement ground-based and airborne measurements, which cover only limited areas of the globe. Global information is necessary to survey the evolution of atmospheric composition, both for climate and tropospheric composition issues. Fig. 1 illustrates the typical distribution of well-established ground-based networks, regular aircraft measurements and measurements from a polar Sun-synchronous satellite instrument.

Illustration of typical coverage for ground-based, airborne and satellite observations, for carbon monoxide measurements. Data are from the ESRL-NOAA network (http://www.esrl.noaa.gov/gmd/ccgg/iadv/), MOZAIC aircraft network (http://mozaic.aero.obs-mip.fr/web/), and MOPITT/Terra (http://terra.nasa.gov/About/MOPITT/), one day of cloud-free data.
Distribution caractéristique des observations de monoxyde de carbone par des moyens in-situ, aéroportés et par satellite. Les données proviennent du réseau ESRL-NOAA (http://www.esrl.noaa.gov/gmd/ccgg/iadv/), du réseau MOZAIC (avions) (http://mozaic.aero.obs-mip.fr/web/) et du satellite MOPITT/Terra (http://terra.nasa.gov/About/MOPITT/) pour une journée, avec filtrage des nuages.
Atmospheric sounding satellites rely on instruments using the range of radiation that extends from the microwave to the UV-visible spectral range. To sound the troposphere two types of missions exist, both of which use the nadir viewing geometry to sound the lower atmospheric layers: UV-visible-short wave infrared missions, that exploit the solar reflected light on the Earth surface as a source of radiation, and the thermal infrared (TIR) missions that record the TIR emission of the Earth-atmosphere system to sound the atmospheric composition. This article illustrates the current performance of TIR instruments onboard satellite to provide information relevant to atmospheric composition and air quality. We focus here on three specific applications that are being developed to exploit the huge data set provided by the recently launched European IASI/MetOp mission:
- • measurement of regional ozone to improve air quality forecast;
- • monitoring of CO related to fire events for long range pollution issues;
- • early detection of SO2 from volcanic plumes for aviation hazard mitigation.
2 Thermal infrared remote observations
Atmospheric sounding using the TIR spectral range rely on the analysis of atmospheric radiance spectra (W/cm2.cm-1.sr). The radiance signal recorded by the instrument in orbit is a composite of the initial longwave infrared emission (the Earth black body emission at the location of the measurement), modified by the absorption contribution of infrared absorbing molecules at each altitude, at a given spectral range. Each molecule has a specific signature, composed of spectroscopic transitions (ro-vibrational bands). This set of radiances is called an atmospheric spectrum, from which concentrations of molecules in the atmospheric path can be retrieved using a specific retrieval algorithm. Fig. 2 provides an illustration of the atmospheric absorption of different species in the TIR spectral range.
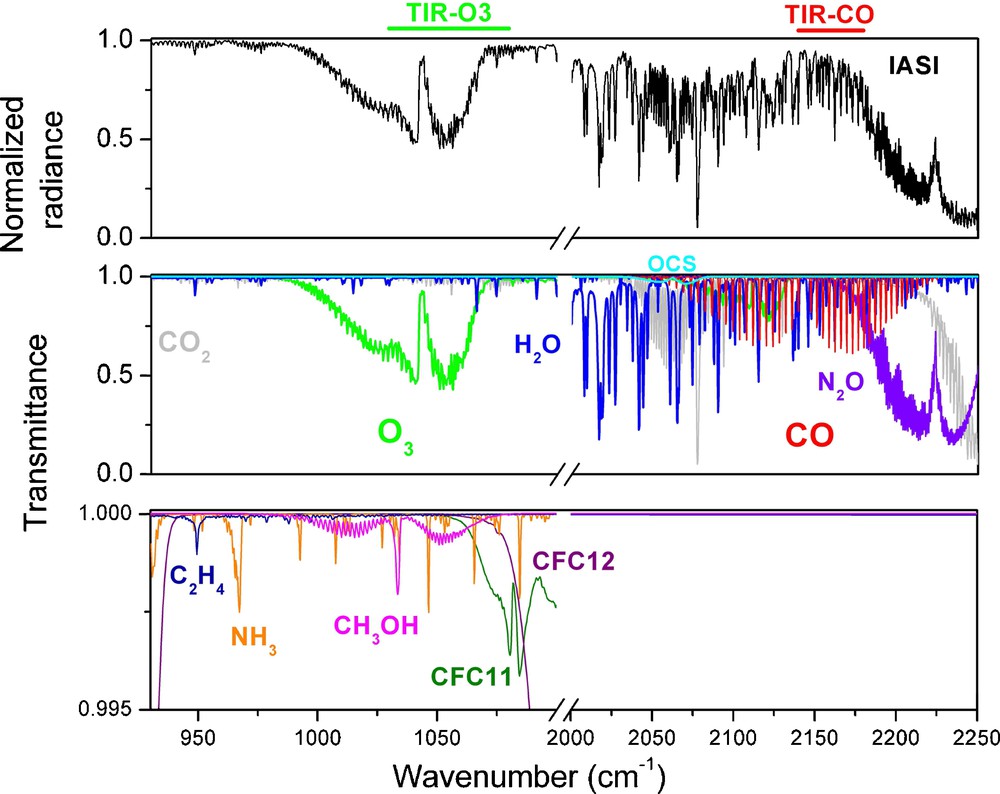
IASI normalized radiance spectrum and simulated molecular contributions, in transmittance units. The ozone and CO absorption bands are highlighted.
Spectre en radiance normalisé, mesuré par IASI, avec les contributions simulées pour différentes molécules, en unité de transmittance. Les bandes d’absorption de l’ozone et du CO sont signalées par les traits vert et rouge respectivement, en haut du graphe.
Health regulations in Europe, USA and other parts of the world set alert and threshold levels for pollutants like ozone (O3), nitrogen dioxide (NO2), fine particles (particulate matter, PM), carbon monoxide (CO), and sulphur dioxide (SO2). Among these pollutants, CO, ozone and SO2 can be monitored by infrared remote sensing. SO2 has a weak signature in the TIR spectral range, and its detection is possible only in the case of volcanic eruptions that generate high levels of SO2 downwind of the eruption event. There are currently four spaceborne thermal IR instruments providing nadir measurements from polar-orbiting satellites. Three of them are carried onboard of the EOS-US platforms: MOPITT/TERRA (launched at the end of 1999), AIRS/AQUA (launched in 2002), and TES/AURA (launched in 2004). Each of these missions has its specificity as they all address different primary goals. With the launch of IASI/MetOp in October 2006, Europe also has an atmospheric sounder dedicated to tropospheric soundings, both for meteorology and atmospheric chemistry needs.
Thermal IR instruments measure total columns or low vertical resolution profiles, the accuracy and the vertical sensitivity of which significantly depend on the instrument specifications (spectral resolution and radiometric noise), as well as on environment conditions (ground temperature, land or sea, Earth's emissivity). The possibility to detect enhanced levels of concentration for any pollutant in the boundary layer is limited by the low thermal contrast in temperature between the surface and the first layer of the atmosphere. The capability of an infrared nadir sounder to probe the lower atmospheric layers, where local pollution occurs, therefore strongly depends on location, temperature, type of surface and time of the day. Generally, TIR instruments have higher sensitivity in the free troposphere, and have limited sensitivity near the surface, with exceptions in case of high thermal contrast scenes.
In the following sections, after a short description of the IASI mission, we provide three illustrations of operational applications that are being developed using the near real time observations of atmospheric composition by the IASI mission.
3 The IASI/MetOp mission
The Infrared Atmospheric Sounding Interferometer (IASI), was launched in 2006 onboard the METOP-A satellite. This is the first European meteorological polar-orbiting satellite, the second and third instruments will be mounted on the METOP-B and C satellites with launches scheduled in 2010 and 2015. It is a joint undertaking of the French spatial agency Centre national d’études spatiales (CNES) and EUMETSAT, with CNES managing the instrumental development part and EUMETSAT operating the instrument in orbit. This meteorological platform is the space segment of the EUMETSAT Polar System (EPS).
IASI provides accurate measurements of temperature profiles in the troposphere and lower stratosphere, as well as moisture profiles in the troposphere in order to improve the quality of numerical weather forecasts (Schlüssel et al., 2005). IASI also monitors some of the chemical components, which play a key role in climate monitoring, global change and atmospheric chemistry: e.g. CO2, CH4, CO, O3, NH3, HNO3 (Crevoisier et al., 2009; Boynard et al., 2009; Clerbaux et al., 2007; Clerbaux et al., 2009; Coheur et al., 2009; George et al., 2009; Razavi et al., 2009; Turquety, 2004; Wespes et al., 2009). The IASI mission delivers more than 1,200,000 observations per day.The MetOp polar orbit is at an altitude of around 817 km. The satellite is slightly tilted at a 98.7° inclination to the equator, and the Earth pass beneath the satellite ground track is at 09:30 in the morning. The time to complete an orbit is about 101 minutes, which implies that MetOp makes a little more than 14 revolutions a day. IASI has a squared field of view, sampled by a matrix of 2 × 2 circular pixels (each with a diameter of 12 km). Measurements are taken every 50 km at nadir with an excellent horizontal coverage due to its ability to scan across track over a swath width of 2200 km.
The instrument consists of a Fourier Transform spectrometer associated with an imaging system, designed to measure the infrared spectrum emitted by the Earth in the TIR using nadir geometry. The instrument provides spectra of high radiometric quality at 0.5 cm-1 resolution (apodized), from 645 to 2760 cm-1.
4 Three examples of operational applications using IASI/MetOp data
4.1 Measurement of regional ozone to improve air quality forecast
4.1.1 Measurement of ozone
Tropospheric ozone is generated from chemical reactions linked to car traffic and power plants. Automobile and industrial emissions release nitrogen oxide gases (NOx) and volatile organic compounds (VOC) that are by-products of burning gasoline and coal. NOx and VOC combine chemically with oxygen to form ozone during the sunny, high-temperature conditions of late spring, summer and early fall. High levels of ozone are usually encountered in the heat of the middle of the day, and dissipate during the cooler nights.
The most prominent band for ozone in the TIR is at 9.7 μm. It extends from 980 to 1100 cm-1 (see Fig. 2). It is only weakly perturbed by other absorption features of H2O and CO2. Previous experience has demonstrated that the TIR measurements provide information on the ozone vertical profile from the ground up to an altitude of about 40 km (Coheur et al., 2005), with a maximum sensitivity located in the mid-troposphere. The tropospheric column is typically measured with 10% accuracy.
4.1.2 Summer 2007 pollution in SW Europe
Summer 2007 in Europe was unusual, with wet and cold conditions in NW Europe along with extreme and persistent heat in SE Europe (see Fig. 3). The meteorological situation during the 14th to 21st July period was characterised by long-lasting wide areas of high air pressure spread over continental Europe. Pollution episodes, which exceeded the information threshold limits, were observed in northern Italy and at several locations in Austria, Romania and around the Mediterranean.
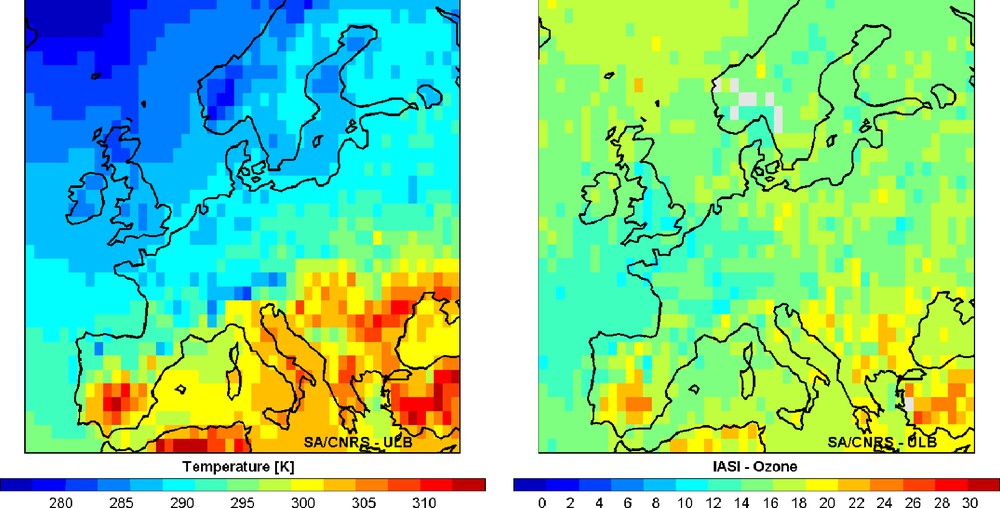
Correlation between increased temperatures (surface level, K) and ozone mixing ratios (0–6 km column, Dobson Units) as observed by IASI/MetOp during 22 to 26 July 2007, over Europe.
Corrélation entre les fortes températures (au niveau de la surface, en Kelvin) et les rapports de mélange d’ozone (pour la colonne 0–6 km, en unités Dobson) observés par IASI/MetOp du 22 au 26 juillet 2007, au-dessus de l’Europe.
Fig. 3 illustrates the impact of this exceptional atmospheric situation, which led to the increased formation of tropospheric ozone in southern parts of Europe. A further analysis of this pollution event with the IASI data is provided in Eremenko et al., 2008. It is a first step in using infrared satellite observations to monitor tropospheric ozone and to improve the forecasts of air quality and climate models.
4.2 Monitoring of CO related to fire events
4.2.1 Measurement of CO
Carbon monoxide is a primary pollutant produced from vegetation burning (for agricultural purposes or from wildfires). Other emission sources include fossil fuel combustion (associated with car traffic, industry and domestic heating) as well as methane and non-methane hydrocarbon oxidation. Its primary sink is oxidation by the hydroxyl radical (OH), which in turn controls the removal of most of the atmospheric pollutants as it is usually the predominant atmospheric oxidant. The CO atmospheric lifetime ranges from a few weeks to a few months depending on location and season, making it particularly suitable as a tracer of pollutant emissions. As result of its relatively long lifetime, it undergoes long-range transport from its sources and mixes both horizontally and vertically.
Carbon monoxide absorbs infrared radiation mainly in its 1-0 vibrational band, centred near 2140 cm-1 (see Fig. 2). The spectral region, which extends from 2020 to 2250 cm-1, has interferences from lines of H2O, CO2, N2O, OCS and O3. Current TIR sounders provide CO vertical profiles in the troposphere, depending on the sounder. The CO tropospheric column is usually measured with 10 % accuracy or better from TIR, and with a maximum of 2 independent pieces of information on the vertical.
4.2.2 Greek fires in summer 2008
The southern European and the Mediterranean basin are regularly affected by forest fires, which can burn thousands of hectares in a few days. The 2007 fire season was devastating for the southern part of Europe. Greece was the most affected country in terms of burned areas and injuries. More than 3000 km2 were burned, more than half of this total in the Peloponnese at the end of August 2007 (EFFIS, 2007), destroying several protected natural sites, thousands of buildings and killing 63 people. Although the number of fires was similar to previous years, the severity of the burning events was much larger due to several heat waves in the preceding weeks, extended droughts and strong winds.
A detailed analysis of the regional impact of the record-breaking fires which devastated thousands of square kilometers of forest in Greece during the last week (23–30) of August 2007 is reported in Turquety et al., 2009. Large CO plumes were observed above the Mediterranean basin and North Africa, with CO total columns exceeding 30 molecules/cm2 and volume mixing ratio up to 22 ppmv (see Fig. 4). Using the integrated total amount, the increase in CO burden due to these fires is estimated to be 0.327 Tg, ∼40% of the total annual anthropogenic emissions in Greece.

Top panel: SEVIRI visible image of the smoke associated with the Greek fires, on August 25, 2007. Image courtesy: EUMETSAT – METLook project L. Gonzalez, C. Deroo (LOA-USTL). Bottom panel: IASI/MetOp CO measurements associated with Greek fires, on August 25, 2007.
En haut : image de la fumée lors des feux en Grèce prise dans le visible par SEVIRI, le 25 août 2007. Crédit : EUMETSAT – METLook project, L. Gonzalez, C. Deroo (LOA-USTL). En bas : mesures de CO de IASI/MetOp lors des feux en Grèce, le 25 août 2007.
4.3 Early detection of SO2 from volcanic plumes for aviation hazard mitigation
4.3.1 SO2 emission from volcano
Volcanoes are an important source of atmospheric trace gases and particles. Eruptive events emit, in addition to large amounts of ash, a gaseous plume high into the troposphere or even the stratosphere. Mostly contained within a thin layer (typically 1 km thick or less), the plume is mainly composed of water vapour, carbon dioxide, sulphur dioxide and halogen species. It is transported away from its emission source following the main wind fields in the troposphere or the upper troposphere/lower stratosphere. During transport, chemistry modifies the composition of the plume, in particular sulphur dioxide, which is progressively transformed into sulphuric acid particles. Volcanic emissions pose a risk for populations living close to volcanically active regions and for air traffic as aircraft engines can be damaged by both ash and sulphuric acid. Therefore, rapid detection of volcanic emissions and prediction of their transport pathways is of high interest.
SO2 absorbs thermal IR radiation in the υ1 band around 1150 cm-1, the υ3 band around 1350 cm-1, and the υ1 + υ3 band around 2500 cm-1. The υ3 band is the most prominent but lies in a range where strong absorptions by methane and water vapour occur (Clarisse et al., 2008; Clerbaux et al., 2008).
4.3.2 Eruption of Kasatochi volcano
The eruption of Kasatochi volcano on 7th August 2008 is a good example on how satellite measurements can provide valuable information on an eruption posing a danger to aviation, as in the region of the Aleutian Island chain the density of volcanoes is very high but most of these volcanoes are not regularly monitored. Three major eruptions emitted large amounts of volcanic ash and gas into the atmosphere that rose to a height of at least 10 km, an altitude where they are a major hazard to aircraft. The eruption of Kasatochi volcano caused 44 Alaska Airline flights to be cancelled between Anchorage and the US West Coast leaving about 6000 passengers stranded. Flights from other US airlines had to be cancelled or diverted as well (Rix et al., 2009).
From the analysis of IASI near real time data low resolution SO2 profiles can be obtained, adding information on the altitude of the ejection. Based on the IASI SO2 retrieval system ULB is running in near-real time an SO2 alert system since November 2008. The alerts are sent out by email and complemented by images directly available on the web (http://cpm-ws4.ulb.ac.be/Alerts/index.php). As the retrieval technique is negligibly affected by SO2 in the boundary layer (e.g. pollution or passive degassing of volcanoes), it is an ideal tool to be used for aviation hazard mitigation. As an illustration, Fig. 5 gives a 10-day integrated view of the SO2 flag after the eruption of Kasatochi as seen using the IASI observations.
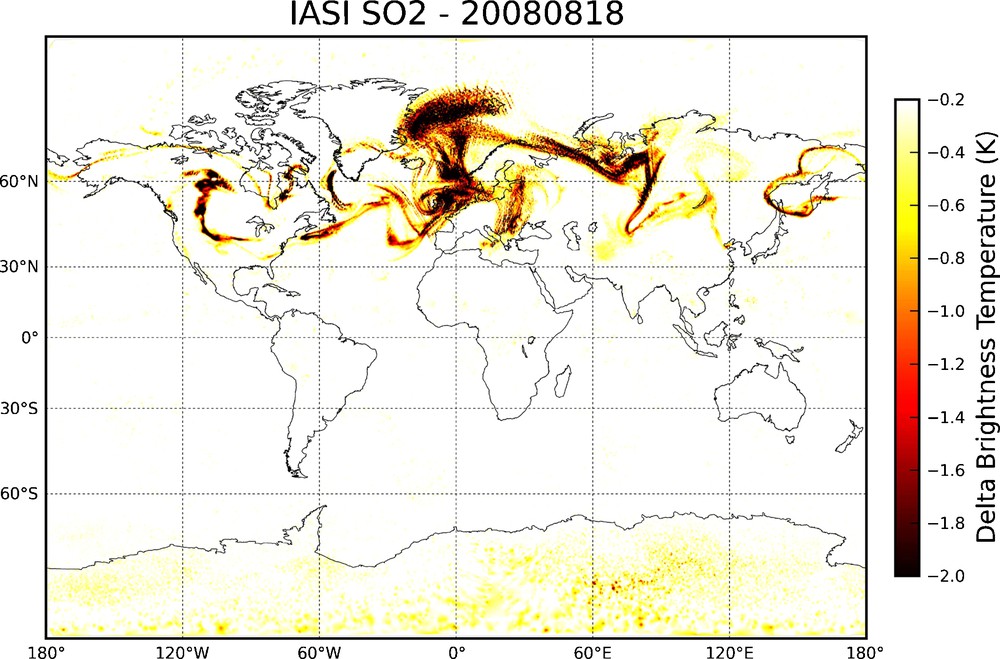
SO2 volcanic plume 10 days after the eruption of the Kasatochi volcano in the Aleutian Island chain (August 7, 2008).
Panache de SO2 volcanique observé dix jours après l’éruption du volcan Kasatochi (le 7 août 2008) dans la chaîne des îles Aléoutiennes.
5 Conclusion and perspective
Measurement of air quality from space is challenging, and none of the instruments that are currently in orbit are able to measure the concentrations of the main pollutants simultaneously and follow their diurnal variations. TIR sensors onboard polar orbiting satellites, such as the recently launched IASI/MetOp, provide global observations two times per day but with limited information on the vertical, in particular in the boundary layer. Nevertheless, the availability of data in near real time makes them valuable input to help for detection and prediction of pollution episodes.
The IASI TIR instrument, that delivers 1,200,000 observations per day, together with the GOME-2 instrument onboard the same platform, will provide measurements of the climate and pollution gases in near real time for 15 years. Operational applications as part of the space component of Global Monitoring for Environment and Security (GMES) are foreseen. In this paper, we have illustrated the IASI observation of increased ozone in the southern part of Europe during the heat wave in July 2007, the long range transport of CO associated with Greek fires in August 2007, and the sulphur dioxide contamination following a volcanic eruption in August 2008.
Acknowledgments
IASI has been developed and built under the responsibility of the Centre national d’études spatiales (CNES, France). The IASI L1 data are received through the EUMETCast near real time data distribution service. The authors acknowledge the Ether French atmospheric database (http://ether.ipsl.jussieu.fr) for providing the IASI L1C data. C. Clerbaux and S. Turquety are grateful to CNES for financial support. The research in Belgium was funded by the “Actions de Recherche Concertées” (Communauté Française), the Fonds National de la Recherche Scientifique (FRS-FNRS F.4511.08), the Belgian State Federal Office for Scientific, Technical and Cultural Affairs and the European Space Agency (ESA-Prodex C90-327). We are grateful to Maya George (F), Anne Boynard (F), Juliette Hadji-Lazaro (F), Daniel Hurtmans (B) and Lieven Clarisse (B) for their help.