

1 Introduction
All short- and long-lived source and greenhouse gases emitted at the surface and responsible for ozone depletion and climate change in the stratosphere are transported to higher altitude in the tropics. The generally accepted view of troposphere to stratosphere transport (TST) is that of a fast convective uplift from the surface to the level of maximum outflow of the Hadley cell at about 13 km (Gettelman et al., 2002), from where air is ascending slowly at 0.2–0.3 mm/s by radiative heating (Gettelman et al., 2004; Corti et al., 2005) to the bottom of the lower stratosphere, from where it is further distributed at the global scale by the Brewer–Dobson circulation (Holton et al., 1995). The layer between outflow level around 14 km and the maximum altitude of convective detrainment, thus sharing tropospheric and stratospheric characteristics, is called the Tropical Tropopause Layer, TTL (Fueglistaler et al., 2008; Highwood and Hoskins, 1998). Given the 6 months required for crossing the TTL if this scheme is correct, all short-lived chemically active species, i.e. NOx, Bry, Iy and CO will be deactivated and the air dehydrated at saturation ratio corresponding to the temperature of the tropopause, before reaching the stratosphere.
Competing with this scheme is the fast overshooting of adiabatically cooled air proposed by Danielsen (1982), associated with deep continental convective systems that is the injection of tropospheric air well above the tropopause, followed by mixing with stratospheric air. Although the existence of such events is recognised, they are generally assumed to be rare and therefore their contribution insignificant at the global scale. However, if this is likely true above oceanic regions where most high altitude aircraft and sondes observations have been made available, there are now many indications from recent European balloon and high altitude aircraft campaigns, HIBISCUS (Pommereau et al., 2007) and TROCCINOX (Chaboureau et al., 2007) in Brazil, SCOUT-O3 in Northern Australia (Brunner et al., 2009) and SCOUT-AMMA in West Africa (Cairo et al., 2009), of frequent deep penetration in the stratosphere above intense and fast developing land convective systems.
The objective of this paper is to summarize the recent progress made in the understanding of overshooting over tropical land, of water transport across the tropopause and finally, on the contribution of these events to TST at the global scale.
2 Convective overshooting over land
The idea promoted by Danielsen (1982) and further demonstrated by in situ measurements carried from the NASA ER-2 high-altitude aircraft during a STEP campaign in 1987 in Northern Australia (Danielsen, 1993), is that of a fast updraft by kinetic energy of adiabatically cooled air at 50 m/s velocity in the penetrating cloud turrets above continental regions (Fig. 1).

Left: schematic of energetic updraft of adiabatically cooled air by convective overshooting proposed by Danielsen (1982). Right: picture of a cumulo-nimbus penetrating turret taken from an aircraft over the continental US (Fujita, 1992).
Gauche : schéma d’un overshoot convectif au travers de la tropopause d’air refroidi par détente adiabatique, proposé par Danielsen (1982). Droite : photographie par avion aux États-Unis d’une tourelle convective au sommet d’un cumulo-nimbus (Fujita, 1992).
Although the occurrence of such events, also forming for example in the summer over the continental US (Fujita, 1992), is unambiguous, little progress was made in the understanding of their frequency and their geographical distribution until the measurements from orbit of the precipitation radar (PR) carried onboard the NASA Tropical Rainfall Measuring Mission (TRMM). These observations analysed by (Liu and Zipser, 2005) were showing that overshooting features (OPFs) were concentrated over land tropical areas during the summer season and quite frequent since they could be seen in about 0.5–1.5% of the observations (Fig. 2). Another essential information provided by the TRMM PR was that of the contrast between oceanic and land OPFs (Fig. 3), the last displaying a strong maximum between 15–18 h local illustrating the difference of nature between continental and oceanic convection.
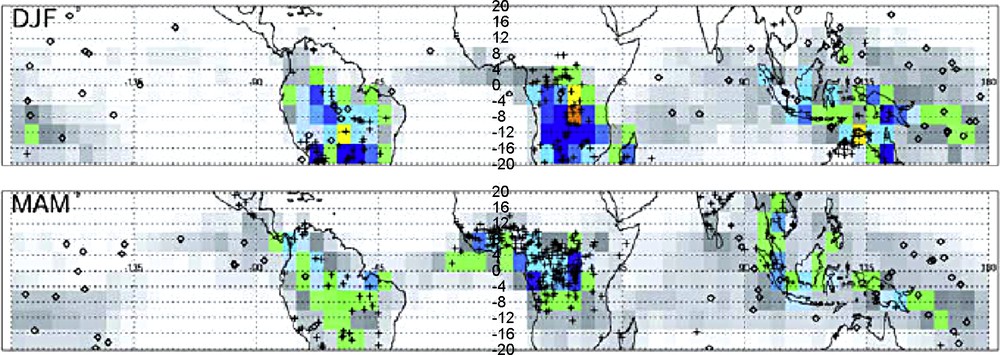
Frequency of overshooting features (OPFs) observed by the TRMM PR radar above 14 km during austral (top) and boreal (bottom) summer (Liu and Zipser, 2005). The frequency of occurrence varies from 0.1% (light grey), to 0.5% (green), 1% (yellow) and 1.5% (orange).
Fréquence d’apparition de signatures d’overshoots au-dessus de 14 km dans les observation du radar de précipitation du satellite Tropical Rainfall Measuring Mission (TRMM) en été austral (haut) et boréal (bas) (Liu and Zipser, 2005). La fréquence varie entre 0,1 % (gris clair), 0,5 % (vert), 1 % (jaune) et 1,5 % (orange).
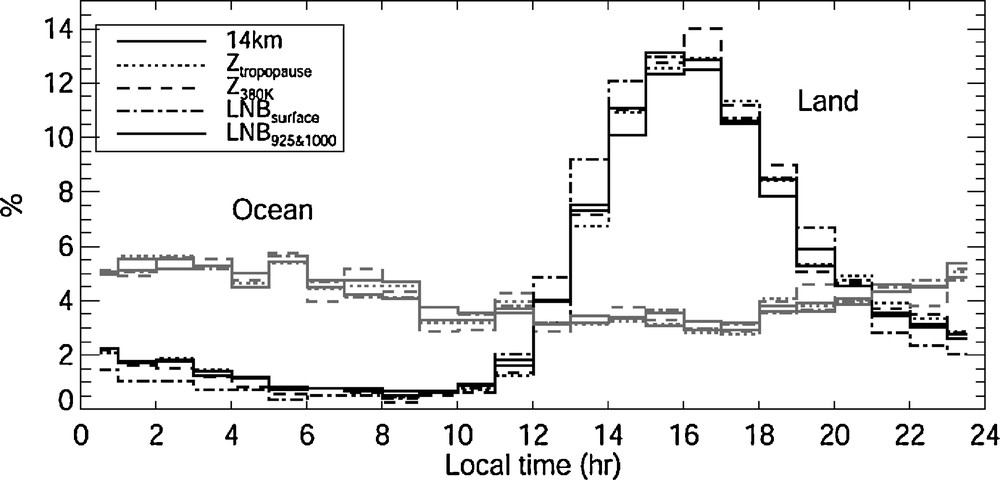
Diurnal evolution of OPFs over oceanic and land areas, selected following various criteria: above 14 km, the tropopause, 380 K, or two calculations of Level of Neutral Buoyancy (Liu and Zipser, 2005).
Cycle diurne des signatures d’overshoots au-dessus des océans et des continents sélectionnés suivant différents critères : altitude supérieure à 14 km, à celle de la tropopause, à une température potentielle de 380 K ou encore à deux calculs de niveau d’équilibre de flottabilité (Liu and Zipser, 2005).
3 Impact on the thermal structure and the chemical composition of the TTL
Among new information provided by the recent European research projects is the impact of overshooting on the thermal structure of the TTL and the lower stratosphere. From a series of four daily radiosondes and C-band radar observations during the HIBISCUS campaign in Bauru in Southern Brazil in February 2004 (Fig. 4), it has been shown that the updraft of adiabatically cooled tropospheric air associated to the highest cloud tops in the afternoon results in a systematic cooling above the tropopause followed by mixing with warmer stratospheric air. In case of intense convection it was shown that the cooling could reach an average 4 °C amplitude (Pommereau and Held, 2007).
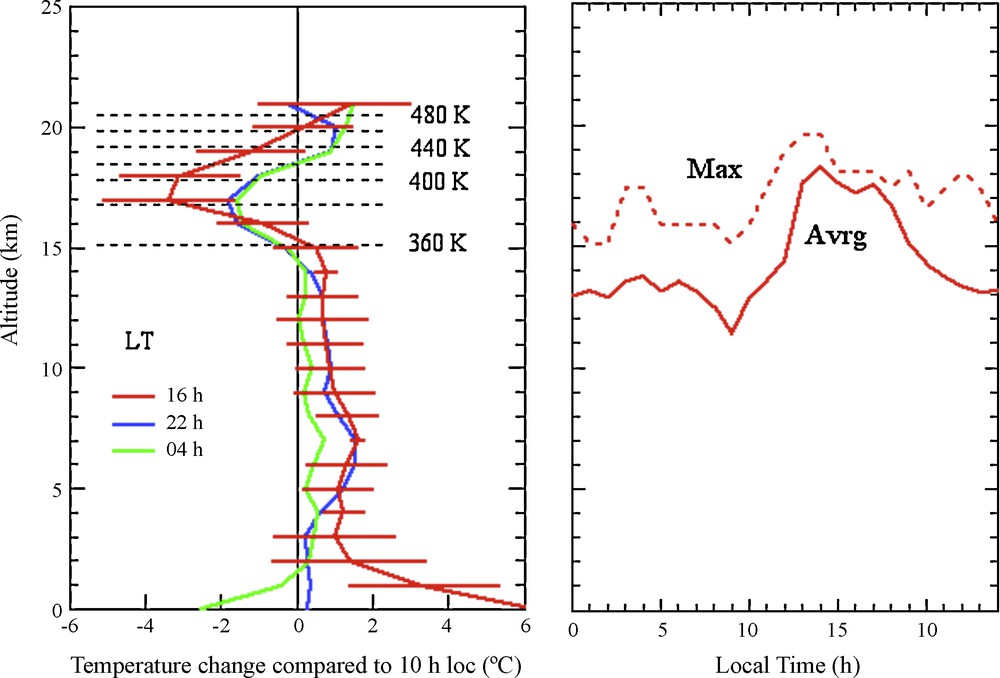
Left: change of temperature between 16 h, 22 h and 04 h local compared to 10 h during intense convective days in Bauru in Southern Brazil during the HIBISCUS campaign. Right: diurnal variation of average and maximum cloud top height during the same days observed by the C-band radar of the Instituto de Pesquisas Meteorologicas in Bauru (Pommereau and Held, 2007).
Gauche : variation de température entre 16 h, 22 h et 04 h locales par rapport à 10 h du matin, au cours des jours de convection intense à Bauru dans le Sud du Brésil, durant la campagne HIHISCUS. Droite : variation diurne de l’altitude moyenne et maximale du sommet des nuages durant la même période observée par un radar en bande-C de l’Instituto de Pesquisas Meteorologicas de Bauru (Pommereau and Held, 2007).
The existence of such afternoon cooling above the tropopause associated to overshooting over tropical land is confirmed by the measurements of the series of 4 or 8 daily radio-sondes of the Atmospheric Radiation Measurements station (ARM) in Niamey in Niger during the AMMA campaign in July–August 2006. Indeed a systematic minimum temperature is observed at 18 h at 80 hPa (18 km) in the TTL (Fig. 5) at the time of the maximum Convective Available Potential Energy (CAPE) due to solar heating at the surface (Cairo et al., 2009). But most important conclusion provided by these findings is the unambiguous demonstration of occurrence of fast convective updraft of tropospheric short- and long-lived chemical species up to 19–20 km modifying the composition of the lower stratosphere.
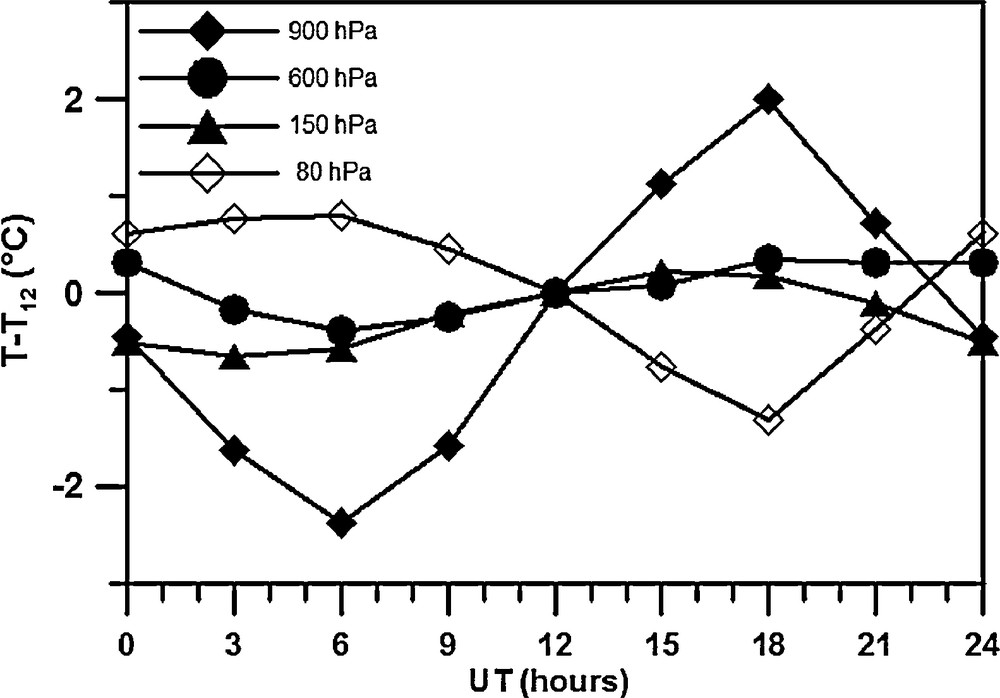
Average diurnal temperature change at 900, 600, 150 and 80 hPa compared to noontime from the 4 ARM daily soundings in Niamey from 1st July to 31st August 2006, reinforced to 8 per day between 1st–15th August (Cairo et al., 2009).
Variation diurne de température à 900, 600, 150 et 80 hPa en référence à midi entre le 1er Juillet et le 31 Août 2006, déduite des quatre sondages quotidiens pratiqués par la station américaine Atmospheric Radiation Measurements durant la campagne AMMA à Niamey, renforcés à 8 par jour entre le 1er et le 15 Août (Cairo et al., 2009).
4 Hydration or dehydration of the lower stratosphere?
Although tropospheric air is wet in warm rainy regions, convective updrafts are not expected to hydrate but to dehydrate the lower stratosphere. This is because of the condensation of water vapour at the low temperature of the tropopause followed by the rapid fall-out of the condensates, the basic dehydration process incorporated in all simulations of water vapour in the lower stratosphere (James et al., 2008). But the existence of this process, called Cold Trap after Danielsen (1982), is not supported by the balloon and high altitude aircraft measurements carried out during the European campaigns. Instead it was found that overshoots are resulting in fast updrafts of ice particles (Fig. 6) well above the tropopause, which after sublimation result in the moistening of the lower stratosphere and not the opposite. Remarkably, no cold trap episodes were observed during these campaigns, either over Brazil, Northern Australia or Africa.
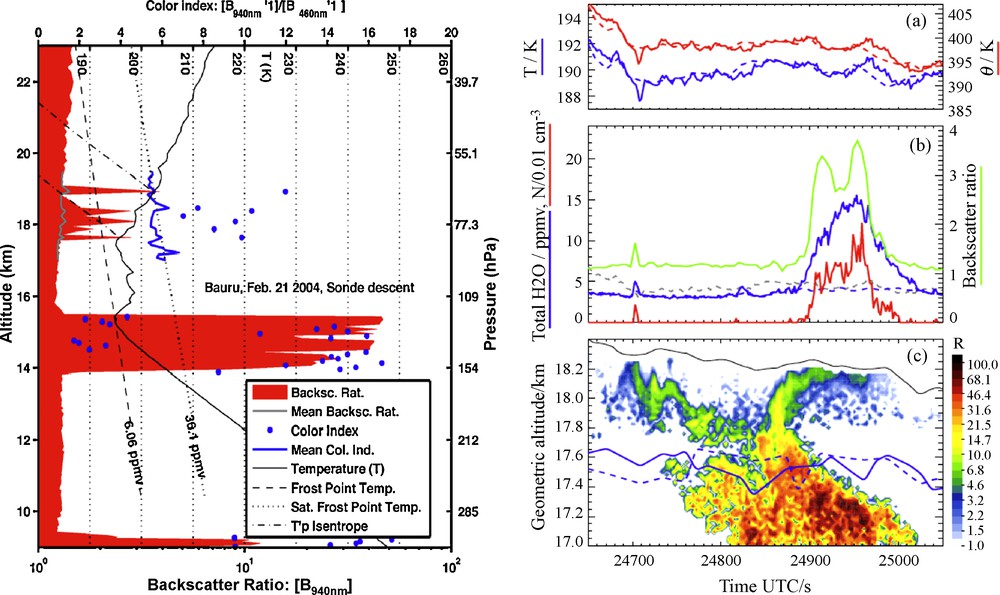
Left: Backscatter ratio (red filled), colour index 940/480 nm (blue dots), temperature (black thin line) and frost point temperature (dashed) observed by a BKS sonde during HIBISCUS in Brazil. Ice particles were reported between 17.5 and 19 km above a thick anvil topping to around the tropopause (Neilsen et al., 2007). Right: M-55 Geophysica high altitude aircraft observations over the Hector convective system developing each afternoon over the Tivi Islands during the SCOUT-O3 campaign in Northern Australia. From top to bottom: (a) temperature (blue) and potential temperature (red), (b) total water (solid blue) and gas phase water vapour (dashed blue), water vapour saturation ratio over ice (dashed grey), and number density of particles of r > 0.25 (green); (c) backscatter ratio from the downward looking lidar (colour-coded) from the aircraft altitude (black). Blue solid and dashed lines are showing the altitude of the 380 K level and the cold point tropopause (Corti et al., 2008). Masquer
Left: Backscatter ratio (red filled), colour index 940/480 nm (blue dots), temperature (black thin line) and frost point temperature (dashed) observed by a BKS sonde during HIBISCUS in Brazil. Ice particles were reported between 17.5 and 19 km above a thick anvil topping ... Lire la suite
Gauche : Rapport de rétrodiffusion (rouge plein), indice de couleur 940/480 nm (points bleus), température (trait noir) et point de givre (tirets), observés par une sonde BKS au Brésil durant la campagne HIBISCUS. Des cristaux de glace apparaissent entre 17,5 et 19 km au-dessus d’une épaisse enclume orageuse proche de la tropopause (Neilsen et al., 2007). Droite : mesures à haute altitude effectuées par l’avion M-55 Geophysica durant la campagne SCOUT au-dessus du cumulo-nimbus Hector qui se développe chaque après-midi au-dessus des îles Tivi, au nord de Darwin en Australie. De haut en bas : (a) température (bleu) et température potentielle (rouge) ; (b) eau totale (bleu), vapeur d’eau (tiretés bleus), saturation par rapport à la glace (tiretés gris), et densité de particules de diamètre supérieur à 0,25 μm (vert) ; (c) rapport de rétrodiffusion d’un lidar orienté au nadir (code couleur) et altitude de l’avion (trait noir). Les lignes bleues et tiretées représentent l’altitude du niveau 380 K et celui de la tropopause (Corti et al., 2008). Masquer
Gauche : Rapport de rétrodiffusion (rouge plein), indice de couleur 940/480 nm (points bleus), température (trait noir) et point de givre (tirets), observés par une sonde BKS au Brésil durant la campagne HIBISCUS. Des cristaux de glace apparaissent entre 17,5 et 19 km au-dessus ... Lire la suite
The link between these geyser-like injections of ice crystals, the presence of overshoots upwind and the hydration of the lower stratosphere have been further demonstrated by simultaneous measurements of water vapour and ice particles (Lyman alpha hygrometer and BKS sonde on the same balloon) together with C-band radar observations (Fig. 7) in Niamey during the SCOUT-AMMA campaign in August 2006 (Khaykin et al., 2009).
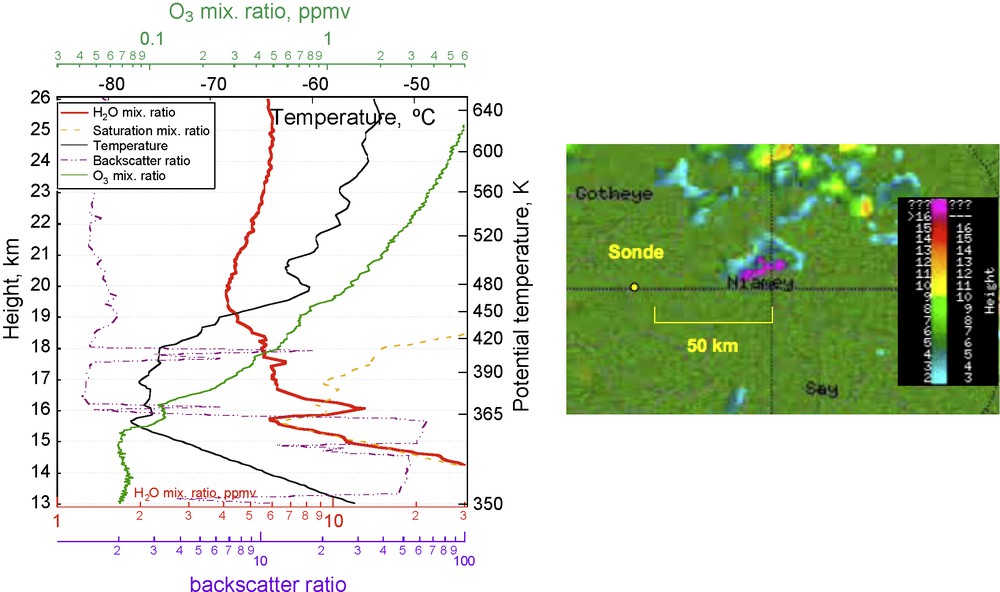
Left: water vapour (solid red), temperature (black), backscatter ratio (dashed purple) and ozone (green) from a sonde flown on 23rd August 2006 in Niamey. Right: cloud top altitude reported by the C-band radar of the Massachusetts Institute of Technology also in Niamey. Water vapour enhancements, ice particles and ozone dips are observed at the same altitude 30–60 min downwind a high convective cell seen by the radar. The hydration of the lower stratosphere results in an uplift of the hygropause around 20 km during the warm tropopause summer season (Khaykin et al., 2009). Masquer
Left: water vapour (solid red), temperature (black), backscatter ratio (dashed purple) and ozone (green) from a sonde flown on 23rd August 2006 in Niamey. Right: cloud top altitude reported by the C-band radar of the Massachusetts Institute of Technology also in ... Lire la suite
Gauche : vapeur d’eau (ligne rouge), température (ligne noire), rapport de rétrodiffusion (tiretés mauves), et ozone (vert) mesurés par une sonde lancée le 23 Août 2006 à Niamey. Droite: altitude du sommet des nuages observée par un radar en bande-C du Massachusetts Institute of Technology également à Niamey. Des pics de vapeur d’eau et de particules de glace et des creux d’ozone coïncidant en altitude apparaissent 30 à 60 min sous le vent d’une intense cellule convective observée par le radar. L’hydratation résultant de cette injection dans la basse stratosphère entraîne un soulèvement de l’hygropause, l’altitude du minimum de vapeur d’eau, vers 20 km durant la saison d’été où la température de la tropopause est la plus élevée (Khaykin et al., 2009). Masquer
Gauche : vapeur d’eau (ligne rouge), température (ligne noire), rapport de rétrodiffusion (tiretés mauves), et ozone (vert) mesurés par une sonde lancée le 23 Août 2006 à Niamey. Droite: altitude du sommet des nuages observée par un radar en bande-C du Massachusetts Institute of ... Lire la suite
5 Can stratosphere moistening be captured by models?
Overshooting episodes are obviously of limited extent in space and time and therefore cannot be captured by current global- or even meso-scale simulations. Small scale Cloud Resolving Models (CRM) and moreover in 3-D configuration are required. Fig. 8 illustrates the results of two such attempts for explaining the presence of ice crystals observed by the HIBISCUS and TROCCINOX balloons and aircraft in Brazil in 2004 and 2005, (Grovesnor et al., 2007 ; Chaboureau et al., 2007). In both cases, deep injections of ice crystals up to 18–20 km at 40–80 m/s vertical velocity were successfully captured over overshooting cells of 5–10 km diameter and 10–20 min maximum duration, leading to water updrafts of several tons/s, which after sublimation are moistening the stratosphere.

Left: Cross-section of water vapour mixing ratio field (colour code, red = 20 ppm) after 35 min time of 3-D simulation of 2 km horizontal resolution of an overshooting event in Brazil with the Large Eddy Model (LEM) of the UK Met Office. The white contours indicate the total ice mixing ratio (ice + snow + graupel) in ppmv × 10−3 (Grovesnor et al. 2007). Right: cross section of the total water mixing ratio (g kg−1) at 15:10, 15:20, 15:30, 15:40 15:50, and 16:00 LT over the region overflown by the M-55 Geophysica in Brazil on 4th February 2005 simulated with the Meso-NH model with an horizontal grid of 625 m. Black lines are the stream functions along the cross-section. Grey contours represent potential temperatures (intervals 310, 330, 350, 370, 410, 450, and 500 K). The red line delineates the cloud limit with condensed water mixing ratio larger than 10−3 kg kg−1. The vertical axis range is 0–22 km and the horizontal axis 0–30 km (Chaboureau et al., 2007). Masquer
Left: Cross-section of water vapour mixing ratio field (colour code, red = 20 ppm) after 35 min time of 3-D simulation of 2 km horizontal resolution of an overshooting event in Brazil with the Large Eddy Model (LEM) of the UK Met Office. The white ... Lire la suite
Gauche : coupe de distribution de vapeur d’eau (rouge = 20 ppm) après 35 minutes de simulation à 3 dimensions, à 2 km de résolution horizontale d’un overshoot au Brésil à l’aide du Large Eddy Model (LEM) de l’UK Met Office. Les contours blancs représentent le rapport de mélange d’eau totale (glace, neige, grésil) en ppm × 10−3 (Grovesnor et al. 2007). Droite : coupe de rapport de mélange d’eau totale (g kg−1) à 15:10, 15:20, 15:30, 15:40 15:50, et 16:00, locales dans la région survolée par le M-55 Geophysica au Brésil le 4 Février 2005, simulée par le modèle Meso-NH à 625 m de résolution horizontale. Les lignes noires représentent les fonctions de courant et les lignes grises les températures potentielles (310, 330, 350, 370, 410, 450, et 500 K). Les limites du nuage (rapport de mélange d’eau condensée supérieur à 10−3 kg kg−1) sont indiquées par les lignes rouges. L’axe vertical est de 0–22 km et l’horizontal de 0–30 km (Chaboureau et al., 2007). Masquer
Gauche : coupe de distribution de vapeur d’eau (rouge = 20 ppm) après 35 minutes de simulation à 3 dimensions, à 2 km de résolution horizontale d’un overshoot au Brésil à l’aide du Large Eddy Model (LEM) de l’UK Met Office. Les contours blancs représentent le ... Lire la suite
6 Is it important at global scale?
The ability of individual cells for injecting tropospheric chemicals and water in the lower stratosphere is now largely demonstrated, a result to which recent European campaigns have contributed significantly. But still open is the question of how important is the contribution of overshooting over tropical land to TST at the global scale compared to diabatic heating. The answer highly depends on the total number and intensity of overshootings during a given period. Although a OPFs frequency of occurrence of 0.5–1.5% compared to the total number of observations is provided by TRMM precipitation radar, the total number of these is difficult to estimate. An alternate method proposed by Ricaud et al. (2007) is to look at the concentration of tropospheric long-lived species in the lower-stratosphere. As an example, Fig. 9 on the left shows the average concentration of N2O measured by the ODIN Sub-Millimeter Radiometer (SMR) in March-April-May 2002–2004 at 17 and 19 km and that interpolated at the 400 K level for removing the influence of tropopause height variations. A maximum concentration is observed over Africa, and, although less intense, over South America and the Indonesian Islands, suggesting faster vertical transport across the tropopause over land areas, at least during the season of maximum overshooting volume reported by TRMM. In a further study of the seasonal variation of the N2O profile in the tropics (Fig. 9, right), (Ricaud et al., 2009) have shown that the concentration of the species, oxidized in the stratosphere drops at altitude above 450 K (19 km) only, remaining close to its tropospheric value up to that level and dropping rapidly above 500 K (21 km). This is in contrast with model simulations (ECMWF residual vertical transport, known to be too fast in the stratosphere, or slower radiative heating calculations) displaying always a drop starting at the tropopause, that is a regular ascent above this level.
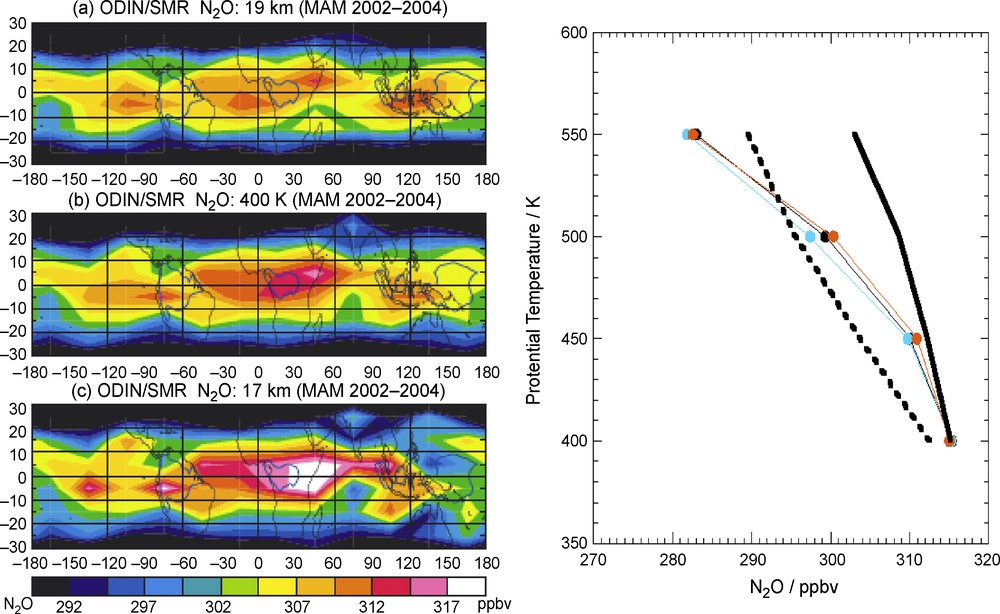
Left: average N2O mixing ratio at 19 km (top) and 17 km (bottom) observed by ODIN-SMR in MAM 2002–2004 and interpolated at 400 K (middle) (Ricaud et al., 2007). Right: N2O profile in the lower stratosphere during the most convective season in February (blue over Africa, red above the West Pacific, zonal mean in black) compared to Meteo-France Mocage simulations forced by ECMWF vertical velocity (solid line) and the Slimcat model of the University of Leeds forced by vertical velocity derived from radiative heating calculations (dashed line) (Ricaud et al., 2007). Masquer
Left: average N2O mixing ratio at 19 km (top) and 17 km (bottom) observed by ODIN-SMR in MAM 2002–2004 and interpolated at 400 K (middle) (Ricaud et al., 2007). Right: N2O profile in the lower stratosphere during the most convective season in February ... Lire la suite
Gauche : rapport de mélange moyen de N2O à 19 km (haut) et 17 km (bas) observé en MAM 2002–2004 par le ODIN-SMR, et interpolé à 400 K (milieu) (Ricaud et al., 2007). Droite : profil de N2O dans la basse stratosphère durant la saison la plus convective en Février (bleu Afrique, rouge Pacifique Ouest, noir moyenne zonale), comparés aux simulations Mocage de Météo-France forcées par les vitesses verticales du CEPMT (trait continu) et celles du modèle Slimcat de l’Université de Leeds forcées par des vents verticaux issus d’un calcul de transfert radiatif (tiretés) (Ricaud et al., 2007). Masquer
Gauche : rapport de mélange moyen de N2O à 19 km (haut) et 17 km (bas) observé en MAM 2002–2004 par le ODIN-SMR, et interpolé à 400 K (milieu) (Ricaud et al., 2007). Droite : profil de N2O dans la basse stratosphère durant la saison ... Lire la suite
Another recent study carrying information on troposphere-to-stratosphere transport very consistent with the above ideas is the picture of the evolution of stratospheric aerosols seen by the CALIPSO lidar since the beginning of the mission in June 2006 (Vernier et al., 2009). Shown in Fig. 10 are the volcanic plumes injected at 20 km by the eruption of the Soufrière Hills in the Caribbean in May 2006, and that of the Tavurvur in Papua New Guinea at 17 km in October, later transported at higher altitude in the stratosphere by the Brewer–Dobson circulation. But new in this picture, are the episodes of fast vertical transport of clear, washed-out, tropospheric air up to 19–20 km, particularly intense during the southern hemisphere summer season in February-March. The coincidence of these episodes with the season of maximum overshooting volume in the equatorial belt seen by the TRMM radar (Liu and Zipser, 2005), suggests that convective overshooting could be a major process of vertical transport at the global scale in the TTL. The maximum static stability around 19–20 km (450–480 K) shown by the stagnation of the Soufrière Hills plume at this level in 2006, as well as that of the clean aerosol-free air masses for several months after their injections, suggests a decoupling of the circulation between Holton's “lowermost stratosphere” and “overworld” (Holton et al., 1995), below and above the minimum-heating rate at 19–20 km (Corti et al., 2005). The observations would be compatible with a top Tropical Tropopause Layer (TTL), the upper level of the region of transition between the troposphere and the stratosphere, or the bottom of the “tropical pipe” above which the age of air increases rapidly, at about 20 km.

Evolution of the CALIPSO lidar aerosol scattering ratio in the tropical stratosphere since the beginning of the mission in June 2006 displaying clean air injections from the tropopause up to 20 km in January–March (Vernier et al., 2009).
Évolution du rapport de diffusion mesuré par le lidar aérosols du satellite CALIPSO depuis le début de la mission en juin 2006 montrant des injections rapides d’air clair depuis la tropopause jusqu’à 20 km en janvier–mars (Vernier et al., 2009).
7 Conclusions
The data collected from balloon, high altitude aircraft and satellites observations during the recent European HIBISCUS, TROCCINOX, SCOUT-O3 and AMMA campaigns over tropical land convective regions all suggest a significant, if not dominant, contribution of fast convective overshooting updrafts to troposphere-stratosphere transport compared to the slow rising by diabatic heating usually evoked. Ignored by meteorological and chemistry climate models, NWPs and CCMs, because of their limited size and duration and the difficulty of estimating their frequency during a given period, overshooting features may play a crucial role in the chemistry and climate of the lower stratosphere by injecting short-lived reactive chemicals, source and greenhouse gases as well as water in the region between the tropopause and the bottom of the Brewer–Dobson circulation at about 20 km. The anticipated increase of convection intensity after the warming of the surface layers, translating into a higher and cooler tropical tropopause as already observed during the last 20 years, might even reinforce the mechanism.
Acknowledgments
This work is the result of tight cooperation with a number of scientists and, asides from the General Direction of Research of the European Commission, of financial and operational support from a number of national agencies among which CNRS-INSU and CNES in France, IPMet in Brazil, IRD in Africa, AEB in Russia. They are all gratefully acknowledged.