

1 Structure and dynamics of the middle atmosphere
The region extending from about 10 to 90 km altitude is generally called the middle atmosphere. It is characterized by much drier air than in the lower atmosphere. It includes the stratosphere from 10 to 50 km, characterized by the presence of the ozone layer and a positive gradient of temperature corresponding to a strong vertical stability, and the mesosphere from 50 to 90 km with a negative temperature gradient (Fig. 1) and a weaker vertical stability. Consequently, the highest temperature in this altitude range is reached at the stratopause (around 50 km).
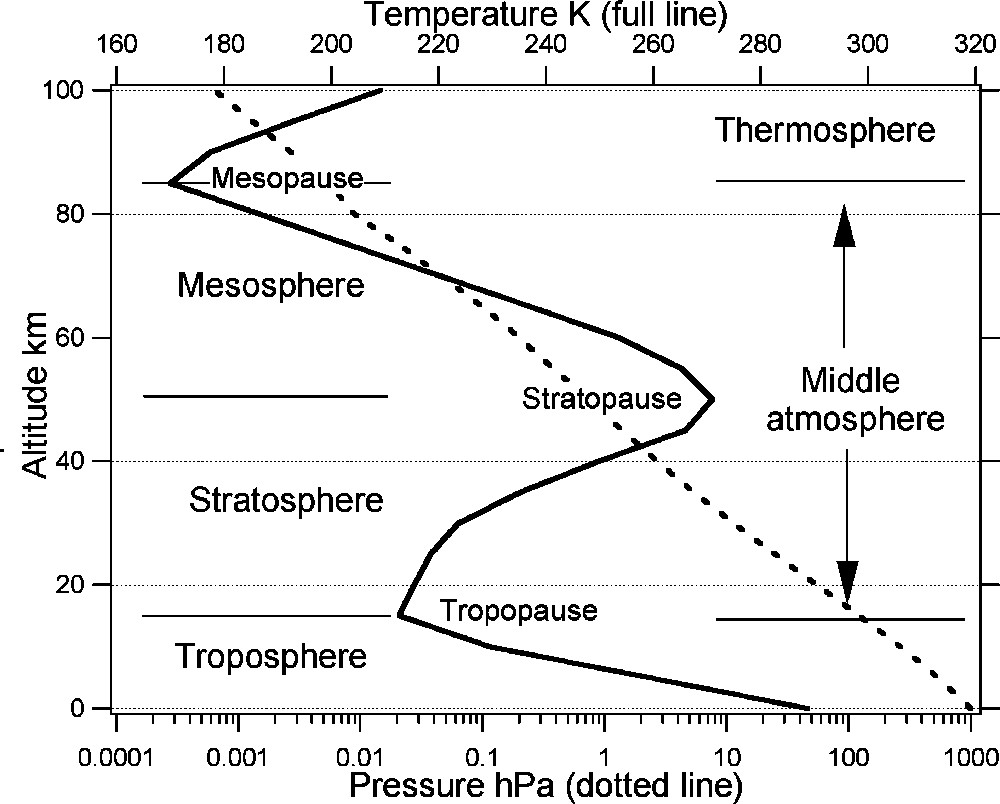
Schematic representation of the thermal and pressure structure of the atmosphere with its different layers.
Représentation schématique de la structure thermique et en pression de l’atmosphère, avec l’identification de ses différentes couches.
The vertical thermal structure of the middle atmosphere is controlled by the absorption of solar radiation by ozone, which is maximum at the stratopause. However, if one assumes that the thermal structure of the middle atmosphere is only controlled by radiative equilibrium, one obtains temperatures that are much too low at the winter pole and much too warm at the summer pole (Brasseur and Solomon, 2005). The deviation with the observed temperature increases with height from the tropopause to the mesopause. The geostrophic wind computed using the radiative temperature field, blowing from west in winter and from east in summer, increases continuously with height to reach unrealistic values in the mesosphere whereas the observed winds show a maximum in the lower mesosphere, at around 60 km, and are reversed near the mesopause. This reversal of the wind is associated with a reversal of the temperature gradient between summer and winter poles. This indicates the fundamental role of the dynamics in controlling the whole thermal structure of the middle atmosphere. The observed thermal structure can only be explained with a global-scale mean meridional and vertical circulation from low-latitudes (ascent of air with adiabatic cooling) to high latitudes (descent of air with adiabiatic warming) in the lower stratosphere known as the Brewer-Dobson circulation (Shepherd, 2000) and from the summer hemisphere (ascent of air with strong adiabatic cooling) to the winter hemisphere (descent of air with strong adiabatic warming) in the upper stratosphere and the mesosphere. A global source of deceleration of the zonal wind is needed to maintain this so called “diabatic circulation” due to the fact that it transports air masses across isentropic surfaces. This source is provided by the deposition of momentum by breaking of upward propagating planetary and gravity waves. The diabatic circulation is essential in the redistribution of minor constituents in the whole middle atmosphere.
Fundamental parameters in dynamical studies are those giving the physical state of the atmosphere, temperature, pressure and the three components of the wind. Unfortunately, it is in general not possible to measure all these parameters at the same time and in the same volume. In particular, it is very difficult to get direct information on the vertical wind. The only way to obtain a full 3D description of these parameters is to assimilate observations into meteorological and global climate models. These have been greatly improved in the last decades thanks to the increase of computational power and the development of advanced assimilation techniques. However, the improvement of the description of middle atmosphere structure and dynamics is limited by the quality (accuracy, vertical and horizontal resolution) and spatial and temporal coverage of available data to assimilate. An important source of information is coming from ground-based remote sensing and in situ instruments. Ground-based Rayleigh lidars provide temperature measurements from 30 to 80 km with a good vertical resolution, but they are operated in a very limited number of sites. The network of radiosondes provides temperature and wind profiles twice per day mainly over populated continental areas up to 30 km. There is almost no data above oceans and the network is very sparse in the tropics and in the southern hemisphere. The global view of the structure of the atmosphere can only be provided by remote sensing instruments operated from space. Several satellite instruments are measuring the temperature in the middle atmosphere. They include infrared and microwave radiometers, solar and stellar occultation experiments and Global Navigation Satellite System (GNSS; well known also under its US name GPS for Global Positioning System) radio-occultation receivers. There is no instrument on board satellites available today for stratospheric wind observations but the first space Doppler wind lidar ADM-Aeolus is expected to fly in the near future. These instruments are described in the next sections.
2 Temperature measurements
Satellite instruments dedicated to the measurement of temperature can be classified into two categories. The first category includes instruments measuring a quantity depending directly on temperature, in general the thermal infrared or microwave emission of an atmospheric constituent with constant mixing ratio like CO2 and O2. The second category includes instruments measuring a quantity related to the total atmospheric density from which the temperature profile is computed assuming the hydrostatic equilibrium of the atmosphere, applying the perfect gas law. The pressure is fixed at the top of the density profile using climatological data or meteorological analyses and the determination of the temperature is obtained with a downward integration as it is done for Rayleigh lidars (Hauchecorne and Chanin, 1980). The measured quantity may be the absorption of sunlight by a constituent with constant mixing ratio, the Rayleigh scattering by air molecules or the bending angle of the optical or radio wave path by the gradient of refractive index. We present below the instruments belonging to these two categories available now or operated in the past.
2.1 Temperature measurements using the atmospheric thermal infrared or microwave emission
The global field of middle atmospheric temperature has been measured by infrared and microwave radiometers on board operational and research meteorological satellites since 30 years (Nash and Brownscombe, 1983). The principle is to measure the thermal radiation emitted by the atmosphere at wavelengths corresponding to emission bands of atmospheric constituents with constant mixing ratio, in general the infrared 15 μm CO2 band or O2 bands in the microwave spectrum. The measured emission is then directly dependent on temperature. Because CO2 density is increasing due to anthropogenic emissions, the shapes of the vertical weighting functions are slightly modified as a function of time (Shine et al., 2008). When long-term satellite series are considered this needs to be taken into account. However, most of the space missions have lifetime limited to several years. Two geometries of observation are available. Limb viewing allows a high vertical resolution (about 2 km), the weighting function being determined by the field of view of the instrument. The horizontal resolution is relatively low, fixed by the length of the line of sight in the tangent layer (about 200 km). The vertical profile is obtained from a scanning of the limb. This geometry is mainly used in research satellites dedicated to the study of the middle atmosphere. The intensity of the emission band is chosen to cover the desired altitude range, stronger bands being used to cover higher altitudes. As a matter of fact, the intensity of the emission for a given wavelength increases with decreasing altitude until the saturation level of the band is reached. Most instruments are focused on the stratosphere and the lower mesosphere in connection with the study of the stratospheric ozone layer. This is the case for infrared measurements by ISAMS (Taylor et al., 1993) and CLAES (Roche et al., 1993) instruments on board the NASA Upper Atmosphere Research Satellite (UARS) launched by NASA in 1991 and by MIPAS on board the ENVISAT European platform launched in 2002 (Fischer et al., 2008). This is also the case for microwave measurements by UARS MLS (Barath et al., 1993), and AURA MLS (Waters et al., 2006). SABER-TIMED uses stronger CO2 bands to cover the mesosphere and the lower thermosphere for the study of the upper atmosphere energetics (Russell et al., 1999).
The nadir viewing geometry allows very good horizontal resolution (down to a few tenths of a km) fixed by the field of view and the horizontal sampling of the satellite. The vertical profile is obtained by sounding in several emission bands coming from different atmospheric layers defined by their weighting function depending on intensity (the strongest bands coming from the highest altitude). The first generation of nadir viewing instruments for stratospheric temperature is the Stratospheric Sounding Unit (SSU) flown on the National Oceanic and Atmospheric Administration's (NOAA) operational satellites since 1978 (Nash and Forrester, 1986). The SSU sensed in the 15 μm CO2.band. Since 1998, it has been replaced on board NOAA satellites by Advanced Microwave Sounding Units (AMSU-A), a 15-channel microwave sounder designed primarily to obtain temperature profiles in the stratosphere and to provide a cloud-filtering capability for tropospheric temperature observations (Gelman et al., 2000). Fig. 2 presents the weighting functions of SSU and AMSU-A channels. The vertical resolution is about 20 km for SSU (three channels) and 10 km for AMSU-A (six stratospheric channels).

Zonally averaged temperature (K) from 5 to 110 km altitude in January, based on CIRA 86 (Fleming et al., 1998).
Moyenne zonale de la température (K) de 5 à 110 km d’altitude en janvier, d’après le CIRA 86 (Fleming et al., 1998).
SSU measurements since 1978 have been a major source of data for the study of the natural variability (Keckhut et al., 2005), and determination of upper stratospheric temperature trends (Randel et al., 2009) and changes in stratospheric dynamics (Cagnazzo et al., 2006). Data from AMSU are assimilated in numerical weather forecast models, and work is in progress to combine AMSU and SSU measurements to obtain an extended stratospheric temperature record (Figs. 3 and 4).
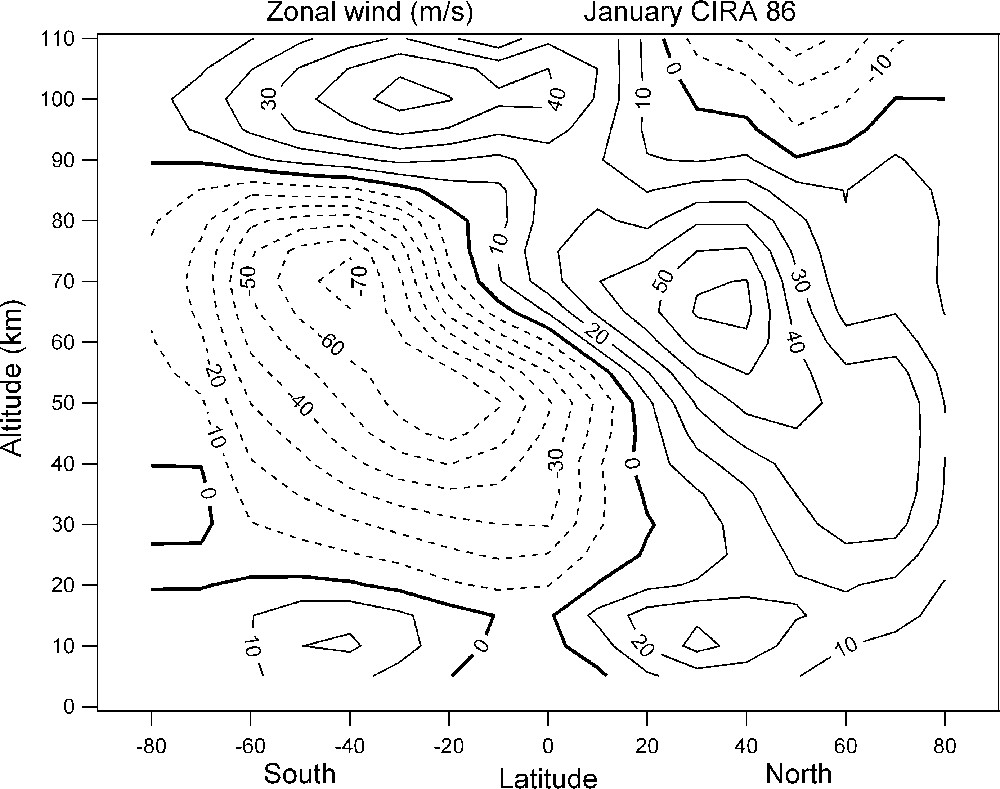
Zonally averaged zonal wind (ms−1) from 5 to 110 km altitude in January, based on CIRA 86 (Fleming et al., 1998). Positive winds (solid lines) are blowing eastwards (westerlies) and negative winds (dashed lines) are blowing westwards (easterlies).
Moyenne zonale du vent zonal (ms−1) de 5 à 110 km d’altitude en janvier, d’après le CIRA 86 (Fleming et al., 1998). Les valeurs positives (lignes continues) correspondent aux vents d’ouest et les valeurs négatives (tiretés) aux vents d’est.
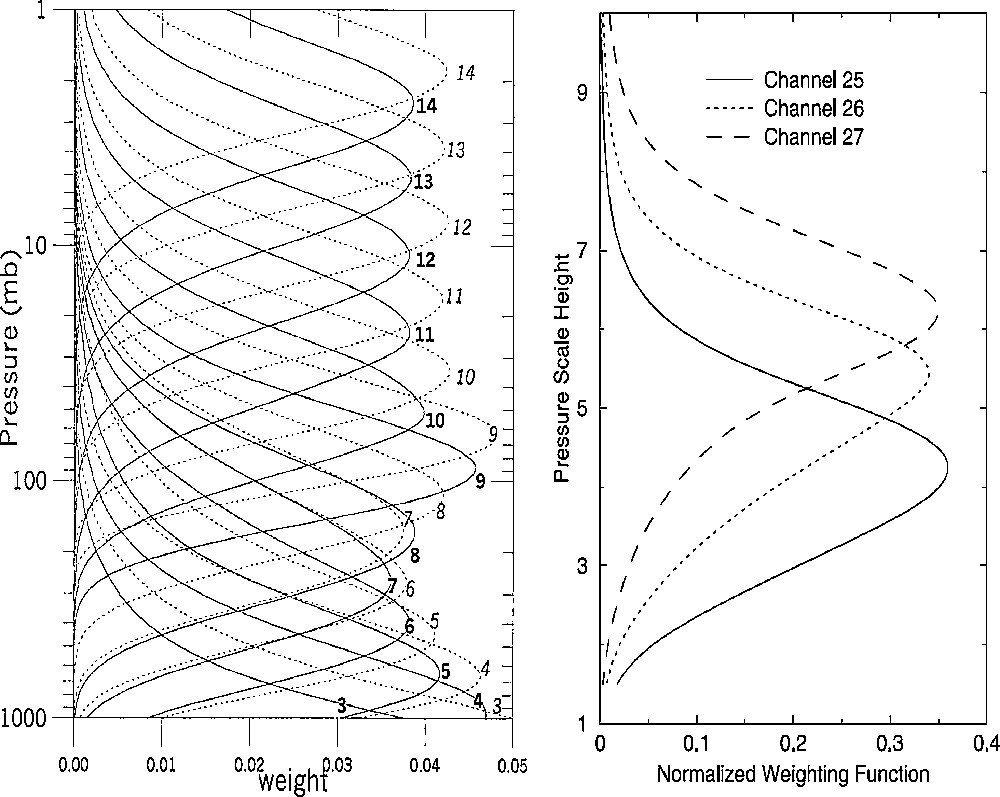
Left: AMSU-A weighting functions AMSU-A channels 4–14 weighting functions for two view angles: near-nadir angle of 1.35° (solid curves) and the largest angle of 47.85° (dashed curves), from (Goldberg et al., 2001). Right: SSU weighting functions, from (Shine et al., 2008). Note that the right figure ordinate is in pressure scale height. The equivalence with pressure is 2.3 for 100 hPa, 4.6 for 10 hPa and 6.9 for 1 hPa.
Gauche : fonctions de poids des canaux 4-14 d’AMSU-A pour 2 angles de vue : angle proche du nadir de 1,35° (lignes continues) et angle le plus élevé de 47,85° (tireté), d’après (Goldberg et al., 2001). Droite : fonctions de poids de SSU d’après (Shine et al., 2008). Noter que l’ordonnée de la figure de droite est en échelle de hauteur de la pression. L’équivalence avec la pression est 2,3 pour 100 hPa, 4,6 pour 10 hPa et 6,9 pour 1 hPa.
2.2 Density and temperature measurements from occultation or sunlight scattering at limb
2.2.1 GNSS Radio-occultation
GNSS radio-occultation provides vertical profiles of index of refraction in the atmosphere (Kursinski et al., 1997). The principle is to observe the Doppler shift of the radio signal emitted by GNSS satellites when the path crosses the atmosphere and its length is increased by the refractive index change. Above 70 km in the ionized atmosphere, it allows one to measure the electron content. In the neutral atmosphere, below 50 km, the index of refraction depends on total atmospheric density and humidity. In the upper troposphere and stratosphere the effect of humidity is negligible and the signal can be used to determine the vertical profile of density and temperature with a high vertical resolution limited by the Fresnel scale (better than 500 m at the tropopause). An Abel inversion of the refractive angle is applied to derive the density profile from which the temperature profile is computed. The method is based on the measurement of time with a very high accuracy and is largely free from any systematic bias. This is an important point for climatological studies. GNSS radio-occultation measurements are now operational on several satellites, including the German satellite CHAMP (Steiner et al., 2007), the GRAS instrument on board the European platform METOP (Loiselet et al., 2000) and the Taiwan-USA COSMIC/FORMOSAT-3 micro-constellation of 6 satellites (Rocken et al., 2000). Comparisons of GNSS radio-occultation profiles with radiosonde data and ECMWF analyses have shown excellent agreement in the upper troposphere and stratosphere up to 40 km as shown by (Wickert et al., 2004) (Fig. 5). These data are now routinely assimilated in numerical weather forecast models and are used for specific scientific studies like troposphere-stratosphere exchanges.

Statistical comparison between 46,300 vertical: a: temperature; b: refractivity profiles (CHAMP satellite radio-occultation data) and corresponding ECMWF analysis data. From (Wickert et al., 2004).
Comparaison statistique entre 46 300 profils verticaux de : a : température ; b : réfractivité (données de radioccultation du satellite CHAMP) et les analyses correspondantes d’ECMWF. D’après (Wickert et al., 2004).
2.2.2 Solar occultation experiments
Another way to derive temperature profiles from space is to measure the absorption of the solar spectrum by the atmosphere during sunset or sunrise at wavelengths corresponding to absorption bands of well mixed species or attenuated by Rayleigh scattering by air molecules. This allows a determination of the density profiles, directly proportional to the attenuation of solar light, and derivation of the temperature profiles as explained previously. Two solar occultation instruments have been widely used for climatological studies of the middle atmosphere temperature thanks to their long lifetime. Stratospheric Aerosol and Gas Experiment (SAGE II) observed solar occultation at 7 wavelengths from near UV to near IR to determine O3, NO2, H2O, aerosols and temperature in the stratosphere. It was operated for 21 years from 1984 to 2005. The vertical profiles of the constituents and of atmospheric density from Rayleigh extinction by air molecules are derived from the measured atmospheric transmission at the 7 wavelengths. The temperature profile is derived from the density as in the case of radio-occultation (Wang et al., 1992). Halogen Occultation Experiment (HALOE) was a near infrared solar occultation spectrometer on board UARS dedicated to the measurement of minor constituents and of temperature using the 2.8 μm CO2 band (Russell et al., 1993). It was operated from 1991 to 2005.
2.2.3 High-resolution temperature profiling using bichromatic star scintillation measurements
The vertical resolution of limb profiles measurements from space cannot generally be better than 1 to 2 km, limited by the field of view and the sampling of the instrument and the accuracy of the pointing. There is one exception with the use of the stellar occultation technique allowing a very high vertical resolution due to the narrow and geometrically well-defined optical path. Global Ozone Monitoring by Occultation of Stars (GOMOS) is a stellar occultation spectrometer aimed at building climatology of ozone and related species in the middle atmosphere (15 to 100 km) with very high accuracy (Bertaux et al., 2004). In order to monitor star scintillations produced by small-scale fluctuations of temperature (and density) along the line of sight, GOMOS is equipped with two photometers sampling simultaneously the star flux at two wavelengths in low-absorption regions with a frequency of 1 kHz. The intensity of light measured by the GOMOS photometers exhibits fluctuations that may exceed its regular value by several hundred percent due to the fluctuations of atmospheric density produced (mainly) by gravity waves and turbulence. Their characteristic vertical scales range from a few kilometers down to the dissipation scale, variable with altitude but typically smaller than 1 meter. The largest scale fluctuations associated with gravity waves are strongly stretched along the horizontal direction by the stable stratification of the atmosphere. As a consequence, the 2-photometer signals exhibit similar fluctuations shifted in time due to the difference in refractive index between the 2 wavelengths. The determination of this time delay by the computation of the cross-correlation between the 2 signals allows the determination of refraction angle, which is proportional to this time delay (Dalaudier et al., 2006). Density and temperature profiles are determined between 17 and 35 km using the method applied for radio-occultation. An example is shown in Fig. 6. The vertical resolution achieved for the high-resolution temperature profiles (HRTP) is in the order of 200 m.

Sample temperature profile (light grey solid line) obtained from chromatic scintillation data compared with a collocated lidar profile (dark grey solid line) and ECMWF (thick dashed line). The uncertainty distinguishes contribution from random errors (greyed area) and total error including initialization bias (thin dashed lines).
Exemple de profil de température (ligne gris clair) obtenu à partir des données de scintillation chromatique de GOMOS, comparé à un profil lidar colocalisé (ligne gris foncé) et ECMWF (ligne tiretée épaisse). L’incertitude distingue la contribution des erreurs aléatoires (zone grisée) et l’erreur totale incluant le biais d’initialisation (ligne tiretée fine).
2.3 Density and temperature measurement from limb Rayleigh scattering of sunlight
The observation of the Rayleigh scattering of sunlight at the limb in the UV-visible can be used to determine the density and temperature profiles in the upper stratosphere and in the mesosphere. Above the top of the stratospheric aerosol layer (around 35 km in the tropics and 30 km at middle and high latitudes), the scattering is proportional to the number of molecules along the line of sight. The re-absorption of the scattered light by molecules along the path has to be taken into account but is negligible at higher levels. The contribution of the albedo of the ground surface and clouds should also be considered. The scattering profile is inverted to obtain a vertical profile of atmospheric density from which the temperature profile is computed as described previously. This technique was first applied using Solar Mesospheric Explorer (SME) data to obtain a global picture of the mesospheric temperature field in the height range of 40 to 92 km (Clancy et al., 1994). With the same technique, the latitudinal variability of the annual cycle of mesospheric temperature at 75, 82, and 87 km was examined employing 7 years (1991–1997) of data from the WIND Imaging Interferometer (WINDII) Michelson Interferometer on board UARS (Shepherd et al., 2004).
3 Wind measurements
3.1 ADM-Aeolus Doppler wind lidar
The most important parameter for meteorological forecast is the wind measurement. However, this parameter is very difficult to measure from space and is only measured by the network of radiosondes concentrated in continental areas. Unlike radiosonde profiles, the wind is indirectly derived from temperature and humidity measurements assimilated in Numerical Weather Prediction (NWP). The Earth Explorer Atmospheric Dynamics Mission (ADM-Aeolus), to be launched in 2011, will be the first Doppler wind lidar in space (Stoffelen et al., 2005). It will provide global observations of radial wind profiles from the ground up to 30 km altitude to improve the quality of weather forecasts, and to advance the understanding of atmospheric dynamics and climate processes. It is based on the heritage of ground-based and airborne wind lidars. A Doppler lidar is composed of a monochromatic pulsed laser and an optical system for the determination of the Doppler shift of the backscattered light due to the air radial velocity. The return signal consists of the superposition of a spectrally narrow aerosol (Mie) signal and a broadened molecular (Rayleigh) signal due to the thermal motion of air molecules (Fig. 7). Aerosols are mostly concentrated in the lower 4 km of the troposphere and their concentration diminishes above the troposphere. In contrast, the molecular backscatter signal under clear atmospheric conditions allows more consistent measurements up to altitudes above 20 km. The Doppler Rayleigh lidar technique for the measurement of stratospheric winds was first demonstrated at Observatoire de Haute-Provence (OHP, 44°N, 6°E) by Chanin et al. (Chanin et al., 1989). The complementary behavior of Mie and Rayleigh return signals suggests the combination of two dedicated receivers in a single instrument, in order to allow accurate measurements over the entire altitude range. In ADM-Aeolus, the instrument includes a Mie and a Rayleigh channel composed respectively of a high resolution Fizeau interferometer and of a double Fabry-Pérot interferometer to analyze the two components of the backscattered signal.
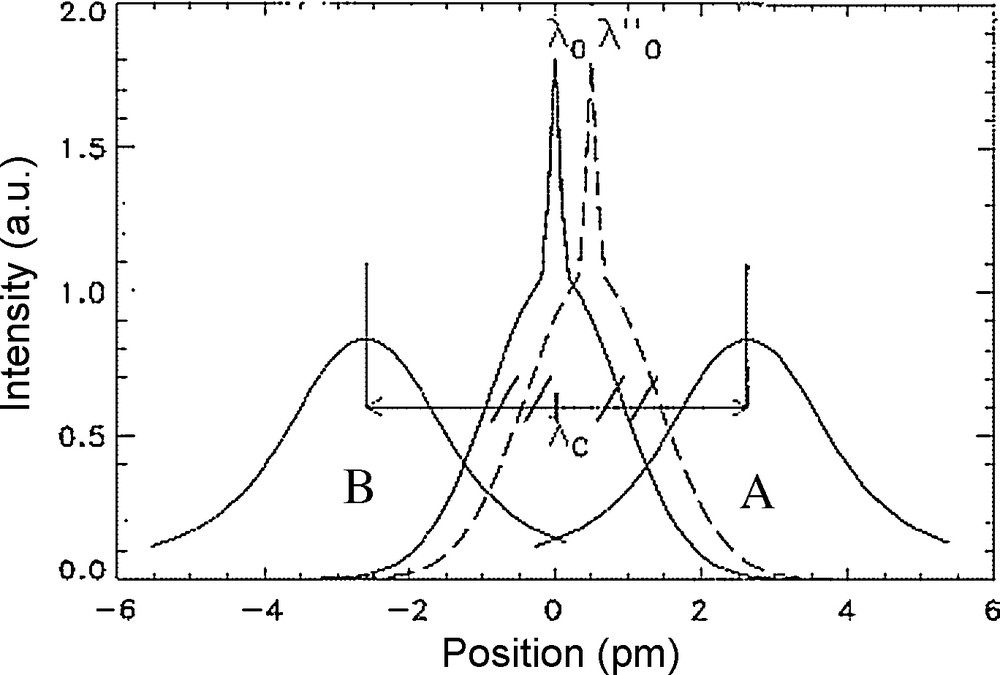
Double spectral band filter used in the ground-based Rayleigh Doppler lidar set-up at OHP. The spectral bands are defined by the transmission function of a two zone- Fabry-Pérot interferometer. A similar detection system is implemented in the ADM-Aeolus Rayleigh channel. From (Souprayen et al., 1999). Ordinates are in arbitrary units.
Filtre à 2 bandes spectrales, utilisé sur le lidar Rayleigh Doppler de l’OHP. Les bandes spectrales sont définies par la fonction de transmission des 2 zones de l’interféromètre de Fabry-Pérot. Un système de détection similaire est implanté sur le canal Rayleigh de ADM-Aeolus. Les ordonnées sont en unités arbitraires. D’après (Souprayen et al., 1999).
4 Validation with ground-based lidars
Satellite measurements provide temperature measurements on a global scale that are not available from ground-based or in situ instruments. However, satellite radiometers need to be calibrated and their sensitivity can be affected by long-term changes. Systematic validations and periodic calibrations by ground references are then needed to take these changes into account. Satellite observations may suffer from systematic effects due to the observing geometry and the local time of measurements. Furthermore, each satellite has a limited lifetime and it is necessary to combine the data of several space instruments for trend studies. Ground-based temperature lidars set-up in the framework of Network for the Detection of Atmospheric Composition Changes (NDACC) play an important role in validation of temperature limb sounders since UARS (Dudhia and Livesey, 1996; Gille et al., 1996; Remsberg et al., 2002; Wu et al., 2003) launched in 1991 until the ENVISAT European platform launched in 2002 (Ridolfi et al., 2007). Other recent research satellites like the Atmospheric Chemistry Experiment (Sica et al., 2007) onboard the first Canadian SCIentific SATellite (SCISAT-1), or the Sounding of the Atmosphere Using Broadband Emission Radiometry instrument (SABER) for the Thermosphere Ionosphere Mesosphere Energetics and Dynamics (TIMED) mission (Dou et al., 2009) have been validated using the same data sets. A mobile system visiting alternatively the different sites insures the homogeneity of the ground network (Singh et al., 1996).
A similar approach will be followed for the validation of ADM-Aeolus wind data in the stratosphere using the very few ground-based Doppler lidars in operation. Two of them are operated by French laboratories (LATMOS and LACy) and will be available for this purpose at OHP and Reunion Island (21°S, 55°E). The combination of satellite instrument and ground-based lidar data are also used to evaluate long-term temperature trends (Keckhut et al., 2001) and to estimate the contribution of periodic effects in the evaluation of these trends when data are coming from several instruments measuring at different local time. The diurnal atmospheric thermal tide can have an effect of up to 3 K in the upper stratosphere (Keckhut et al., 1996). The difference in the stratopause temperature between ascending and descending passes was found to be less than 1.5 K in 2004 but 2–3 K by the end of 2007 (Funatsu et al., 2008), possibly due to the drift in local time of the NOAA-16 satellite.
5 Conclusion
The middle atmosphere structure and dynamics are expected to change in the future due to the increase of greenhouse gases and the recovery of the ozone layer. However, model predictions are very uncertain due to the complexity of the interactions between radiative, chemical and dynamical processes taking place in this region. Global observations from space of temperature and wind fields are therefore needed to improve our understanding of atmospheric process and to better predict the future evolution of the middle atmosphere. The temperature field is observed at the present time by several infrared and microwave radiometers and solar, stellar and radio occultation instruments, providing an important source of data for climate and processes studies. These observations will be complemented in the near future by the first Doppler wind space lidar. The role of ground-based and in situ observations in the validation of satellite observations is fundamental to ensure that they do not suffer from systematic biases and long-term drifts.
Vous devez vous connecter pour continuer.
S'authentifier