

1 Introduction
The present paper is a follow-up on previous experiments on trees (Morat et al., 1984; Koppan et al., 2000; Gibert et al., 2006).
An investigation of the relationship between sap flow and daily electric potential variations has recently been conducted in the trunk of a standing poplar tree equipped with electrodes along its height (Gibert et al., 2006). In the course of the research, it was noticed that simultaneous peculiar transient signals were frequently detected at all the electrodes. The signals had a duration of several minutes and their amplitude increased with the height at which the electrode was implanted.
This phenomenon, ancillary to the object of the research, remained unexplained at the time. In the present article, we gather the available data and try to make sense of them.
2 Experimental set-up
The experimental set-up has been described in detail in the paper by Gibert et al. (Gibert et al., 2006). We summarily recall here its relevant features.
A poplar tree (Populus nigra L.), 30 m high, standing in Remungol (Brittany) was equipped with 27 electrodes, arranged in a vertical line and two rings. In the following, we will consider only the signals detected at the electrodes on the vertical line, from the height of 0.5 m above the ground to 10.5 m (the highest electrode):
E30 (0.5 m), E6 (1 m), E31 (1.5 m), E32 (2 m), E33 (2.5 m), E34 (3 m), E16 (3.4 m), E21 (5.5 m), E22 (6.5 m), E23 (7.5 m), E24 (8.5 m), E25 (9.5 m) and E26 (10.5 m), (Fig. 1).
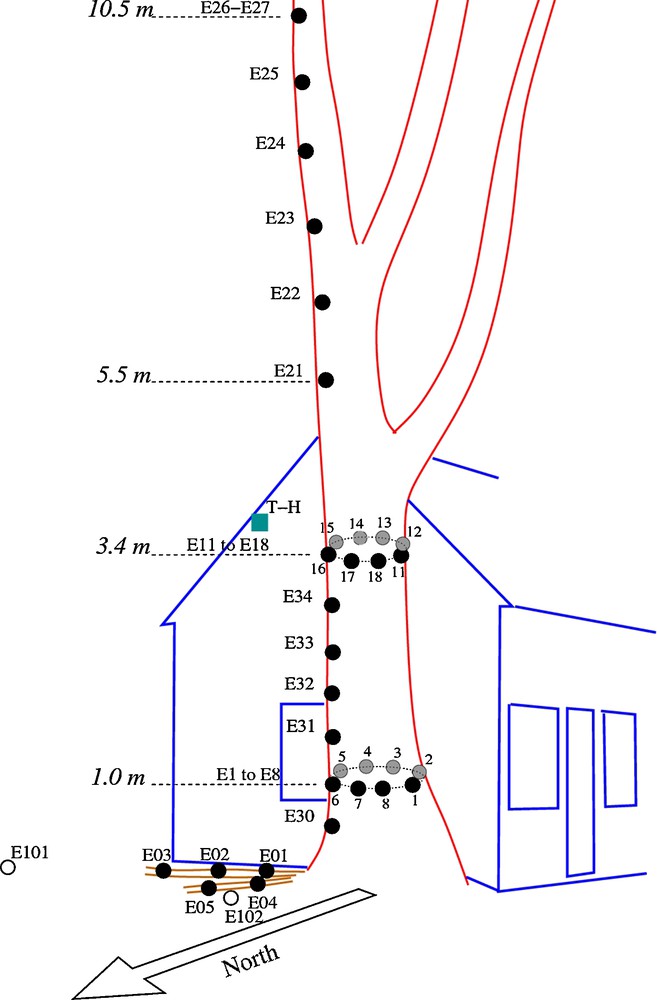
Poplar equipped with electrodes. The transient signals are detected at the electrodes in a vertical line: E30, E31, E32, E33, E 34, E16, E21, E22, E23, E24, E25, E26.
Peuplier équipé d’électrodes. Les signaux transitoires sont détectés aux électrodes sur une ligne verticale : E30, E31, E32, E33, E 34, E16, E21, E22, E23, E24, E25, E26.
The stainless steel electrodes, 6 mm in diameter, were gently hammered into holes to a depth of 15 mm. The reference for potential measurements was a nonpolarisable lead-lead chloride electrode, buried at a depth of 0.7 m, 5 m away from the tree. The potentials at the electrodes were measured with a sampling interval of 1 mn, using a Keithley 2701 digital multimeter with an input impedance larger than 100 MΩ. It was shown that the direct effect of outside temperature on the measured electrode potentials was negligible (Gibert et al., 2006).
3 Data
Potential measurements were collected from January 2004 to May 2005. On top of the daily variations of the potential, a number of transient signals frequently appeared at all electrodes, showing an increase or a decrease of potential ΔV, with respect to the quasi steady-state potential.
We have restricted our attention to the signals sharing the definite characteristics of having the same shape at all electrodes and an amplitude linearly increasing with the height of the electrode. We isolated 120 signals exhibiting those features.
The shape of the signals falls into four categories:
- • triangular peak above the mean potential, hereafter called positive (Fig. 2);
- • triangular peak below the mean potential, hereafter called negative (Fig. 3);
- • dipolar signal, positive followed by negative (Fig. 4);
- • dipolar signal, negative followed by positive (Fig. 5).
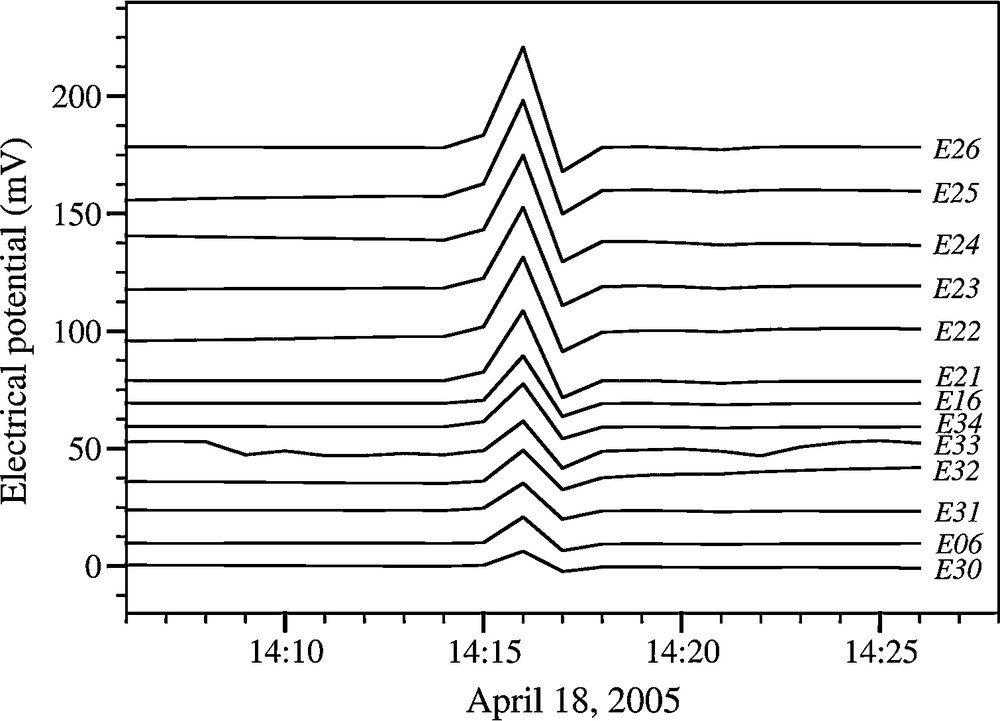
Positive transient signals.
Signaux transitoires positifs.

Negative transient signals.
Signaux transitoires négatifs.
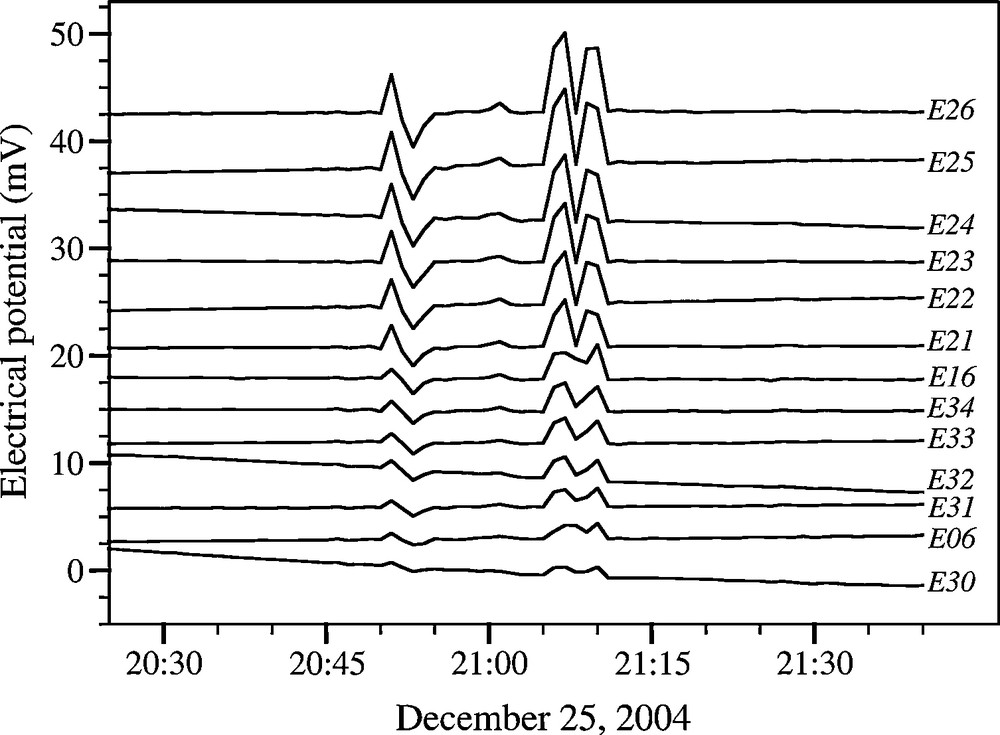
Dipolar transient signals (positive then negative).
Signaux transitoires dipolaires (positifs, puis négatifs).
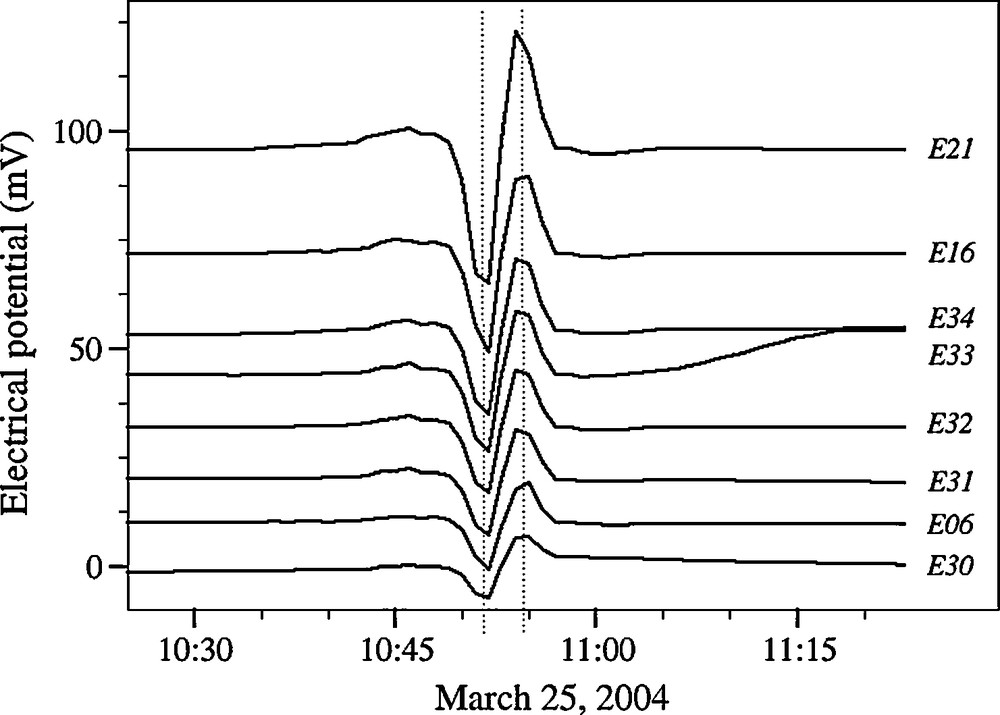
Dipolar transient signals (negative then positive).
Signaux transitoires dipolaires (négatifs, puis positifs).
The triangular signals often displayed some minor dipolar character and positive and negative signals often occurred in short time spans.
In addition to these signals, whose duration was typically of the order of a few minutes, there occasionally appeared perturbations of an irregular oscillatory character, lasting several tens of minutes, that exhibited the same features as the isolated signals viz, similarity of shape at all electrodes and amplitude increasing with height.
Over the 17 months of the experiment, the distribution of the signals in time appeared to be random, with long periods of time without any signal, or clusters of signals at short time intervals.
We investigated whether there was a dependence of the frequency of the signals on the time of the day and on the season of the year.
A histogram of the number of signals, taken over the 17 months of the experiment, vs hours (Fig. 6) did not exhibit any significant trend.
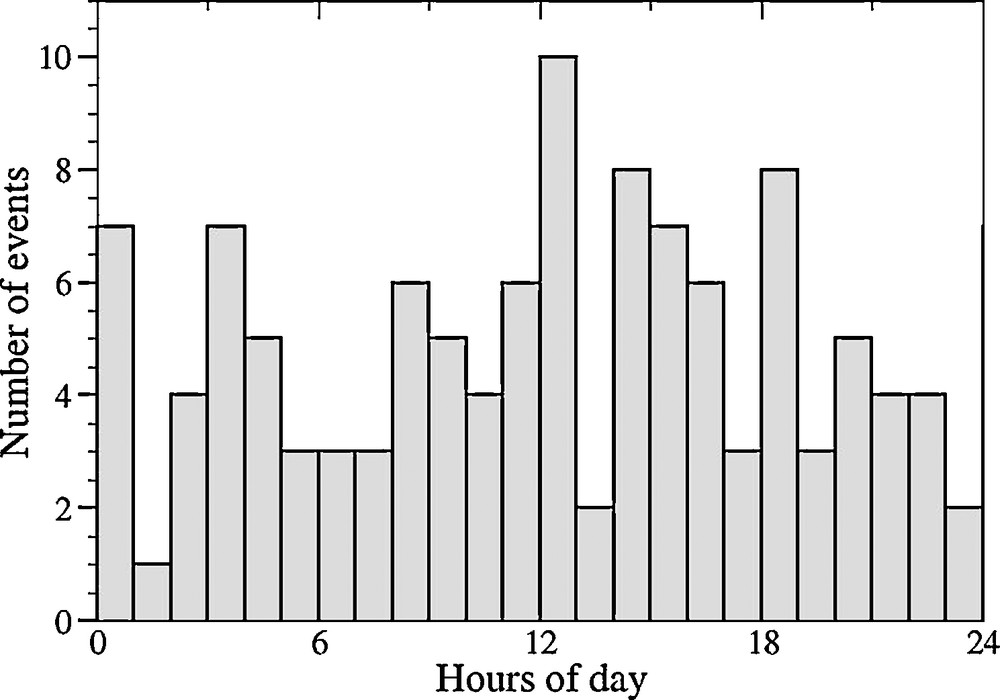
Frequency of signals as a function of the hour.
Fréquence des signaux en fonction de l’heure.
The histogram of the number of signals vs months suggested, at first, that signals were more frequent in winter (Fig. 7). However, when a period of one year, from January 2004 to January 2005, was considered, instead of 17 months from January 2004 to May 2005, the predominance of signals in winter disappeared (Fig. 7). This is due to the fact that there were more signals, often clustered, in January and February 2005, than in January and February 2004. It is therefore reasonable to conclude that there is no clear dependence of the number of signals on the season.
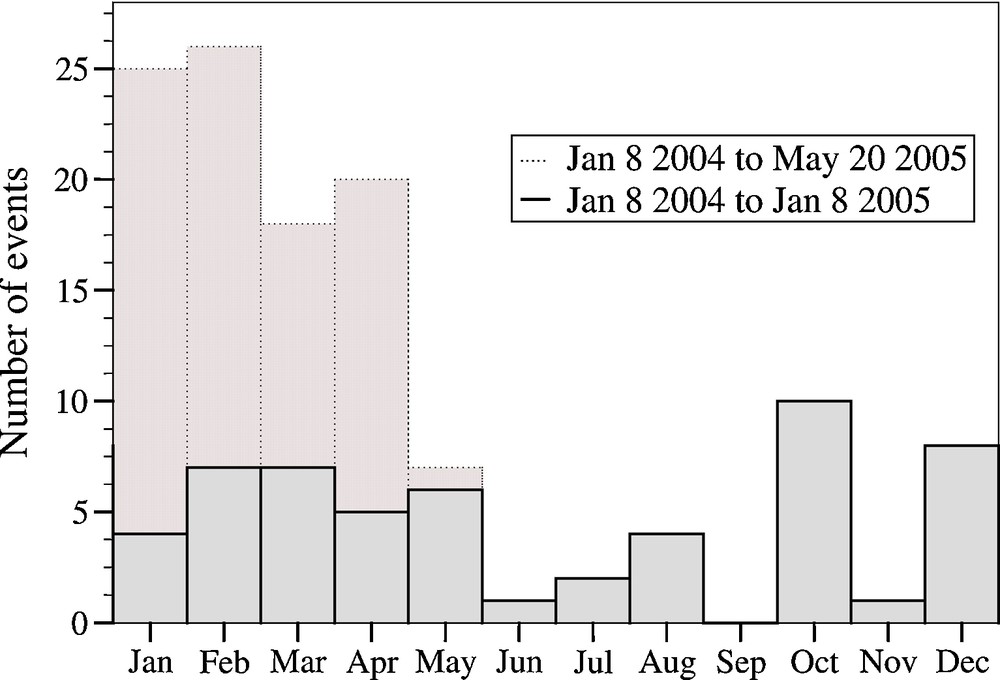
Frequency of signals as a function of the month.
Fréquence des signaux en fonction du mois.
The amplitude of the signal, ΔV, was measured as the height of the triangles, in the case of simple triangular signals, or as the difference between maximum and minimum of the potential, in the case of dipolar signals. It varied typically from a few tenths of a mV to about 2 mV at the lowest electrode and from about 5 to 50 mV at the highest electrode. For most of the signals, the amplitude at the highest electrode was smaller than 10 mV. Only a few had an amplitude of about 50 mV.
For some typical signals, the amplitude ΔV was plotted against the height of the electrode. There is no difference in the plots for positive signals and negative ones (for which −ΔV is plotted against height).
In some cases, the plot is a single straight line, with a slope of the order of 0.1 to 5 mV/m (Fig. 8 A). However, the plots frequently displayed a significant change of slope between electrodes E16 and E21 (Fig. 8 b, c), or between E16 and E21 and E22 and E23, approximately at the location of forks between the trunk and major limbs (Fig. 1). The slope of the plot may be greater or smaller above the fork than below it.
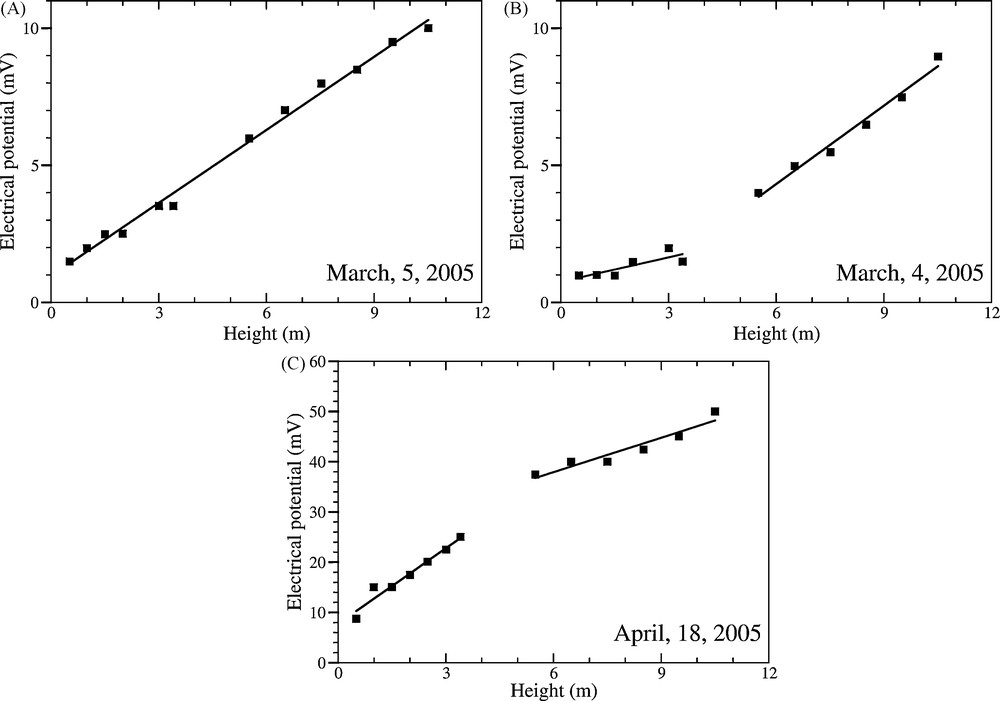
A. Amplitude of the signal as a function of the height of the electrodes. B. Amplitude of the signal as a function of the height of the electrodes. The change in slope of the two straight lines occurs at the height of the first major fork. C. Amplitude of the signal as a function of the height of the electrodes. The change in slope of the two straight lines occurs at the height of the first major fork.
A. Amplitude du signal en fonction de la hauteur des électrodes. B. Amplitude du signal en fonction de la hauteur des électrodes. Le changement de pente entre les deux segments de droite survient à la hauteur de la première fourche. C. Amplitude du signal en fonction de la hauteur des électrodes. Le changement de pente entre les deux segments de droite survient à la hauteur de la première fourche.
4 Discussion
The observations begging for an explanation can be summed up as follows:
- • potential differences ΔV are detected along the trunk of a standing poplar;
- • ΔV increases linearly as the height of the electrodes at which it is detected;
- • ΔV is typically of a few tens of mV, and sometimes as large as 50 mV at the highest electrode;
- • the signals, typically of a few minutes duration, occur at irregular intervals;
- • there is no significant difference in the frequency of signals, depending on the time of the day or the season;
- • the signals correspond either to a positive or a negative ΔV;
- • dipolar signals (negative followed by positive ΔV or vice versa) are frequently observed;
- • the slope of the plots of ΔV vs height of the electrode frequently exhibits breaks at the location of forks.
In fair weather conditions, the surface of the Earth is negatively charged and the electric field in the atmosphere varies typically between 100 and 150 V/m. The tree is at the same potential as the ground.
The fact that there appears a difference of potential ΔV with respect to the ground, increasing with height, implies that the tree is the seat of an electric current of intensity I = ΔV/R, where R = ρl/S is the resistance of the length l of trunk between the electrode and the ground. The measured resistivity ρ of the tree was of the order of 200 Ωm.
Taking for the cross section of the trunk, the approximate value S = 0.5 m2, and taking a typical value of ΔV = 10 mV for l = 10m, we obtain a typical value for the current I = 2.5 μA.
The fair weather ionization current in the atmosphere being of the order of 10−12Am−2, we see that, during these events, as much electricity can be conducted upward along the tree as from 2.5 km2 of ground. It may be interesting to engage in a speculation – however far-fetched – on the role of forests. A forest of 1 km2, with, typically, 30,000 trees, could conduct upward about 75 mA. The Amazonian forest of about 5 × 10⁶ km2, could, temporarily, conduct upward roughly 4 × 10⁴ A, in the extreme – and admittedly somewhat unrealistic – case of all the transient signals being simultaneous on all the trees. This is to be only taken, of course, as pointing to the potential influence of major forests on atmospheric electricity.
The change in slope often observed in the plot of ΔV vs height, at the approximate height of major forks in the tree would the result from the electrical current being divided between the trunk and the limb. Whether the slope above the fork is higher or lower than below depends on the relative intensity in the trunk and the limb.
It is suggested that the irregular appearance the currents leading to the observed signals might be ascribed to the passage of low, little active, thunderstorm clouds over the tree. Due to the separation of charges, the base of a thunderstorm cloud is usually negatively charged; by influence, it charges positively the ground. The tree constitutes a prominence with many pointed extremities (twigs, leaves…). By point discharge, the tree can conduct positive charges upward, thus leading to a positive ΔV.
It often happens that islands of positive charge are inserted amid the negative base of the cloud (Gary, 2004); the current would then flow in the other direction and ΔV would be negative. When a positive island in the cloud enters the region above the tree, it could lead to a negative ΔV followed by a positive ΔV when it leaves the region; thus the dipolar signals could be explained. The alternance of positive and negative ΔV sometimes observed over several minutes may be due to a succession of islands.
The process we have just proposed is essentially a scaled-down version of that which leads to an isolated tree being struck by lightning. Of course, in the case of a lightning stoke, the potential difference and the current intensity are higher by orders of magnitude (typically hundreds of millions of volts and hundreds of thousands amperes) and the electric field at the top of the tree can start an ionization avalanche in the air, thus producing a leader that eventually causes an ascending lightning bolt connecting to the cloud.
In our case, clouds that would not produce thunderstorms may still carry enough charge to cause a current of the order of a few μA to flow in the tree, manifested by ΔV signals of the order of a few tens of mV. The aborted leaders might produce luminous effluvia at the top of the tree, but they have not been observed, possibly because nobody was looking for them.
The tentative explanation of the transient signals presented above, would, of course, be more convincing if the appearance of the signals could be put in relation with local meteorological records. Unfortunately, this kind of observation was not made, since it was irrelevant for the previous study.
The purpose of the present paper is therefore only to draw attention to a well-documented phenomenon which deserves to be studied more systematically.
5 Conclusion
Studies of the electric potential and atmospheric conductivity at the ground surface were vigorous, up to the Second World War. Every magnetic observatory was also equipped with sensors or recorders of the electric potential. Noted physicists were engaged in the study of the electrical conductivity of the atmosphere. The 5th division of the International Union of Geodesy and Geophysics (IUGG) was called “Geomagnetism and Geoelectricity”. In the middle of the XXth century, the interest waned, but a renewal of interest might well be on its way. Indeed, the vertical downward current Jz, from the ionosphere, through the troposphere to the Earth's surface (ocean and land), flowing through layer clouds, generates space charges at the upper and lower boundaries of these clouds, capable of affecting the microphysical interactions between the droplets, ice forming nuclei and condensation nuclei, leading to changes in the cloud cover. Short-term meteorological responses to changes in Jz have been observed. Changes in the “global electrical circuit” may provide a candidate for explanation of sun-weather climate over a large range of periods (Tinsley et al., 2007).
The capability for trees and forests to generate strong temporal and spatial heterogeneities in Jz might be of some significance and should be investigated more in depth.
Vous devez vous connecter pour continuer.
S'authentifier