

1 Introduction
The conclusions of the last Intergovernmental Panel on Climate Change (IPCC) report confirm an increase in world temperature since the beginning of the industrial period and an acceleration of warming since 1975 (IPCC, 2007). Furthermore, the report stresses the now extremely probable anthropic cause of this warming. Although warming affects the whole world, regional contrasts are shown, with more marked warming in the northern hemisphere and faster warming of continents than seas, for example. One can therefore wonder about the consequences of this warming on the water cycle in general and in the Mediterranean region in particular. Indeed, this region is probably more susceptible to climate change as, geographically, it lies in a transition area between the hot, dry climate of Africa and the cold, humid air masses arriving from northern Europe (Goubanova and Li, 2007). With considerable coherence between models, climate simulations for the future display an intensification of the hydrological cycle at the scale of the planet (Planton et al., 2005). They thus forecast an increase in seasonal climatic variability (Diodato, 2004; Haas, 2002), with: (a) hotter, drier summers in the semi-arid regions (Planton et al., 2005); and (b) an increase in the duration and severity of low-flow periods and a decrease in groundwater recharge (Booij, 2005; Zhang et al., 2004). These climatic changes should be accompanied not only by a change in the average figures for the water cycle variables mentioned above but also by an increase in their variability in time. Extreme events should occur more frequently and with greater intensity (Jentsch and Beierkuhnlein, 2008). However, it is reminded that the forecasts mentioned here are subject to strong uncertainty, the reduction of which can be attempted only through a combined improvement of the spatial resolution of climate models and of their physical formulations (Le Treut et al., 2008).
The consequences of these possible changes in climate are all the more worrying in the Mediterranean region as socioeconomic scenarios indicate an increase in population and hence growing human pressure on water resources. Alcamo and Doll, 2003 and Arnel et al., 2004 consider that the consequences of increased pressure by man could be at least as great as those of climate change, at least in the short term.
The sensitivity of water resources in this region in a context of climate change and the diversity of the scenarios envisaged lead to asking questions about the already perceptible effects of modification of the climate. Our work addressing the Mediterranean zone of the South of France is focused on the Pyrénées-Orientales and Aude departments where water resources – consisting mainly of karstic and alluvial groundwater – are already a major concern today. The aim of this article is to examine if there are any signs of a change in the precipitation, temperature and potential evapotranspiration (PET) regime at different spatial scales. For brevity, these are referred to hereafter simply as climate variables. They are obtained from several types of measurements.
The study zone and the data are described in the next section. The procedure used is described in Section 3 and is followed by discussion of the results.
2 Study zone and data
2.1 Study zone
The Pyrénées-Orientales and Aude departments form a study zone of some 10, 000 km2 on the western façade of the French Mediterranean arc. The Pyrenees, culminating at an elevation of 2900 m, border them to the north and west, where the range marks the frontier with Spain. The climate is typically Mediterranean in the plain and on the coast and of a Mediterranean mountain type further west. Thirteen catchments and sub-catchments of interest have been selected (Fig. 1) on the main rivers draining the region, the Têt (1350 km2), the Tech (750 km2) and the Agly (1120 km2).
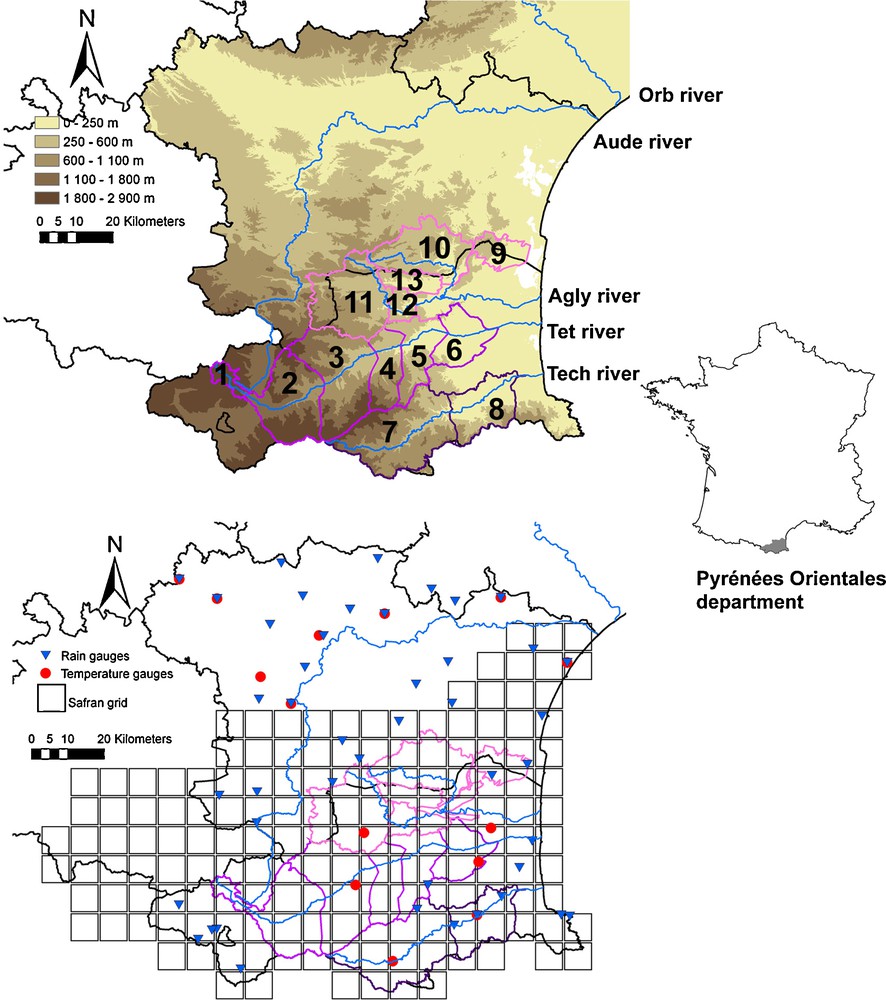
Presentation (a) of the study zone, the SAFRAN grid, the measurement stations and (b) the 13 analysed catchments.
The Têt at Mont Louis - 2 The Têt at Serdynia - 3 The Têt at Marquixanes - 4 The Têt at Rodes - 5 The Têt at St Féliu - 6 The Têt at the outlet - 7 The Tech at St Paul - 8 The Tech at the outlet - 9 Fontestramar - 10 The Verdouble at Tautavel - 11 Upstream of Caramany - 12 Downstream of Caramany - 13 Agly.
Présentation (a) de la zone d’étude, du maillage SAFRAN, des stations de mesure et (b) des 13 bassins versants analysés.
1 La Têt à Mont Louis - 2 La Têt à Serdynia - 3 La Têt à Marquixanes - 4 La Têt à Rodes - 5 La Têt à St Féliu - 6 La Têt à l’exutoire - 7 Le Tech à St Paul - 8 Le Tech à l’exutoire - 9 Bassin d’alimentation de Fontestramar - 10 Le Verdouble à Tautavel - 11 Amont de Caramany - 12 Aval de Caramany - 13 Agly
2.2 Data analysed
The climate variables are defined at time scales that are relevant as regards their influence on water resources. These are cumulated values at the monthly, seasonal and annual time step.
Two sets of data were used according to the different spatial scales considered. The first consists of direct, local measurements of precipitation and temperature at meteorological stations in the Météo-France network. The series were taken from BDCLIM, the Météo-France database. The second consists of indirect, spatialised measurements produced by spatial interpolation using the SAFRAN analysis system.
2.2.1 Data from the meteorological network
The selection of ground network weather stations was made with the requirement of a minimum of 36 years of data until 2006. Functioning periods were chosen that were common to all the stations. The latter criterion was imposed to be able to perform a regional interpretation of trend detection tests; this is described in the next paragraph. This led to choosing 44 stations for precipitation and 18 for temperature. The proportion of missing data varies with the time scale and climate variable and is at most of 2.7%. Météo-France first checked these series for spatial coherence before they were entered in the BDCLIM database. The monthly series were then checked for this study, with a search for breaks resulting from a change in metrological conditions (Mestre, 2002). Buishand's break test, Petitt's break test and Hubert's segmentation test (Lubès-Niel et al., 1998) led to discarding 4 temperature measurement stations where the breaks corresponded to metrological change. The ground data used were thus from 44 rainfall stations and 14 temperature stations.
2.2.2 Data from the SAFRAN analysis system
Indirect, spatialised data for precipitation, temperature and PET were provided by SAFRAN. The latter is a system for the analysis of the following meteorological parameters: the wind speed and direction, the air temperature, the relative humidity, the cloud covering, the global radiation, the rainfall and snowfall (Habets et al., 2008; Soubeyroux et al., 2008). It is based on an interpolation method of variables measured at ground level in homogeneous climatic zones, starting with atmospheric analyses. The various outputs are interpolated on an 8 × 8 km2 grid covering France. SAFRAN output was recently validated (Quintana-segui et al., 2008) and showed that precipitation and air temperatures did not display any climatological bias. The Penman-Monteith formula was used to calculate PET for each square of the grid using SAFRAN climatological variables. For the requirements of this study, calculated PET figures were compared and recalibrated using data from the Perpignan weather station. The entire study zone is covered by 160 squares (Fig. 1). For each of them, rainfall, snow, temperature and daily PET are available for the period 1970–2006. The SAFRAN climatic data were used to spatialise the climatic variables in the 13 catchments. With Xi representing one of the climatic variables of square i and λi, the proportion of the area of the square belonging to the catchment, the spatialised variable LBV for the catchment is given by:
| (1) |
3 Methodology
The aim is to determine whether or not the chosen climatic variables evolved during the analysis period. Statistical tests of stationarity were used for this purpose. Lemaitre, 2002; Renard et al., 2006; Zhang et al., 2004 review the various tests used in hydrology. The choice of a test depends among other things on: (a) the nature of the expected change – a trend, a break or multiple breaks; (b) the distribution of the analysed variable; (c) the size of the sample. Renard, 2006 and Renard et al., 2006 propose a methodology for choosing the most appropriate test for the characteristics of the variable of interest based on studies of the power and robustness of the tests when applied to simulated data. The non-parametric Mann–Kendall (MK) test (Kendall, 1975) was chosen here. It does not require any hypotheses on the variables and is more powerful than parametric tests, especially for non-Gaussian series (Lubès-Niel et al., 1998; Renard, 2006). However, it is based on the hypothesis that the expected change in the series is a monotonic trend and not a break. However, if there is a break in the data series, no loss of power is observed in the MK test in comparison with Pettitt's break test (Lemaitre, 2002). Furthermore, if a climatic change affects a given series, a gradual change can be expected rather than a break that would result more from a metrological change. These various features of the MK test show why this test is used in numerous studies on hydrological variables, including, for example, (Lespinas, 2008; Ludwig et al., 2004; Norrant and Douguedroit, 2006).
The test is applied at the local scale and also at the regional scale to judge the regional significance of the changes detected.
3.1 Local Mann–Kendall test
Let H0 be the “the series is stationary” null hypothesis to be tested against alternative hypothesis H1 “the series displays change”. Let X1,…,XN be a series of N independent observations derived from a continuous random variable X. The principle of the test consists in counting, for all pairs of values, the cases in which the first is larger than the second and the cases in which the first is smaller than the second. The test statistic, S, is the difference between these two cases and is written
| (2) |
With the H0, hypothesis, S approaches zero. Trends for an increase or a decrease result respectively in S being negative or positive. The expected value and variance of S are given by:
| (3) |
Furthermore, with H0, the variable Z defined below follows a reduced centred normal distribution for N > 10:
| (4) |
When several samples are drawn from a population with no trends, that is to say following the H0 hypothesis, the values of S differ for each sample. However, the Z variables, transformed from S by (4), will have a reduced centred normal distribution.
Zobs is calculated for a given series of observations using (4), under the H0 hypothesis. The first type of risk (or the probability of rejecting H0 when it is true) is α: H0 is rejected if the probability of observing Zobs is too rare. The p-value of the test is given by:
| (5) |
in which ϕ(x) is the reduced centred normal distribution function.
Hypothesis H0 is rejected if probability p is smaller than α. In this case, reference is made to a statistically significant trend at the threshold α; it is upward or downward depending on the sign of S.
Local application of this test to M stations does not make it possible to judge whether each series displays a significant change or not. For example, let us suppose there is a network of 100 stations and a risk α of 10%. In local application of the test to the 100 stations, it is expected that H0 will be rejected 10 times as a result of randomness alone. Thus, interpreting a result that would give 10 rejections of H0 in 100 samples is a problem: is hypothesis H0 rejected simply as a result of randomness or is it the result of a real change in the analysed series? The aim of the regional MK test is the regional interpretation of local tests and the indication for a group of stations whether the changes detected locally are significant with regard to all the other series analysed.
3.2 Mann–Kendall regional test
We take a group of M stations with records (Xi)i=1,…, N of length N. A method proposed by (Diodato, 2004) consists of calculating the variance of the M local statistics S, allowing for the spatial dependence of the values of S. Here, correlation between the M statistics for S is assumed to be the same as for Xi (Yue and Wang, 2002). An alternative that can be used to avoid this strong hypothesis consists of constructing a regional statistical test, SM, and determining its sampling distribution by the bootstrap re-sampling technique. The observations are grouped in a matrix D in which the rows are for years and the columns for stations. A fresh series of observations is assembled under hypothesis H0 by choosing at random from the rows in D. The spatial correlation between the stations is thus conserved. A local MK test is applied to the generated new series and the empirical sampling of SM can be constructed by repeating the operation many times. The five stages of the method are summarised below.
- (i) A new data matrix D’ is created by re-sampling rows of D;
- (ii) The M local tests are applied to the M new series created in (i);
- (iii) Steps (i) and (ii) are repeated K times to give K + 1 regional statistics
- (iv) The distribution function of
- (v) The null hypothesis H0 of the regional test ‘the trends detected locally are not significant regionally’ is tested against the alternative hypothesis in which is ‘the trends detected locally are significant regionally’. With the risk threshold being α’, hypothesis H0 is rejected if:
(6)
3.3 Estimation of the trend
When a significant regional trend was detected in one of the (Xi)i=1,…,N analysed series, we estimated the rate of increase or decrease of the series. This estimate is based on the assumption that the trend is a linear function of time. The rate of change is the regression slope of Xi and time. This hypothesis is frequently put forward in trend analyses, for example in (Burford et al., 2009; Norrant and Douguedroit, 2006; Pal and Al-Tabbaa, 2009; Tayanç et al., 2009), and makes it possible to describe the evolution of the series during the study period and provides an estimate of average change. However, it cannot be used to extrapolate the evolution of the series beyond the study period, as the linear model does not have any theoretical justification.
4 Results
4.1 Verification of the hypotheses of the temporal independence of the series
The hypotheses of temporal independence were verified before application of the MK tests to the climate variables described. The autocorrelation coefficients were calculated for each series and a conformity test applied to detect autocorrelation significantly different to zero. The results shown are for variables at the annual scale and are representative of the shorter monthly and seasonal durations. Indeed, using monthly series further reduces the likelihood of a link between monthly values observed in successive years. The data series for annual precipitation, temperature and PET in each of the 160 SAFRAN squares were analysed to find out whether possible autocorrelations were depending on the measurement site in the study zone. The results are shown in Table 1. A maximum of 20% of the squares displayed significant autocorrelation in annual PET. Autocorrelation of the other variables was significant in less than 10% of the squares. The significant autocorrelation coefficients were smaller than 0.4 in all cases. It is noted that the squares with significant autocorrelation appear to be spatially structured (Fig. 2); they are concentrated on the Pyrenees mountain range for temperature and PET and in the Albères range for precipitation. As there were very few cases of significant autocorrelation in the studied structure and as the coefficients were small, we applied the MK tests to the raw, untransformed data. This is preferable in so far as Hamed and Rao, 1998 showed that such a transformation reduces the power of the tests.
Nombre de mailles Safran présentant une autocorrélation significative au seuil de 10 %.
| Lag: | Annual precipitation | Annual temperature | Annual PET |
| 1 | 0 | 15 | 35 |
| 2 | 20 | 0 | 16 |
| 3 | 0 | 0 | 0 |
| 4 | 6 | 0 | 30 |
| 5 | 9 | 0 | 0 |
| 6 | 0 | 0 | 0 |
| 7 | 0 | 0 | 0 |
| 8 | 0 | 0 | 0 |
| 9 | 12 | 17 | 0 |
| 10 | 0 | 0 | 0 |
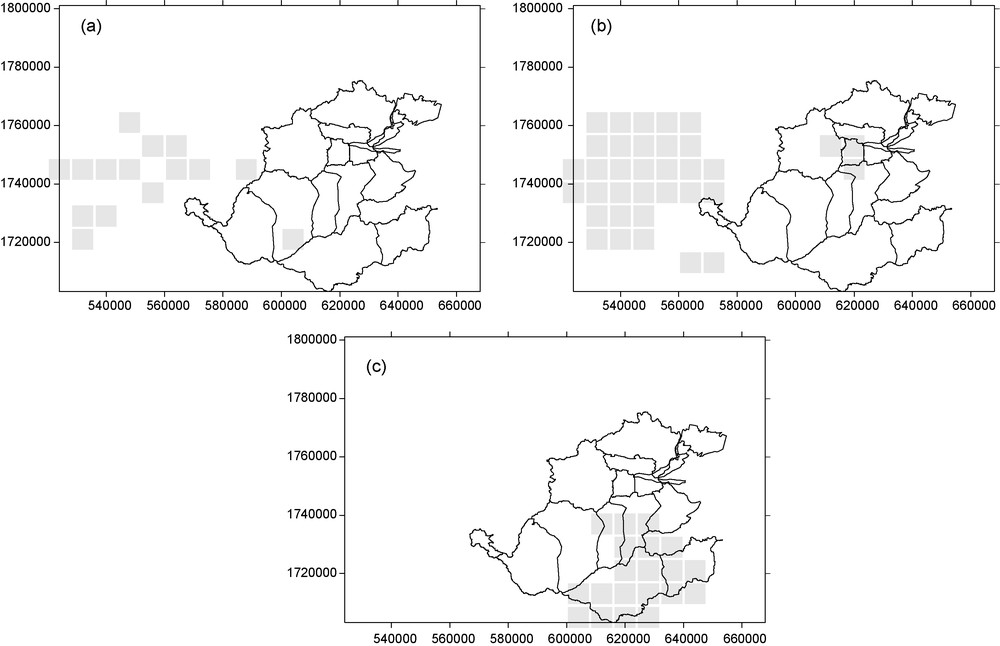
SAFRAN grid squares with significant autocorrelation at a threshold of 10% for (a) annual temperature (b) annual PET and (c) cumulated annual rainfall.
Cartographie des mailles SAFRAN présentant une autocorrélation significative au seuil de 10 % pour (a) température annuelle (b) ETP annuelle (c) Cumul de pluie annuel.
4.2 Results at the annual scale
The results obtained at the annual scale are shown in Tables 2 and 3. No trends in annual precipitation were observed in the study zone – in any of the 13 catchments.
Résultats des test MK locaux et régionaux appliqués à l’échelle annuelle. Le tableau indique les nombres de séries où le test local MK conclut à un changement significatif à α=5 %, les signes + et – représentent respectivement une tendance à la hausse ou à la baisse. SR(α’) indique que le changement est significatif à l’échelle régionale, au seuil α’ de 1 %, 5 % ou 10 %, NSR s’il ne l’est pas. NA signifie une absence de données ; les cases sont vides si aucun changement n’est détecté dans la série.
| Data | Ground readings | SAFRAN by catchment |
| Annual rainfall | 2 (+)/44 NSR | |
| Annual rainfall + snow | NA | |
| Number of dry days | ||
| Mean annual temperature | 13 (+)/14 SR(10%) | 13(+)/13 BV SR(10%) |
| Annual PET | NA | 7(+)/13 SR(10%) |
Tendance linéaire entre 1970 et 2006, ajustée sur chaque série annuelle SAFRAN où des changements significatifs ont été détectés sur cette période. Chaque colonne correspond à un bassin versant, la numérotation est la même qu’en Fig. 1.
| CT1 | CT2 | CT3 | CT4 | CT5 | CT6 | CT7 | CT8 | CT9 | CT10 | CT11 | CT12 | CT13 | |
| Température moyenne annuelle (°C/an) | 0.026 | 0.027 | 0.02 | 0.035 | 0.0320 | 0.0320 | 0.041 | 0.031 | 0.034 | 0.02 | 0.024 | 0.026 | 0.025 |
| ETP annuelle (mm/an) | 3.1 | 2.4 | 1.6 | 1.8 | 4.0 | 2.0 | 3.2 |
The average annual temperature displays significant changes, with an upward trend identified in temperatures spatialised by catchment by SAFRAN and at 13 out of the 14 ground weather stations. The average trend calculated for the studied catchments using SAFRAN spatial averages is +0.3 °C per decade, that is to say +1.1 °C from 1970 to 2006. With +1.5 °C, the increase in annual temperature in the zone is greater in the ground network. SAFRAN uses other, shorter temperature series and gives a spatial smoothing effect that can account for the difference. A certain spatial variability is observed in the annual temperature trend; it seems more marked in the catchments at the coast than in the upstream ones.
Like temperature, annual PET displays an upward trend that is significant in 7 out of the 13 catchments and significant at the regional scale. From 1970 to 2006, the trend varied from +1 to +4 mm per year depending on the catchment, that is to say an average increase in PET of between 34 mm and 150 mm in 36 years. The spatial organisation of the trends emerges fairly clearly, with the catchments in the northern and northwestern parts of the zone displaying the greatest increases in annual PET, and no significant trend in the southern and southeastern parts. This is illustrated in Fig. 3 by two annual PET series with the most and least marked trends.
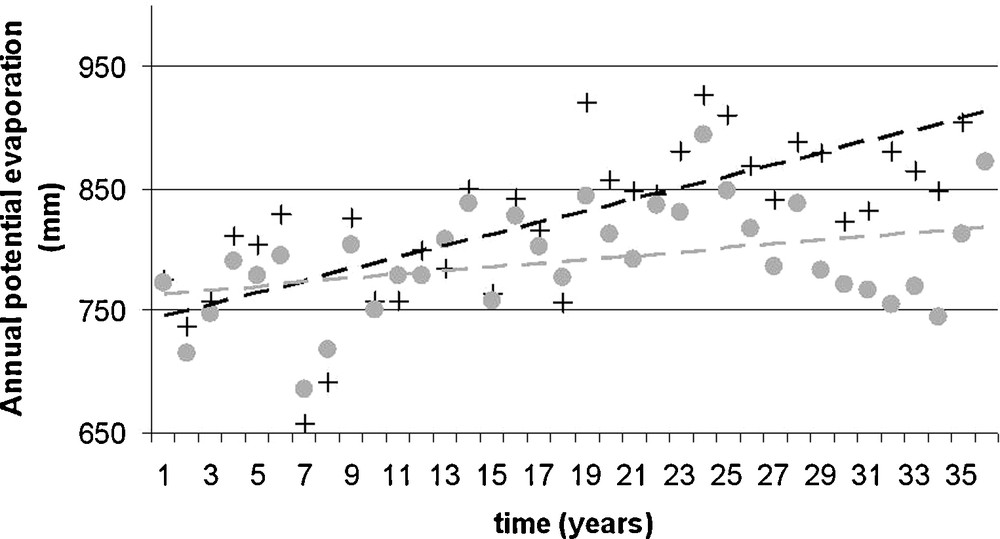
Annual potential evapotraspiration (PET) calculated for catchment 10, from Verdouble to Tautavel (black crosses) and catchment 3, the Têt at Marquixanes (grey circles), between 1970 and 2006, from the SAFRAN data.
The dotted line represents the linear trend fitted to the series.
Évapotranspiration potentielle annuelle calculée pour le bassin 10 du Verdouble à Tautavel (croix noires) et le bassin 3 de la Têt à Marquixanes (ronds gris) entre 1970 et 2006 à partir des données SAFRAN. La ligne en tiretés représente la tendance linéaire ajustée à la série.
No significant change was observed in annual rainfall and the number of consecutive days with no rain, whatever the source of the series. No trend for dry periods to become longer was observed if a dry period is defined as the number of consecutive days with precipitation of less than 0.1 mm per day.
4.3 Results at the monthly scale
The results at the monthly scale are shown in Tables 4 and 5. The changes detected in monthly precipitation shown by the various ground measurements and SAFRAN agree. A significant decrease is observed in the cumulated figures for June, except in the upstream catchments of the Têt at Mont-Louis and Serdynia. In contrast, an increasing trend is seen in November in all of the catchments. The averages of these trends in the concerned catchments are estimated to be –0.8 mm per year in June and +2 mm per year in November, with marked spatial variability, as they seem more marked in the coastal subcatchments (Fontestramar, the Tech and the downstream part of the Têt).
Résultats des tests MK locaux et régionaux, appliqués à l’échelle mensuelle. Le tableau indique le nombre de séries où le test local MK conclut à un changement significatif à α=5 %, les signes + et – représentent respectivement une tendance à la hausse ou à la baisse. SR(α’) indique que le changement est significatif à l’échelle régionale au seuil α’ de 1 %, 5 % ou 10 %, NSR s’il ne l’est pas. NA signifie une absence de donnée, les cases sont vides si aucun changement n’est détecté dans la série.
| Data | Ground readings | SAFRAN by catchment |
| Monthly rainfall | June: 14 (-) /44 – SR(5%) Nov.: 27 (+) /44 – SR(5%) |
June: 11 (-) /13 - SR (5%) Nov.: 13 (+)/13 - SR (1%) |
| Monthly rainfall + snow | NA | June: 11 (-) /13 - SR (5%) Nov.: 13 (+)/13 - SR (1%) |
| Number of dry days | March:10 (+) /13 - SR (1%) Nov.: 7 (-) /13 - SR (5%) Dec.: 3 (-) /13 - SR (10%) |
|
| Mean monthly temperature | March: 13 (+)/14 – SR(5%) April and May: 12 (+)/14 – SR(5%) June: 16 (+) / 14 – SR(5%) |
March, April, May, June: 13 (+) /13 – SR(5%) July: 1 (+)/13 – NSR Aug.: 10 (+)/13 – SR(5%) Oct.: 7 (+)/13 – SR (10%) |
| Monthly PET | NA | Feb. and March: 10 (+)/13 – SR (5%) April: 4 (+)/13 – NSR May: 8 (+)/13 – SR (5%) June: 11 (+)/13 – SR (5%) July: 1 (+)/13 – NSR Aug.: 3(+)/13 – NSR Sept. and Oct.:1 (+)/13 – NSR |
Tendance linéaire entre 1970 et 2006, ajustée sur chaque série mensuelle SAFRAN où des changements significatifs ont été détectés sur cette période. Chaque colonne correspond à un bassin versant, la légende des bassins versants est la même qu’en Fig. 1.
| BV1 | BV2 | BV3 | BV4 | BV5 | BV6 | BV7 | BV8 | BV9 | BV10 | BV11 | BV12 | BV13 | ||
| Pluie mensuelle (mm/an) | Juin | –0.56 | –1.01 | –0.94 | –0.76 | –1.45 | –0.7 | –0.69 | –0.72 | –0.57 | –0.56 | –0.60 | ||
| Novembre | 1.32 | 1.75 | 1.89 | 2.43 | 1.91 | 2.17 | 2.64 | 2.59 | 1.78 | 1.62 | 1.91 | |||
| Nombre de jours secs/mois/an | Mars | 0.16 | 0.18 | 0.15 | 0.14 | 0.16 | 0.05 | 0.13 | 0.16 | 0.17 | 0.11 | 0.15 | ||
| Novembre | –0.14 | –0.15 | –0.17 | –0.16 | –0.18 | –0.16 | -0.14 | –0.22 | –0.11 | –0.16 | ||||
| Décembre | –0.09 | –0.11–0 | –0.09 | –0.11–0 | –0.16 | –0.07 | –0.07 | -0.07 | –0.11 | –0.14 | ||||
| Mars | 0.08 | 0.08 | 0.08 | 0.08 | 0.06 | 0.05 | 0.09 | 0.06 | 0.06 | 0.06 | 0.06 | 0.05 | 0.05 | |
| Température moyenne mensuelle (̊C/an) | Avril | 0.04 | 0.05 | 0.06 | 0.06 | 0.05 | 0.04 | 0.06 | 0.05 | 0.04 | 0.04 | 0.04 | 0.04 | 0.03 |
| Mai | 0.07 | 0.08 | 0.08 | 0.08 | 0.07 | 0.06 | 0.08 | 0.07 | 0.06 | 0.06 | 0.06 | 0.06 | 0.06 | |
| Juin | 0.09 | 0.09 | 0 09 | 0 09 | 0 08 | 0 07 | 0.070 | 0 08 | 0.07 | 0.07 | 0.07 | 0.07 | 0 07 | |
| Aout | 0.04 | 0.05 | 0.05 | 0.06 | 0.05 | 0.05 | 0.06 | 0.05 | 0.04 | 0.04 | ||||
| Octobre | 0.04 | 0.04 | 0.04 | 0.05 | 0.04 | 0.05 | 0.05 | |||||||
| ETP mensuelle (mm/an) | Février | 0.20 | 0.20 | 0.18 | 0.14 | 0.16 | 0.16 | 0.17 | 0.30 | 0.14 | 0.21 | |||
| Mars | 0.44 | 0.38 | 0.32 | 0.28 | 0.310 | 0.27 | 0.27 | 0.51 | 0.31 | 0.38 | ||||
| Mai | 0.54 | 0.48 | 0.540 | 0.45 | 0.86 | 0.53 | 0.52 | 0.68 | ||||||
| Juin | 0.73 | 0.59 | 0.45 | 0.43 | 0.53 | 0.44 | 0.51 | 0.90 | 0.58 | 0.59 | 0.76 |
In parallel, the number of days per month without precipitation has decreased significantly by 5 to 6 days in November in the 36 years. This suggests that the increase in monthly rainfall in November might be associated with an increase in rainfall events rather than in their intensity, as no change is observed in extreme daily precipitation during the concerned month (Pujol et al., 2007). Considering precipitation in snow and liquid form, the two trends remain unchanged; this is obvious for June and also applies to November. Precipitation occurrence displays a significant decrease in March but the trends in cumulated monthly figures are not significant.
The increase in temperatures is seen above all in the spring and early summer, from March to June, and is not detectable in the winter months. The mean trend in the zone in the spring is +0.7 °C to +0.8 °C per decade. As for precipitation, the trends identified in the various types of measurement are consistent and concern all 13 catchments. The SAFRAN measurements also display an upward trend extending in summer until August, except in the upstream part of the Têt at Serdynia, where the trend is less marked at some +0.5 °C per decade. A significant increase in temperature is noted in October. This is an average of +0.4 °C per decade in the concerned catchments but only affects the southern and eastern part of the zone; the Têt at Marquixanes and the Agly upstream of Caramany are not affected.
Significant changes in monthly PET are observed above all in February, March, May and June, with the increase observed in 8 to 10 out of the 13 catchments. The trend in average monthly PET in the concerned catchments varies from +0.2 mm per year in February to +0.6 mm per year in June. In summer, the increase in PET in July and August is not significant at the regional scale and remains very local in the upstream Têt at Mont-Louis and in the Verdouble at Tautavel. Overall, the spatial organisation of monthly trends agrees with that observed at the annual scale.
5 Discussion - conclusion
This work is aimed at seeking the existence of changes in the data series of climatic variables that might affect water resources in a Mediterranean region whose present and future development depends very strongly on these resources. Precipitation, temperature and PET were analysed at the annual and monthly scales using a sample of direct ground measurements and spatialized indirect data from the SAFRAN analysis system. The MK test was applied locally to each data series and also at a regional scale to evaluate the regional significance of the detected local changes. The test can detect a monotonic change in a series, but not breaks, a hypothesis which seems acceptable for this study on climate change.
Significant changes at the annual scale were observed in average annual temperatures and PET, whereas no change in precipitation was observed at this scale. The changes in temperature detected are consistent between data sources and with observations made at the French national scale (Moisselin et al., 2002) and that generally also apply to the whole planet (IPCC, 2007). The +1.1 °C to +1.5 °C amplitude in trends in annual temperatures from 1970 to 2006 in the study area is consistent with (Lespinas, 2008) who observed an increase of 1.4 °C from 1965 to 2004 in Languedoc-Roussillon using ground measurements spatialised by catchments. He also highlighted an increase in warming from 1970 onwards. It is noted that annual warming seems more marked in this zone than for the average of the northern hemisphere, where Brohan et al., (2006) report a trend of +0.33 °C per decade from 1979 to 2005.
The absence of trend in annual precipitation agrees with the conclusions of (Pal and Al-Tabbaa, 2009), who did not observe any significant trend in annual totals for the whole Mediterranean area from 1950 to 2000, and those of (Lespinas, 2008) who focused on the main coastal catchments in Languedoc-Roussillon.
However, analysis of the changes in annual series hides different behaviours at the monthly scale. For precipitation, this results above all in a decrease in monthly-cumulated figures in the summer, especially in June, and an increase in the autumn, especially in November. These results are in agreement with those of Lespinas, 2008; Moisselin and Dubuisson, 2006; Moisselin et al., 2002. It is also noted that the most significant changes in monthly temperatures are observed in the spring and affect the whole study zone.
The seasonal variability in temperatures shown by Ludwig et al., 2004 for the Têt seems less visible here. The decrease that they detected in the autumn from 1980 to 2000 is not a strong feature. In contrast, an increase in average temperature in November was observed in this study, concentred in the downstream part of the catchments, whereas no significant trend was observed upstream or during the other autumn months.
Similarly, the variability in precipitation reported by Ludwig et al., 2004 in the Têt catchment was not observed in the present work. Indeed, the decrease in precipitation depths in the upstream part of the catchment and the increase in the central part were not observed in any of the catchments. However, monthly precipitation has decreased practically everywhere in June and is significant at the regional scale, except in the upstream part of the Têt, and the increase in cumulated figures for November also seems particularly significant and applies to the whole zone.
The trends observed in monthly PET do not seem to be related to those for temperatures. At the annual scale, the coastal subcatchments are more affected by a rise in annual average temperature but are little or not affected by an increase in annual PET. Significant upward trends in monthly temperatures in April, August and October are observed at the monthly scale whereas no trend is seen in monthly PET for the same months. Likewise, a small but significant trend in February is estimated to be an average of +0.2 mm per year in the studied area. It concerns 10 out of the 13 catchments whereas no significant trend was detected in monthly temperatures. One explanation is that PET is calculated using the Penman–Monteith formula and is based not only on temperature but also on relative humidity, solar radiation and wind speed. Our observations are probably related to changes in large-scale atmospheric movements, dominated essentially by the North Atlantic Oscillation (Yiou and Masson-Delmotte, 2005), even though it would seem that other factors such as variation in solar forcing should not be ruled out (Le Mouël et al., 2008).
Finally, it is difficult to quantify the influence of the detected changes on the water resources in the region, and especially ground water (used in priority for drinking water supply in the region). The increase in PET and temperature and the decrease in rainfall, especially in May and June, tend to cause soils to dry and can therefore have a negative impact on groundwater resources. However, rainfall volumes peak in the autumn in the Mediterranean region, when rainfall increases and PET changes little. This would tend to increase aquifer recharge, compensating for the observed summer drying. It is therefore necessary to model the aquifers behaviour in order to understand the possible impacts of the observed changes and of future climate change on groundwater resources.
This study shows the significant regional changes in time series of temperature, PET and precipitation data available for the last 36 years at the annual and monthly scales. However, a descriptive approach has been used and the observed trends cannot be extrapolated beyond the observation period for the construction of future climate scenarios. This requires the use of climate models as these are the only tools that can propose scenarios of future changes to study the impact of climate change on the region water resources, with the incorporation of various hypotheses on socio-economic evolution (this is the aim of the ongoing VULCAIN project of which this work is part). However, the observed trends show that the warming observed at the global scale displays marked seasonality (in our study site, visible above all in the spring and summer as regards temperature and PET and in the autumn for precipitation). Using these trends to gain understanding on the way in which ecosystems have reacted to these changes could help the design of more robust adaptation strategies to climate change.
Acknowledgements
The VULCAIN project to which this study belongs is funded by the Agence nationale de la recherche (ANR, French National Research Agency) within the framework of its VMC (Vulnérabilité: Milieux et Climat) project.
The authors thank Météo-France for providing the meteorological data and the three reviewers (Pr. P. O’Kane, P. Hubert and one anonymous) for their constructive comments.