

1 Introduction
Sea surface temperature (SST) in the tropical Indian Ocean varies significantly at interannual time scales. This variability is dominated by an Indian Ocean basin mode and dipole mode. The Indian Ocean basin accounts for about 30% of the total variance of the tropical Indian Ocean SST anomaly (Yang et al., 2010). Murtugudde and Busalacchi (1999) simulated the interannual variability of the tropical Indian Ocean SST. The tropical Indian Ocean is influenced by two contrasting air masses (continental and marine) associated with the Indian monsoon system (Li and Ramanathan, 2002). The summer monsoon (southwest monsoon) usually starts by the end of May and continues until November. The winter or northeast monsoon rainfall, which occurs mainly from October to December, is dominant over southern peninsular India, consisting of the six meteorological subdivisions, coastal Andhra Pradesh, Rayalaseema, south interior Karnataka, coastal Karnataka, Tamilnadu, and Kerala (Rao, 1999) (Fig. 1). The winter circulation prevails for the six months from November to April. May and October are the transitional months (Ananthakrishnan, 1977). During summer monsoon, winds are mainly southwesterly or westerly and during winter monsoon, the prevailing winds are mostly northeasterly. The southwest (summer) monsoon (SWM) and the northeast (winter) monsoons (NEM) influence weather and climate between 30oN and 30oS over the African, Indian, and Asian land-masses (Reddy and Salvekar, 2003). Accurate long lead prediction of monsoon rainfall can improve planning to mitigate the adverse impacts of monsoon variability and to take advantage of the beneficial conditions (Reddy and Salvekar, 2003). The variability in the monsoon rainfall depends heavily upon the SST anomaly over the Indian Ocean (Clark et al., 2000). Several authors, for example Barsugli and Sardeshmukh (2002), Branstor (1985), Clark et al. (2000), Guo et al. (2002), Hartmann et al. (2007), Lau and Weng (2001), Nicholls (1983) have discussed the association between SST anomaly and rainfall. The SST anomalies cause local changes in the low-level temperatures, winds, and humidity, usually leading to precipitation anomalies in the vicinity of the SST anomaly (Barsugli and Sardeshmukh (2002)). Gradients of SST within the oceans are important in determining the location of precipitation over the Tropics, including the monsoon regions (Clark et al., 2000).

Map of southern India where winter or northeast monsoon rainfall is prominent.
Carte du Sud de l’Inde où les précipitations de la mousson d’hiver ou du nord-est prévalent.
As the extra tropical circulation anomalies display energy dispersion away from the region of anomalous tropical convection, they are interpreted as a Rossby wave response to the latent heat release associated with the tropical convection (Ferranti et al., 1990). In regions of anomalous tropical heating, there is a dynamical response with anomalous large-scale ascent and upper tropospheric divergence, which acts as a Rossby wave source (Sardeshmukh and Hoskins, 1988) for extra tropical waves. Conversely, in regions of reduced convection and anomalous cooling, the tropical responses are the anomalous descent and upper-tropospheric convergence (Matthews et al., 2004). Positive (negative) SST anomalies lead the enhanced (suppressed) MJO convection by approximately 10–12 days (a quarter cycle), consistent with the atmosphere responding to the ocean forcing (Matthews et al., 2004). The SST anomalies themselves have been simulated in thermo dynamical ocean models as the response to the observed anomalous surface fluxes of latent heat and short-wave radiation (Matthews et al., 2004; Shinoda and Hendon, 1998) without the need to a mass flux approach and closed on buoyancy. SST anomalies has been addressed by Woolnough et al. (2000), who examined the equilibrium response to an idealized, eastward-propagating equatorial SST dipole anomaly in an “aquaplanet” atmospheric general circulation model (AGCM).
The SST anomalies influence the atmosphere by altering the flux of latent heat and sensible heat from the ocean (Holton, 1972). The efficiency of such anomalies in exciting global scale responses depends on their ability to generate Rossby waves. In the extra tropics SST, anomalies primarily generate low-level heating and this is balanced by horizontal temperature advection. In the tropics, positive SST anomalies are associated with enhanced convection and the resulting heating is balanced by adiabatic cooling. SST anomalies also play an important role in producing rainfall (Reddy and Salvekar, 2003). Linkage between Asian winter monsoon and SST anomalies over tropical Indian Ocean is discussed in the papers like Annamalai et al. (2005), Yang et al. (2010) and the linkage between Asian winter monsoon and SST anomaly in the tropical Pacific is discussed in Wen et al. (2000).
El-Niño-Southern Oscillation (ENSO) is a coupled Ocean-atmosphere phenomenon that has worldwide impact on climate in general and Indian monsoons in particular and the association between ENSO and Indian monsoon rainfall has been thoroughly studied in Krishnamurthy and Goswami (2000), Wu and Kirtman (2004) and Xavier et al. (2007).
The long-recognized negative correlation between Indian monsoon rainfall and ENSO (Webster and Palmer, 1997) in which a weak (strong) monsoon is related to a warm (cold) event through an anomalous Walker cell driven by tropical East Pacific SST anomalies, has weakened rapidly since the late 1970s (Chang et al., 2001). This weakened relationship is defined by the correlation between June and September all-India rainfall and Niño-3 (5°S–5°N, 150°–90°W) SST (Chang et al., 2001; Qiaoping et al., 2007). A handful of significant studies are available where the relationship between SST and rainfall has been studied (e.g. Nobre and Srukla, 1996; Uvo et al., 1998). Chongyin (1990) investigated the relationship between El-Nino event and NEM over South-East Asia.
The oscillations in wind stress owing to the Southern Oscillation are associated with changes in the circulation of the ocean and the SST anomaly that are referred to as El-Nino. This term was originally applied to a warming of the coastal waters of Peru and Ecuador, which occurs annually near Christmastime. ENSO's maximum SST anomalies occur in the equatorial eastern and central Pacific, ENSO affects the global ocean (Wang et al., 2006). Outside the tropical Pacific significant ENSO related SST anomalies are found over many places, such as in the tropical North Atlantic, the tropical Indian Ocean, the extratropical North and South Pacific, and the South China Sea (Deser et al., 2004; Klein et al., 1999). The strength of ENSO is measured by two principle indices namely Southern Oscillation Index (SOI) and SST index over Nino-3.4 region, which refers to, the anomalous SSTs within the region bounded by 5oN–5oS and 170oE–120oW. Warm ENSO episodes are characterised by increased number and intensity of tropical storms over the Bay of Bengal and hence enhanced NEM rainfall. An analysis of mean monthly data of 124 years by Bhanu Kumar et al. (2004a) reveals that the relationship between the SOI in April and May and the NEM rainfall during October through December over South India is variable and non stationery.
Present paper attempts to develop a predictive model for NEM over India using SST anomaly as one of the predictors. Some significant studies in the field of NEM over East Asia and its association with SST anomalies have been reviewed. The literatures include Qiaoping et al. (2007), Wen et al. (2000) and Zhang et al. (1997) . A handful of works are available on the prediction of SWM over India (e.g. Guhathakurta, 2008; Sahai et al., 2000; Venkatesan et al., 1997 and many others). However, limited studies could be identified where prediction of NEM rainfall over India has been discussed. During the NEM season, southern peninsular India receives dominant rainfall. Nayagam et al. (2009) studied spatial and temporal variability of rainfall over Peninsular India during NEM. Bhanu Kumar et al. (2004b) established a probable link between mean September upper-air temperatures at Indian stations and the ensuing winter monsoon rainfall over eight individual meteorological subdivisions of southern India where the winter monsoon accounts for a large percentage of mean annual rainfall. During the season of NEM, India receives about 11% of its annual rainfall, while many of the above subdivisions receive 17–49% of their annual rainfall. Major agricultural operations in this southern part of the country are normally undertaken during this season. The winter monsoon rainfall is of considerable economic importance for this region, which constitutes about 15% of the Indian subcontinent (Rao, 1999). Rao (1963) provided a detailed description of the Indian NEM. Dhar and Rakhecha (1983) examined the association between the SWM and NEM rainfall over Tamilnadu for the 100-years period (1877–1976) and found that the SWM rainfall is negatively correlated with that of the northeast monsoon. Singh (1995) studied the influence of Bay of Bengal on NEM rainfall in two contrasting winter monsoon years 1987 and 1988. Similarly, Raj (1996) studied the thermodynamic structure of the atmosphere over coastal Tamilnadu during the NEM season. Deviating from these works, Rao (1999) examined the sub divisional and time variations of the SO relationship with the rainfall over India during summer as well as winter monsoon seasons, by using long time data for the 122-years period from 1872 to 1993.
In the present work, we decided to generate a predictive model for rainfall during NEM over India. From the above discussion and the literatures mentioned in the earlier paragraphs we felt the necessity of incorporating SST anomaly as a predictor. Since artificial neural network (ANN) is being attempted in several papers dealing with complex non-linear meteorological events (e.g. Elsner and Tsonis, 1992), we decided to attempt an ANN in this problem. The subsequent sections are organized as follows: section 2 discusses some literatures in the application of ANN in rainfall prediction. Section 3 describes the structure of the time series considered in the study. Section 4 describes theory, implementations details, and statistical assessment of the ANN and non-linear regression based models. The conclusion is presented in Section 5.
2 Artificial Neural Network in rainfall prediction – a brief overview
Accurate rainfall predictions are essential for planning day-to-day activities. Several papers are available where the rainfall time series have been dealt with statistically (Bell and Suhasini, 1994; Singh and Kripalani, 2007; Ward and Folland, 1991; Wilks, 1991). Present paper endeavours to develop an ANN model to forecast average winter shower in India. The ANN technique is widely accepted as a potentially useful way of modeling complex non-linear and dynamic systems for which a large amount of data is used (Hornik, 1991; Hsieh and Tang, 1998). It is particularly useful, where the underlying physical processes or relationships are not fully understood or may display chaotic properties (Sivakumar, 2000). Conventional weather forecasting models are highly data specific and based on complex and expensive to maintain mathematical models that are built many months in advance of the events. ANN offers real prospects for an effective, more flexible, less assumption dependent adaptive methodology well suited for modeling weather forecasting which by its nature are inherently complex because of non-linearity and chaotic effects (Maqsood et al., 2002). The ANN is based on biological neural systems (Kartalopoulos, 2000). It is highly vital with respect to underlying data distribution and no assumptions are made about relationships between variables. The basic unit of ANN is the artificial neuron, which stimulates the four basic functions of natural neurons. The artificial neurons are much similar than biological neuron. The input layers consist of neurons that received input from the external environment. The outputs of the system layer communicate to the user about the external environment. There are usually numbers of hidden layers between these two layers. To determine the number of hidden neurons the network should have performed its best, are often left out to the method trial and error. Usually the available data are separated into training set and test set. The optimal weights are obtained by using ‘Back Propagation’. The quality of the prediction is obtained from the performance with the test set of data. The weights are determined by iteration to produce the lowest error in the output. Initial weights are randomly assigned in subsequent iterations, individual weights are incrementally adjusted to reduce error (Kamarthi and Pittner, 1999).
Since the last few decades, ANN has opened up new avenues to the forecasting task involving atmosphere related phenomena (Gardner and Dorling, 1998; Hsieh and Tang, 1998). Michaelides et al. (1995) compared the performance of ANN with multiple linear regressions in estimating missing rainfall data over Cyprus. Kalogirou et al. (1997) implemented ANN to reconstruct the rainfall time series over Cyprus. Lee et al. (1998) applied ANN in rainfall prediction by splitting the available data into homogeneous subpopulations. Wong et al. (1999) constructed fuzzy rule bases with the aid of SOM and Back propagation neural networks and then with the help of the rule base developed predictive model for rainfall over Switzerland using spatial interpolation. Application of ANN in forecasting monsoon rainfall over India is not very new. We have surveyed the literature and could get some significant papers in this direction. Chattopadhyay (2007), Chattopadhyay and Chattopadhyay (2010a); Guhathakurta (2008); Sahai et al. (2000); Venkatesan et al. (1997) implemented ANN based methodologies in prediction of SWM rainfall over India. Iyengar and Raghu Kanth (2005) decomposed the Indian monsoon rainfall time series into six intrinsic mode functions, and handled the non-linear part by ANN technique. In a study by Singh and Deo (2007) alternative forms of neural networks have been applied to forecast daily river flows on a continuous basis with the purpose of understanding how recent architectures like adaptive neuro fuzzy inference system (ANFIS), generalized regression neural network (GRNN) and radial basis function (RBF) and compared with traditional back propagation ANN, when monsoon-fed rivers involving significant statistical bias are involved. Banik et al. (2008) used ANN, ANFIS, and genetic algorithm (GA) for forecasting Bangladeshi monsoon rainfall and their findings suggest that ANFIS and GA approaches can be used more accurately than the other two selected approaches to forecast the Bangladeshi monsoon rainfall. Chakraverty and Gupta (2008) modelled southwest monsoon rainfall over India using ANN with different network configurations and predicted Indian southwest monsoon rainfall 6 years in advance. Karmakar et al. (2009) developed 3-layer perceptron feed forward back propagation ANN model on mean rainfall variable of 102-rainguage station of Chhattisgarh, India.
3 Autocorrelation structure of the time series
The existence of autocorrelation in meteorological and climatological data has important implications regarding the applicability of some standard statistical methods to atmospheric data. In particular, uncritical application of classical methods requiring independence of data within a sample will often give badly misleading results when applied to strongly persistent series (Wilks, 2006, page 59). The present article deals with the monthly average winter shower data and the SST anomaly data from 1950 to 1998. The rainfall and SST anomaly data have been collected from www.tropmet.res.in and http://jisao.washington.edu/. The winter shower (mm) and tropical SST anomaly (oC) has been examined for their autocorrelation pattern. We have calculated autocorrelation function (ACF) for the average (over November-January) rainfall time series up to 25 lags and displayed in Fig. 2a. This figure shows that the ACF does not follow any specific sinusoidal pattern and the autocorrelations fall below 0.3 in numerical value. Moreover, the ACF is not decaying to 0 with increase in the lag number. These features of the ACF indicate that the time series does not have any persistence and it is not stationary in nature. The ACF of the average NEM rainfall has been examined because this is the prediction of the modeling problem. The monthly rainfall amounts in November, December, and January are also examined for their ACF and similar nature is discerned (Fig. 2b-d). Similarly, the ACF are calculated for tropical SST anomaly in the said months (Fig. 3a-c) and it is revealed that ACF for the SST time series are remaining at positive level up to more than 10 lags. However, the ACF is lying below 0.5 in magnitude. This indicates that despite more positive association with past values than the NEM rainfall no persistence exists within the time series. Like the rainfall time series, the ACF for SST anomaly is not showing any sinusoidal pattern and hence it can be said that stationarity is not there with the SST anomaly time series. Thus, it can be said that neither the time series of the predictors (i.e. rainfall amounts and SST anomaly in November, December, and January for year n) nor the time series of the predictand (i.e. average NEM rainfall for year (n + 1)) exhibits stationarity. The non-linear association between the predictors and the predictand is also apparent from the widely distributed data clouds in the scatterplot matrix presented in Fig. 4. The scatterplot matrix, which shows the arrangement of individual scatterplots, is a graphical extension of the correlation matrix. The physical arrangement of the correlation coefficients in a correlation matrix is convenient for quick comparisons of relationships between pairs of variables, but distilling these relationships down to a single number such as a correlation coefficient inevitably hides important details (Wilks, 2006, page 65). In the scatterplot matrix presented in Fig. 4, it is found in all rows and columns that there is no linear association between the SST anomalies and the NEM rainfall amounts. It is apparent from the absence of any straight line like clouds of data pairs in the scatter diagrams. Even in the case of rainfall amounts or SST anomalies, there are no linear associations between the monthly observations. In Fig. 5, we have calculated the cross-correlation functions (CCF) between average SWM rainfall time series and SST anomalies for the three winter months under consideration. We have calculated by taking the predict and (average NEM rainfall) as fixed time series and time shifting the SST anomaly data set relative to the predictand. It is observed that there is no symmetry in the CCF plot about the horizontal (lag k) axis. This indicates that there is stable relationship between the two time series under consideration. Moreover, none of the cross coefficients are showing any high value, which indicates that there is no strong association between SST anomalies and NEM rainfall amounts. Computation of cross correlation has been performed using the software citable as Wessa (2010). The ACF, scatterplot, and CCF strongly indicate the requirement of ANN in the present prediction problem.
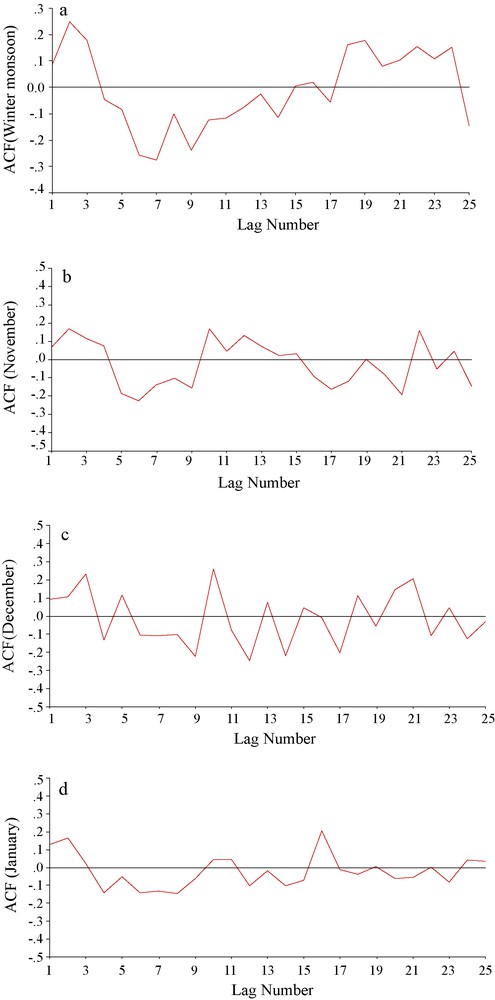
(a). Autocorrelation function (ACF) for rainfall averaged over November, December, and January in India and during November (b), December (c), and January (d) over India.
(a). Fonction d’auto-corrélation (ACF) pour la pluviosité moyennée sur novembre, décembre et janvier en Inde et pendant les mois de novembre (b), décembre (c) et janvier (d) sur l’Inde.
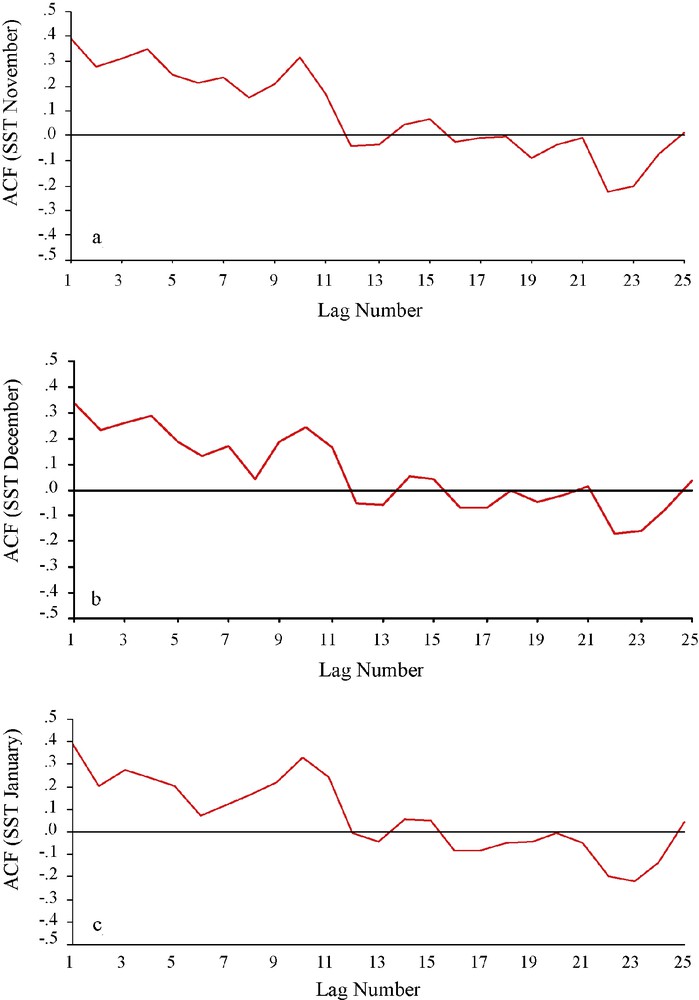
Autocorrelation function (ACF) for tropical sea surface temperature (SST) anomaly during November (a), December (b), and January (c).
Fonction d’auto-corrélation pour l’anomalie de température de la surface océanique (SST) tropicale pendant les mois de novembre (a), décembre (b) et janvier (c).
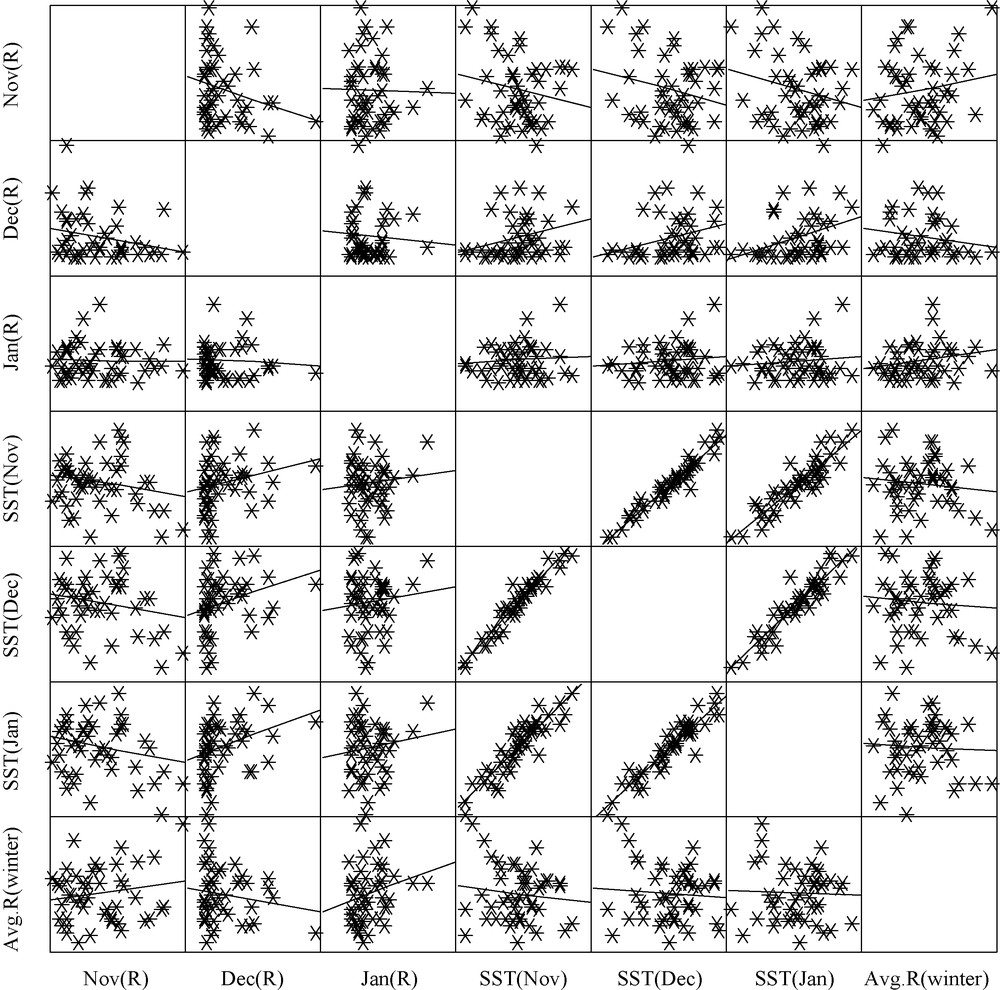
Scatterplot showing the association between pairs of data considered in the study.
Diagramme de points montrant l’association entre paires de données considérées lors de l’étude.

The cross correlation function (CCF) between the average monsoon rainfall time series and SST anomalies for November (a), December (b) and January (c).
Fonction de corrélation croisée (CCF) entre les séries temporelles moyennes des précipitations de mousson et les anomalies de température de la surface océanique (SST) pour les mois de novembre (a), décembre (b) et janvier (c).
4 Theory
4.1 Multiple non-linear regression
Initially, all of the six predictors are tested over time for their trend. Linear as well as non-linear (polynomial of degree 6) trend equations (Wilks, 2006) are examined and the corresponding coefficients of determination (R2) are calculated. We have presented the values of R2 in Table 1, which shows that in all of the cases the values are small. This indicates the absence of any significant trend within the time series of all of the predictors. In the previous section, the non-stationarity of the time series under study has been revealed. It is also understandable from the ACF patterns that there are no seasonality and trend in the time series. Non-linear regression equations are now generated to discern the relationship between the predictors and predictands. A non-linear regression equation involving exponential terms is generated as follows (Chattopadhyay and Chattopadhyay, 2008a):
| (1) |
Coefficient de détermination (R2) des tendances linéaire et polynomiale.
| Parameters | R2 for linear trend | R2 for polynomial trend (degree 6) |
| November-SST | 0.0029 | 0.1725 |
| December-SST | 0.0026 | 0.1592 |
| January-SST | 0.0052 | 0.1241 |
| November-shower | 0.0057 | 0.1837 |
| December-shower | 0.0822 | 0.1574 |
| January-shower | 0.024 | 0.0466 |
The regression parameters are estimated using Levenberg-Marquardt algorithm and iterating up to 500 steps. Finally, the regression parameters come out to be 0.355 , 0.031 , 4.705 , 0.018 , 2.505 , 0.056 , 4.730 , 0.001 , 3.343 , 0.001 , 3.480 , and 0.002 . The results would be analyzed statistically in the subsequent sections.
4.2 Artificial Neural Network
In the present paper, the data have been transformed to before applying them to ANN formation using the transformation
| (2) |
This transformation is performed to get rid of the asymptotic effect arising from the sigmoid activation function to be used in the ANN model. A thorough discussion on the usefulness of scaling of data prior to ANN model generation is presented in Section 5 of Maier and Dandy (2000). An exhaustive variable selection procedure is adapted to find a good subset of the full set of input variables created as a result of data analysis and transformation. This selection has been done by means of genetic algorithm, where the cross over probability and mutation factor has been selected as 0.7 and 1, respectively, while generating the ANN model in the form of multilayer perceptron (MLP), using a modified cascade method together with an adaptive gradient learning rule (Lundin et al., 1999). The cascade mode of construction involves adding hidden nodes, one or more than one at a time, and always connecting all the previous nodes to the current node. The Cascade-Correlation architecture has several advantages over existing algorithms: it learns very quickly, the network determines its own size and topology; it retains the structures it has built even if the training set changes (Fahlman and Lebiere, 1990).
The adaptive gradient learning rule uses back-propagated gradient information to guide an iterative line search algorithm. Sigmoid function () (Widrow and Lehr, 1990) has been used as activation function for both hidden and output layer. From the entire dataset under consideration, we have chosen 70 percent of the original data as training set. The training set formation has been done using the method of Round Robin (O’Neill and Song, 2003), which is an arrangement of choosing all elements in a group equally in some rational order, usually from the top to the bottom of a list and then starting again at the top of the list and so on. The root mean squared error (RMSE) has been used to evaluate the model. After training, the network has been validated over the entire dataset. It should be mentioned that there is no strict rule to decide the ratio of training and test cases. In a survey on the ANN literatures it is found that the ratios 1:1 (Chattopadhyay and Chattopadhyay, 2008b), 7:3 (Lundin et al., 1999), and 3:1 (Perez et al., 2000, Perez and Reyes, 2001) are frequently used in ANN applications. In the present paper the approach similar to that of Lundin et al. (1999) has been adopted after examining the other approaches. The ANN has been validated over the entire dataset under consideration. We have started with 30 nodes in the hidden layer and after training through adaptive gradient learning, we have obtained the final structure of the MLP as 5-12-1. It should be noted that this is the optimal architecture of the ANN. Number of hidden nodes has reduced to 12 because this has led to the minimum mean squared error. The error curve showing the evolution of the mean squared error with the number of epochs is shown in Fig. 6. This implies that there are five units (it is reduced from six due to exhaustive variable selection) in the final input set, twelve nodes in the final hidden layer, and there is only one output node. Results obtained from this network architecture are explained in the subsequent section.

Evolution of the mean squared error with epochs while training the artificial neural network (ANN).
Évolution de l’erreur quadratique moyenne pendant le déroulement du réseau neuronal artificiel (ANN).
4.3 Statistical assessment
In the present section, the results obtained in the last two sections would be analyzed. A confusion matrix (Fielding and Bell, 1997), whose rows and columns represent the sub-ranges for the real world target and model outputs respectively, has been generated to view the prediction capacity of the ANN model. The value in the (i,j) position of the matrix is the number of records for which the real world target output is in the ith sub-range and whose real world model output is within the jth sub-range. The confusion matrix for the ANN prediction comes out to be:
| Actual sub ranges | |||||||
| Confusion matrix | 4.23 | 13.13 | 22.02 | 30.91 | 39.81 | Totals | |
| Predicted sub ranges | 4.23 | 2 | 8 | 0 | 0 | 0 | 10 |
| 13.13 | 2 | 10 | 3 | 1 | 0 | 16 | |
| 22.02 | 0 | 4 | 8 | 0 | 0 | 12 | |
| 30.91 | 0 | 1 | 2 | 2 | 1 | 6 | |
| 39.81 | 0 | 0 | 2 | 0 | 1 | 3 | |
| Total | 4 | 23 | 15 | 3 | 2 | 47 |
From the above matrix, it is found that for the sub range (4.23 mm to 13.13 mm) there are actually 23 observations and 16 predictions fall in this sub range. Thus, 69.57% accuracy is there for this sub range. For the sub range 13.13 mm to 22.02 mm, there are actually 15 observations and 12 predictions fall in this sub range. This means that there is 80% accuracy for this sub range. Thus, it can be interpreted that for higher NEM rainfall amounts there is more possibility of accurate forecast by ANN than in the case of lower rainfall amounts. Following Kuligowski and Barros (1998), we call the error of underforecast by dry bias and subsequently over forecast by wet bias. It is observed that there is lower possibility of dry bias than wet bias, which indicates that the model tends to overforecast precipitation amount in some validation cases. This may be due to the presence of some heavy rainfall events during training of the ANN.
In the next step, the predictions are judged using the scatter plot matrix presented as Fig. 7, where it is apparent that the data cloud is well distributed around the linear trend line, thus it is understood that there is a good linear association between the actual and the ANN predicted values, which is further supported by the correlation coefficient of 0.641. However, the values deviated significantly from the trend line indicate that there are some cases where the prediction performance of the ANN is not satisfactory. Now, the predictions from ANN are judged case wise over the entire validation set. Line diagram presented in Fig. 8 shows the comparison between actual and predicted rainfall amounts for the validation cases. Computing the percentage of errors in the validation cases we find that if maximum 15% error of prediction is allowed, then prediction yield is 0.30. If 20, 25, and 30% errors of prediction are allowed, then the prediction yields are 0.45, 0.55, and 0.62 respectively.
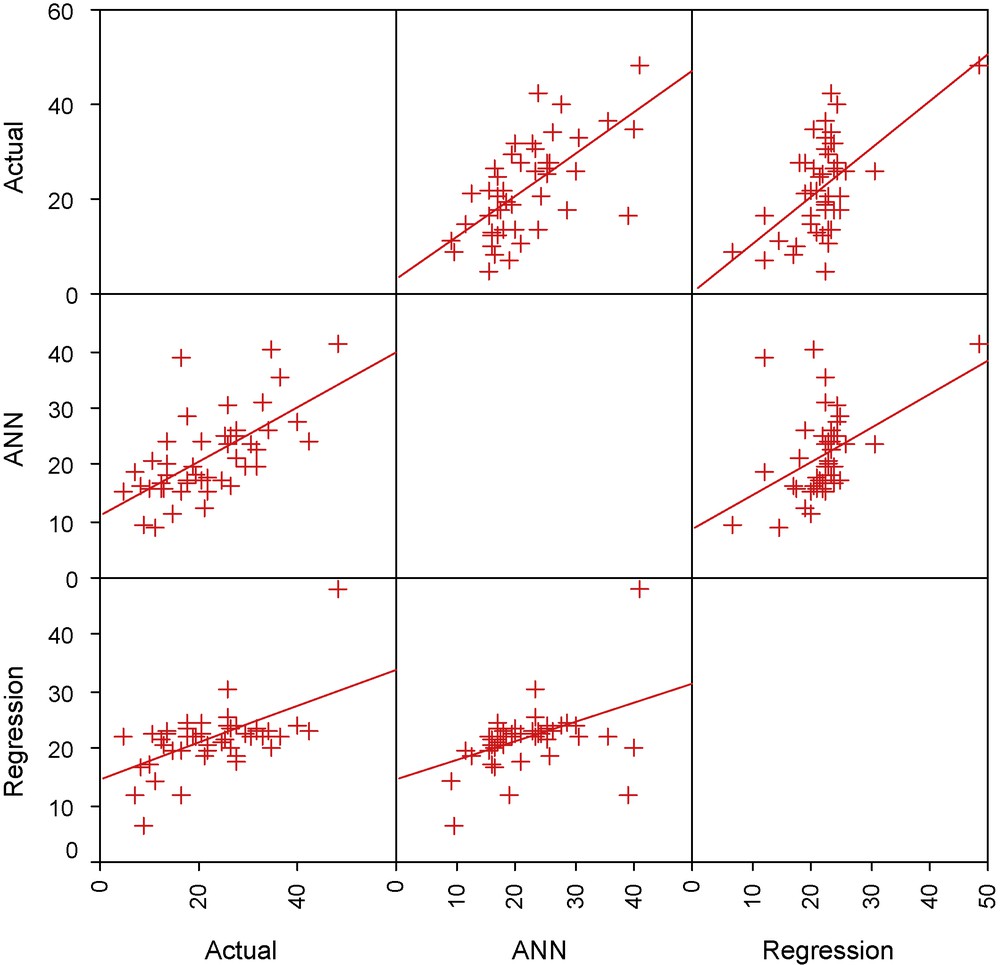
Scatter plot showing the associations between actual rainfall amounts and those predicted by the artificial neural network (ANN) and non-linear regression.
Diagramme de dispersion de points montrant les associations entre teneurs en précipitations actuelles et celles prédites par le réseau neuronal artificiel (ANN) et la régression non linéaire.
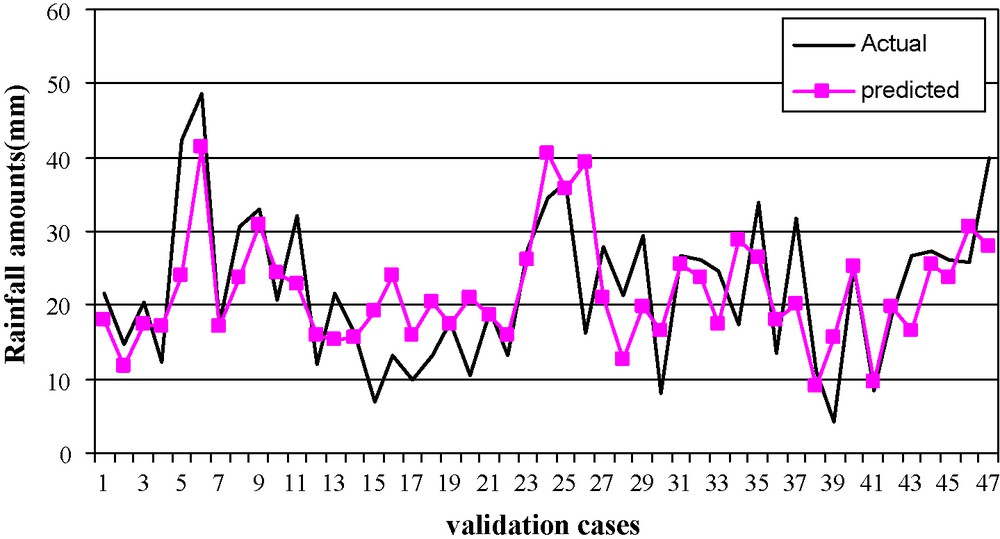
Line diagram of the actual and predicted rainfall amounts for the validation cases of the artificial neural network (ANN).
Tracé linéaire des teneurs en précipitations actuelles et prédites pour les cas de validation du réseau neuronal artificiel (ANN).
Now we consider the predictions from the exponential regression presented in Eq. (1). Observing the scatter plot presented in Fig. 4, we find that there is a near-linear association between actual and regression-predicted values of the rainfall. To test the results statistically we calculate the Willmott's index (WI) for the regression as well as ANN. The Willmott's index is given by (Willmott, 1982):
| (3) |
The utility of WI in judging the predictions has been discussed thoroughly in Chattopadhyay and Chattopadhyay (2008a). In the present case, the WI for non-linear regression and ANN come out to be 0.672 and 0.724 respectively. As the higher value of WI indicates better predictive model, it can be said that the ANN based predictive model performs better than non-linear regression. Further, we calculate percent error of the prediction (PE) given by (Chattopadhyay, 2007):
| (4) |
The predictive model is identified as a good one if the PE is sufficiently small. In the present case, PE for non-linear regression and ANN come out to be 30.96 and 27.16 respectively. This further proves that ANN is performing better than regression in predicting NEM rainfall. Like ANN, the prediction yields are also calculated for the non-linear regression based prediction. It is found that if 15, 20, 25, and 30% errors of prediction are allowed, then the prediction yields are 0.23, 0.30, 0.45, and 0.51 respectively, and each of the prediction yields is less than the corresponding values in the case of ANN. This further proves the better prediction potential of ANN than regression. For better viewing, the values of the statistical parameters are presented in Table 2.
Valeurs des différents paramètres statistiques utilisés pour évaluer le potentiel de régression prédit et les modèles basés sur le réseau neuronal artificiel (ANN).
| Models | Willmott's index | Percentage error of prediction | Prediction yield (for 15% error) | Prediction yield (for 20% error) | Prediction yield (for 25% error) | Prediction yield (for 25% error) |
| Regression | 0.67 | 30.96 | 0.23 | 0.30 | 0.45 | 0.51 |
| ANN | 0.72 | 27.16 | 0.30 | 0.45 | 0.55 | 0.62 |
It should be noted that there may be atmospheric problems where regression may perform better than ANN (e.g. Chattopadhyay and Chattopadhyay, 2010b). The physical mechanism that is behind the better performance of ANN than the exponential regression in the present problem may be the following:
- • there is an unstable relationship (indicated by the cross-correlation function) between the SST anomalies and NEM rainfall, and it is well-established fact that ANN performs better than conventional regression in such cases where underlying processes are difficult to understand;
- • use of cascade mode while training the MLP has its own advantages over the regression approach;
- • as the predictor-predictand relationship is highly non-linear (indicated by the very small correlation coefficient), ANN has proved its well-established prediction potential over a non-linear regression model.
5 Conclusion
The present article dealt with the prediction of NEM rainfall time series over India. The study compared Machine-learning approach namely ANN and a statistical approach namely exponential regression method for forecast of NEM rainfall using SST anomaly as a predictor. The purpose was to predict the average winter-monsoon rainfall using six predictors. To do the same, we considered the rainfall amounts and the SST anomalies for the NEM months of a given year to predict the average NEM rainfall of the next year. Consequently, we had six predictors and one predictand. The study also justified the use of non-linear methods for prediction of rainfall by analyzing autocorrelation structure of the data series. The results showed that ACF neither follows any specific sinusoidal pattern nor the autocorrelations fall below 0.3 in numerical value. These features of the ACF indicate that the time series does not have any persistence and it is not stationary in nature. Thus, highly non-linear trends and absence of any serial correlation in the time series under study prompted us to go for a non-linear regression equation in the form of exponential regression. To compare the results of the non-linear methods i.e. exponential regression and ANN, Willmott's index, Prediction Errors, Yield of Prediction and scatter plots were used. Higher value of Willmott's index for ANN (0.724) as compared to exponential regression (0.672) favours the ANN method for rainfall prediction. Lower value of Prediction Error for ANN (27%) as compared to exponential Regression (30%) recommends ANN approach over the other non-linear methods of prediction of rainfall. Average Yield of Prediction was 11% higher for ANN than regression method. Further, visual inspection of linearity in scatter plots (actual vs. predicted values) for each method using all the cases shows that there is apparently more linearity in ANN method as compared to the regression method hence ANN method should be used for predicting the rainfall. The results obtained in the paper are specifically valid for the data collected for India. In future, there is a scope to apply the similar methodology to other regions in the world and suggest general suitability of ANN over other methods for prediction of rainfall using SST anomaly.
Acknowledgements
The authors wish to thank the anonymous reviewers for their valuable suggestions to enhance the scientific quality of the manuscript.