

1 Introduction
In France, societal expectations for enhanced risk mitigation at hundreds of mining concessions and abandoned cavities (caused by surface subsidence or collapse, changes in surface and subsurface hydrology, water pollution, gas emission, etc.) have drastically changed since the late 1990s. The catastrophes that took place in 1996 and 1998 in a few cities affected by large-scale ground failures clearly posed a major challenge to both central and local authorities. These bodies then developed and introduced a coherent risk assessment and management strategy to deal with post-mining risks. This strategy relies on a complete step-by-step assessment of post-mining risks at a national scale. Areas classified as having a high, or unacceptable, level of risk are then required to adopt a risk-reduction policy based on prohibiting construction and lowering the dangers associated with surface infrastructure and human activity. In many cases, the potential social and economic impacts require a monitoring of hazardous underground cavities. This consists in implementing early-warning systems to predict a disaster, and enable timely actions for public safety. Until now, in high-risk areas, the microseismic technique has been the most successful in providing very sensitive volumetric monitoring over extensive urbanized areas (Couffin et al., 2003; Senfaute et al., 2000). However, the lack of any feedback from adequately-instrumented ground collapses has not allowed researchers to answer basic questions concerning early-warning signs and the mechanisms and dynamics of failure (Contrucci et al., 2010; Tastet et al., 2007), although numerical modeling approaches have provided some insights into these issues (e.g. Al Heib et al., 2001; Bérest et al., 2008; Dris et al., 2008).
It is in this context that the Cerville-Buissoncourt experiment was undertaken by the partners of GISOS, a scientific consortium including the government research organizations INERIS, BRGM, and LAEGO, in collaboration with the Solvay mining company. This experiment consists of the field monitoring of a solution mine in the Lorraine salt basin, south of Nancy, France (Driad-Lebeau et al., 2008; Mercerat, 2007).
In this article, we briefly describe the field instrumentation deployed by INERIS between 2004 and 2009. This comprises a SYTGEM multi-parameter system (Klein et al., 2008a) featuring high-resolution microseismic sensors combined with ground-surface monitoring. Some preliminary results will then be presented, focusing on the complementary features of microseismic and subsidence measurements in enabling the description of the main stages of cavern development. A special emphasis on the collapse period (February 10–13, 2009) will help to identify the contributions of the multi-parameter approach to the management of ground instability. Finally, a preliminary analysis of the microseismic patterns observed before the collapse in terms of the completeness of the seismic catalogue and b-value will be presented.
2 Site description and geological setting
The Cerville-Buissoncourt site, in the Nancy salt basin, has been exploited by the solution mining method since 1997, using the channel and drilling technique (Fig. 1a). The field is mined by dissolution, with water injection via two parallel, aligned well casings into the base of the salt deposit at a depth of some 280 m. A 1-kilometer-long brine channel is created, leading to extraction wells placed downstream. This channel evolves progressively into a large cavern developing upwards. Once the cavern reaches the roof of the salt deposit, generally upstream, it advances by breaking through the roof, consisting of marls, until it reaches a critical stage. The overlying ground then collapses and a large crater appears on surface, with a lateral extension adjacent to the underground cavern (Fig. 1a).
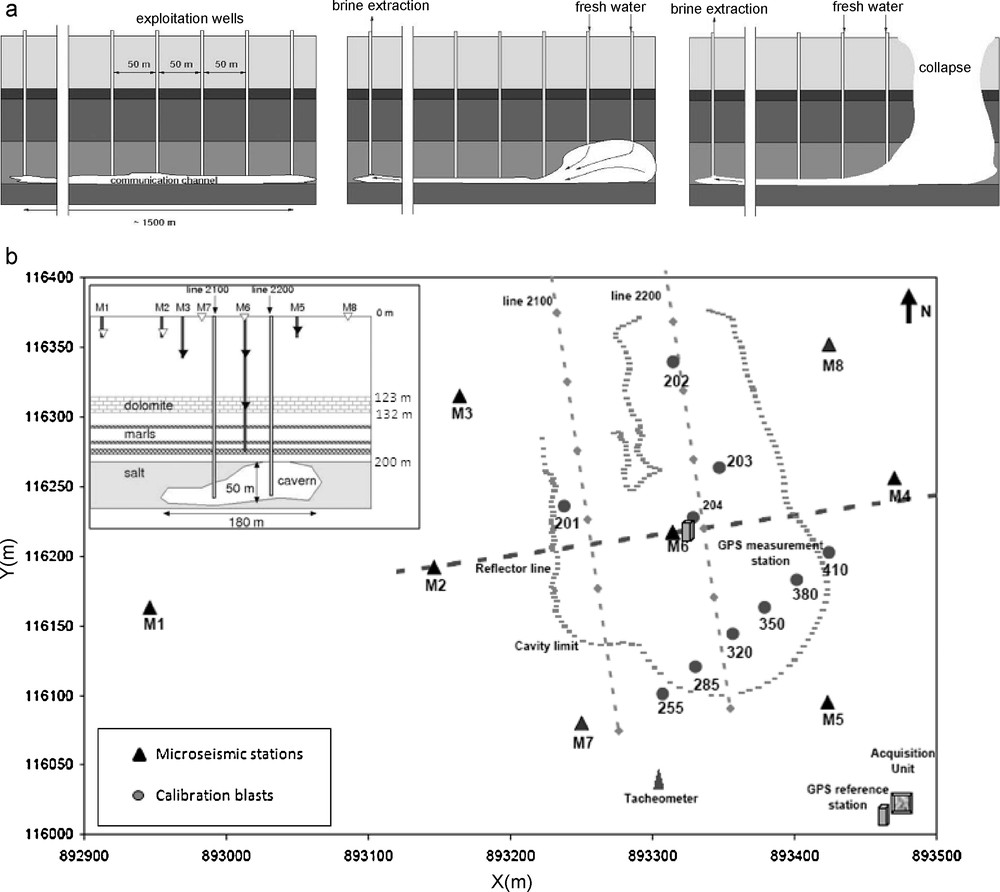
a: layout diagram illustrating operations using channels and drill holes: (left) creation of a communication channel at the base of the deposit, (center) the creation followed by the extension of the cavern, and (right) collapse of the overlying rocks with the formation on the surface of a crater; b: map showing the layout of the high-resolution microseismic monitoring network and the ground-surface movement measurement system (RTK GPS and tacheometer). The insert illustrates a cross-section of the instrumentation, where the extension of the salt cavern is shown as well as the geological structure and the elevations of the microseismic network, especially the M6.3, located in the dolomite bed at a depth of about 125 m.
a: schéma de principe illustrant l’exploitation par pistes et sondages: (à gauche) création d’un chenal de communication à la base du gisement, (au centre) création puis extension de la cavité, et (à droite) effondrement des terrains en recouvrement, avec formation en surface d’un cratère; b: carte montrant la disposition du réseau de surveillance microsismique haute résolution et du système de surveillance des mouvements de la surface au sol (GPS RTK et tachéomètre). L’encart montre une coupe de l’instrumentation, où l’extension de la cavité saline est représentée, ainsi que la structure géologique et les profondeurs des sondes microsismiques, en particulier la sonde M6.3, située dans le banc de dolomie, à environ 125 m de profondeur.
The geology of the site is characterized by a succession of sub-horizontal layers from the ground surface down to the salt deposit (Fig. 1b). Four main geological facies can be distinguished: a first series of strata comprising a succession of marls, marly limestones, sandstones, and anhydrite marls, with depths ranging from 0 to 123 m; an unfractured, relatively thin but very rigid stratum of dolomite and anhydrite (known as the Beaumont Dolomite) from 123 to 132 m; and poorly-consolidated anhydrite marls ranging in depth from 132 to 200 m. Finally, the salt deposit is encountered at a depth of ∼ 280 m. In the present case, the cavern geometry, initiated during the 2000–2003 period, was first evaluated using sonar measurements obtained by Solvay. At the end of 2004 the cavern roof was located at a depth of 183.5 m (Fig. 1b).
On the one hand, the low mechanical strengths that characterize the strata overlying the Beaumont Dolomite indicate that it cannot play any significant role in the geological stability of the mine. On the other hand, the dolomite-anhydrite layer, which is characterized by a remarkable homogeneity, shows very high strengths (Nothnagel, 2003). It is therefore generally accepted that the stability of the overburden is primarily controlled by this very rigid layer, i.e., a general ground collapse will be triggered by the failure of the Beaumont Dolomite.
3 Instrumentation layout
This expected ground-failure process led to the installation, in 2004, of a high-resolution microseismic monitoring network comprising nine permanent seismic probes, including four oriented three-component sensor. All probes were equipped with subminiature omni-directional geophones with a clean response between 40 Hz and 1 kHz and preamplifiers to ensure a high signal-to-noise ratio. They were cemented into boreholes geometrically distributed over the site for optimal azimuth coverage, at depths ranging from a few meters to 125 m. Note that the so-called M6 station was equipped with 3 probes spread in a single vertical borehole centered directly above the cavern, with the deepest probe (M6.3) located within the dolomite layer (Fig. 1b). The 16-bit acquisition unit was set up to detect micro-earthquakes using a standard trigger algorithm based on the amplitudes of the incoming signals. The data were sampled at a frequency of 8 kHz per channel; they were automatically relayed to INERIS Nancy for real-time processing.
In 2008, this high resolution microseismic monitoring network was coupled to a surface leveling device comprising an automatic tacheometer linked to a line of 17 targets and a GPS-Real Time Kinematic (RTK) measurement system, as shown in Fig. 1b. The line of targets crossed the area of interest, i.e., the expected collapse area, so as to measure dynamic subsidence profiles versus time. The GPS monitoring system worked on the basis of GPS RTK measurements to precisely monitor the subsidence by employing to a high stacking rate (1 measurement per second over 20 min) without any off-line processing. The system comprised two receivers (Fig. 1b): one as the reference placed in a stable reference area, close to the acquisition unit, and the second positioned at the very center of the expected collapse area. The microseismic data were automatically transferred to INERIS Nancy.
4 Brief overview of the data processing and the precision of the measurements
The automatic on-line microseismic data processing was performed by the SYTMIS software. It was parameterized on a routine basis included P-wave picking using an STA/LTA algorithm (Allen, 1982) and 3-D location of events based on the non-linear inversion method (Contrucci et al. 2010; Lomax and Curtis, 2001). In practice it was difficult to achieve reliable automatic on-line S-wave picking and thus improved 3-D location, although polarization analysis frequently demonstrated the presence of S-wave energy in the seismograms. This observation, which has already been made in other contexts (Spillmann et al., 2007), requires further investigation. Moreover, the S- and P-phases may overlap on seismograms, thus making the automatic S picking impossible. This means that far-field assumptions were not always valid during the experiment. In addition, some seismograms did not show any S-arrivals: in such cases it was therefore necessary to define a criterion for S-waves that were not automatically picked. For these reason we chose not to use these S-phases for automatic location.
The structure of the velocity model used in the location algorithm was obtained from a seismic profile acquired on the site (Piwakowski et al., 2006; Suffert, 2006): it comprised 3 layers, whose P-wave velocities were determined by re-locating a series of calibration blasts carried out on surface in 2005. The discrepancies between the known and calculated positions of the blasts were then minimized by considering: the first series of geological strata, from 0 to 123 m deep, with average P-wave velocity taken as 3000 m/s; then from 123 to 132 m depth, for the dolomite layer, the P-wave velocity being taken as 5000 m/s; from 132 m onwards, for the marls and salt formations, the P-wave velocity being taken as 4000 m/s. When considering P-wave arrivals as the only input data to the location algorithm, the relocation error is around 12 m. The 3-D location error may however reach 60 m because the geological structure overlying the cavern had dramatically changed between the beginning of the experiment and its end, undoubtedly leading to high contrasts in the seismic velocities. However, even if this paper does not attempt to provide a complete analysis of the microseismic data set, some general characteristics of the recorded events will be presented.
Finally, concerning the surface-displacement measurements, no particular data processing was necessary. In fact, the accuracy of ± 5 mm for the GPS-RTK measurements that was obtained as a consequence of the short inter-receiver distance and the high stacking rate was sufficient for a detailed analysis (Section 5). The data collected by the tacheometer, although strongly sensitive to meteorological variations, showed a similar precision for the closest targets when applying a simple moving average to a few measurement cycles.
5 Recorded data: general characteristics and temporal evolution up to the general collapse
The monitoring, which started in late 2004, showed very few microseismic events for several years, until February 2008. Only two microseismic swarms were observed, on May 8 and 31, 2007, lasting less than 24 hours, with 622 and 226 events respectively recorded (Mercerat et al., 2010) (Fig. 2). After March 2008 the microseismic trend was marked by several episodes of major activity (more than 10,000 events recorded in a few days) and a change in the background noise, with as many as 25 events per day (Klein et al., 2008b) (Fig. 2). Moreover, the migrations of the microseismogenic zone in space and time clearly indicated a generally vertical development of the cavern dome along with an apparent lateral dissymmetry (Fig. 3a). These observations were confirmed by gamma-ray well-log readings showing that several massive (∼ 500,000 m3) collapses of the marl roof rocks occurred between February and May 2008 with a transverse asymmetric roof elevation (Klein et al., 2008b).
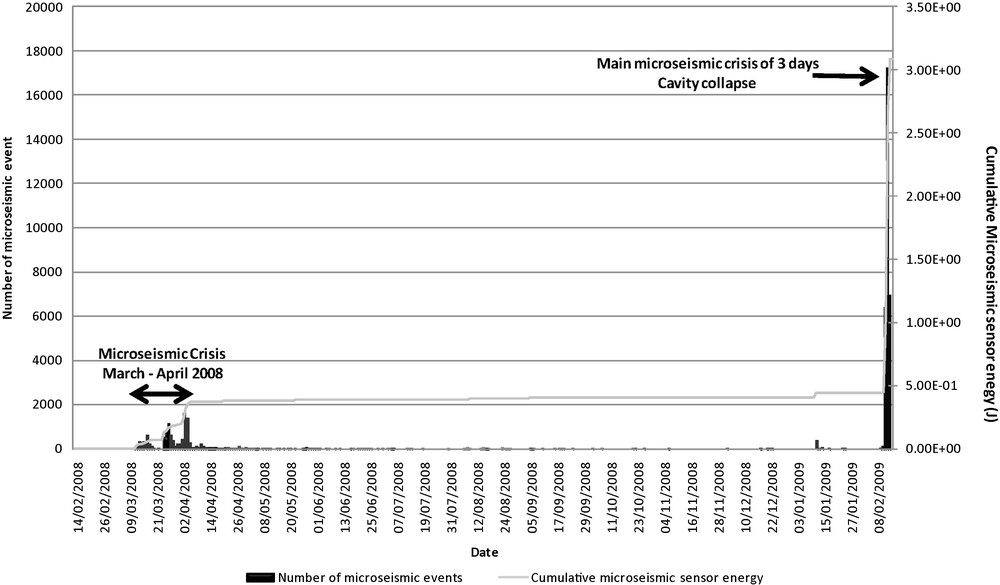
Microseismic activity and cumulative recorded energy of the site from February 2008 to February 2009. Note that the March–April 2008 crisis is weak in comparison to the main crisis linked to the collapse, in which 30,000 microseismic events were recorded.
Activité microsismique et énergie cumulée, enregistrées sur le site de février 2008 à février 2009. Notez que la crise de mars–avril 2008 est faible, comparée à la crise majeure de l’effondrement où 30 000 événements microsismiques ont été enregistrés.
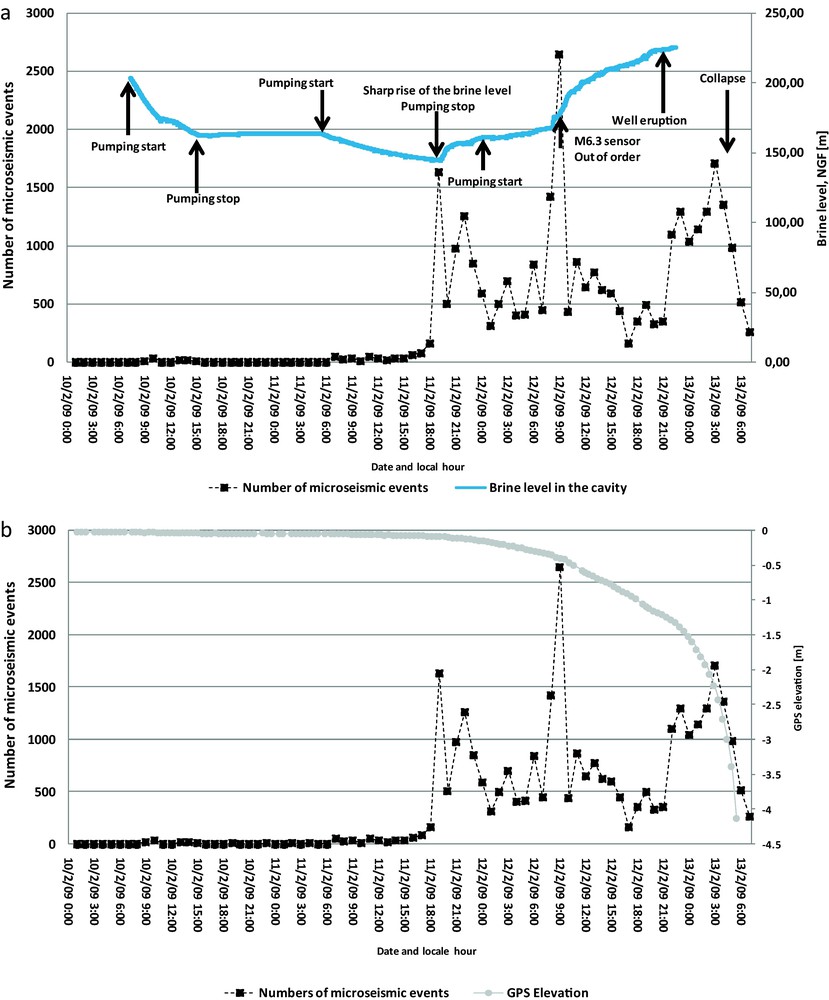
a: number of microseismic events recorded on site and brine level measured at one extraction well (1 km distant from the cavern) between February 10 and 13, 2009. Note that microseismic peaks are correlated with rises in brine level; b: number of microseismic events recorded on site and subsidence measured by the GPS device. Note the strong acceleration in subsidence during the last 24 hours and the last GPS measurement indicating a cumulative subsidence of 4 m in the center of the area, before the ground collapse and flooding of the area.
a: nombre d’événements, microsismiques enregistrés sur site et niveau de saumure mesuré au puits d’extraction (à 1 km de la cavité) entre le 10 et le 13 février 2009. Notez que les pics microsismiques sont corrélés avec les remontées du niveau de la saumure; b: nombre d’événements microsismiques enregistrés sur le site et taux de subsidence mesuré par GPS. Notez l’importante accélération du taux de subsidence pendant les dernières 24 h et la dernière mesure GPS qui indique un affaissement cumulé de 4 m dans le centre de la zone, avant l’effondrement du recouvrement et de l’inondation de la zone.
At that point, a decision was made to permanently close all surface access to the zone, even though no significant subsidence had been observed. At that time, the upper portion of the geological sequence was nevertheless showing a rather stiff elastic response. However, it was found that the cavern had reached critical size, based on numerical modeling considerations and expert advice (Mercerat, 2007). To trigger an accelerated collapse, Solvay decided to progressively lower the brine level. Intensive brine extraction began on February 10, 2009 at 7 am local time and continued until the general collapse, three days later, on February 13, 2009 at 5:45 am local time. Fig. 4 shows the microseismic activity recorded during that period versus: (a) brine level and (b) subsidence. This figure also illustrates the extraction regime which was divided into two main phases: a first pumping stage with a decrease in the brine level of 50 m; semi-continuous pumping until the collapse, at a rate of 400 to 600 m3/h.
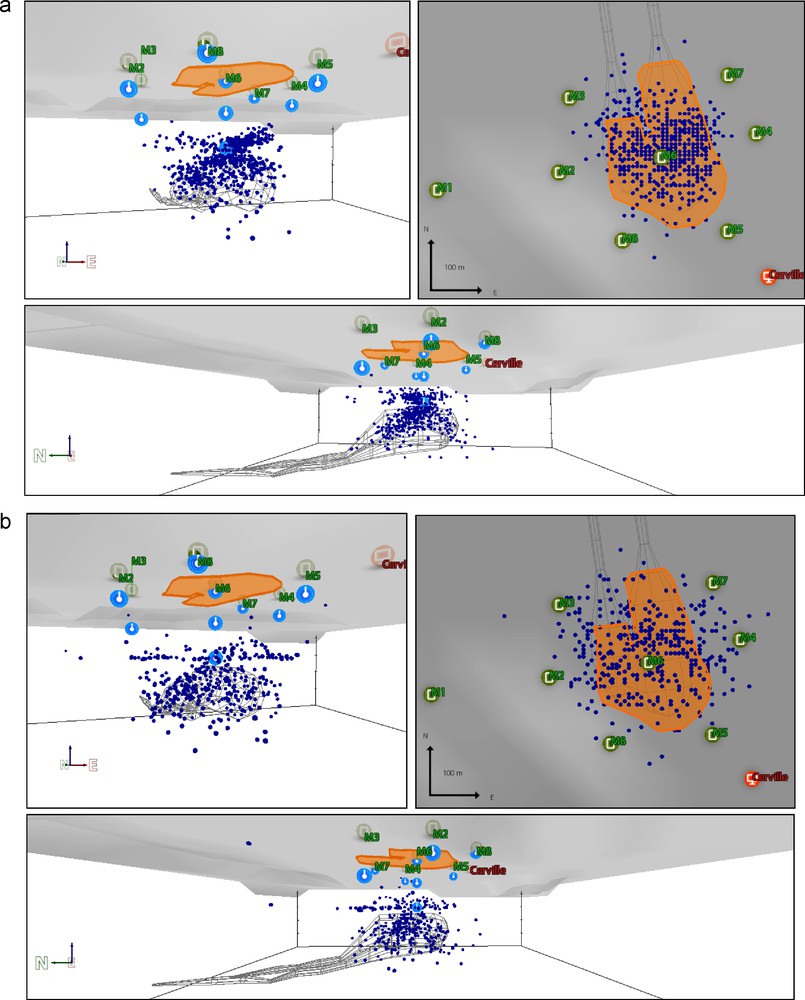
a: view of the microseismogenic zone located over the roof of the cavern during the 2008 crisis, between Mar. 31, 2008 and April 6, 2008: note the asymmetry of the event distribution; b: same view during the collapse period on Feb. 11, 2009: note the event distribution along the Beaumont dolomite (on the left front 3-D view of the cavern, on the right plan view, and the downward 3-D cross-section view, the black lines represent a schematic outline of the cavern).
a: vue de la zone microsismique au toit de la cavité saline, pendant la crise de 2008, entre le 31/03/2008 et le 06/04/2008 ; notez la distribution asymétrique des événements; b: la même vue pendant la période d’effondrement, le 11/02/2009 ; notez l’alignement des événements le long du banc de dolomie de Beaumont (à gauche vue 3D de face, à droite vue en plan et en bas vue 3D de côté; les lignes noires représentent la forme schématique de la cavité).
During the first day of pumping, neither significant microseismicity nor surface subsidence could be observed. The impact of the lowering of the brine level began to take effect at the end of the second day with a sudden acceleration of the microseismic energy release rate, indicating more than 1500 events in one hour (Fig. 4a). This microseismic swarm coincided with a dynamic rise of 9 m in the brine level and marked a change in the subsidence regime (Fig. 4b), whose velocity then reached ∼0.2 cm/h. Beyond that stage, the sustained microseismic activity increased rapidly, more steeply than during any other period. From that point on, the pumping regime was not powerful enough to compensate the rise in the brine level at the extraction wells, owing to the pressure applied to the system by the overburden. The major activity peak occurred early on the third day, when the cumulative subsidence reached ∼0.40 m, with an instantaneous velocity of 2.5 cm/h. This initially coincided with loud acoustic noises heard on site, and later on with the breakdown of the microseismic probe installed in the Beaumont dolomite layer at a depth of 125 m. These observations, along with on-line 3-D location results (Fig. 3b) show that this major activity peak is related to the overall failure of the Beaumont dolomite layer. This major peak was then followed by an acceleration in the subsidence rate, which ultimately reached 1 m per hour. Less than 24 hours later, the ground surface collapsed, forming a crater ∼ 150 m in diameter.
More than 30,000 events were recorded during the last four days preceding the collapse. The last GPS measurements, during the ground collapse and flooding of the zone, indicated a cumulative subsidence of more than 4 m in the center of the area (Fig. 4b).
6 Preliminary analysis of the microseismicity patterns observed before the collapse
The frequency-size distribution of the events, i.e., the Gutenberg-Richter (Gutenberg and Richter, 1954) scaling law, was estimated for a sample of the microseismic data set recorded before the first activity peak (Fig. 4), as described earlier. Our general approach in this analysis follows the method used in Amitrano et al. (2005) to estimate an apparent b-value as a seismic precursor sign before a cliff collapse, in an experiment carried out by INERIS as part of the PROTECT EU Project. The following formula (1) was then used:
| (1) |
Here, to reach the maximum completeness of the catalog, the average energy recorded by two 3-D probes (M3 and M5) located about 150 m from the center of the cavern is considered. The energy is not corrected by using the event-sensor distance to take into account non-localized events (a large amount of data is still being processed). The average energy at the two selected probes also helps to compensate for the attenuation effect which may produce a bias in the event-size distribution and the b-value estimation, as shown by Weiss (1997). Indeed, the same author shows that if a power-law distribution is observed on a reasonably large range of magnitudes with a b-value lower than 3, this b-value is representative of the original distribution (Weiss, 1997). This is the case for the data set considered here: b-values are not greater than 0.9 and all microseismic events (Fig. 5a) at two different probes. An apparent b-value can then be deduced using this approach (Amitrano et al., 2005).
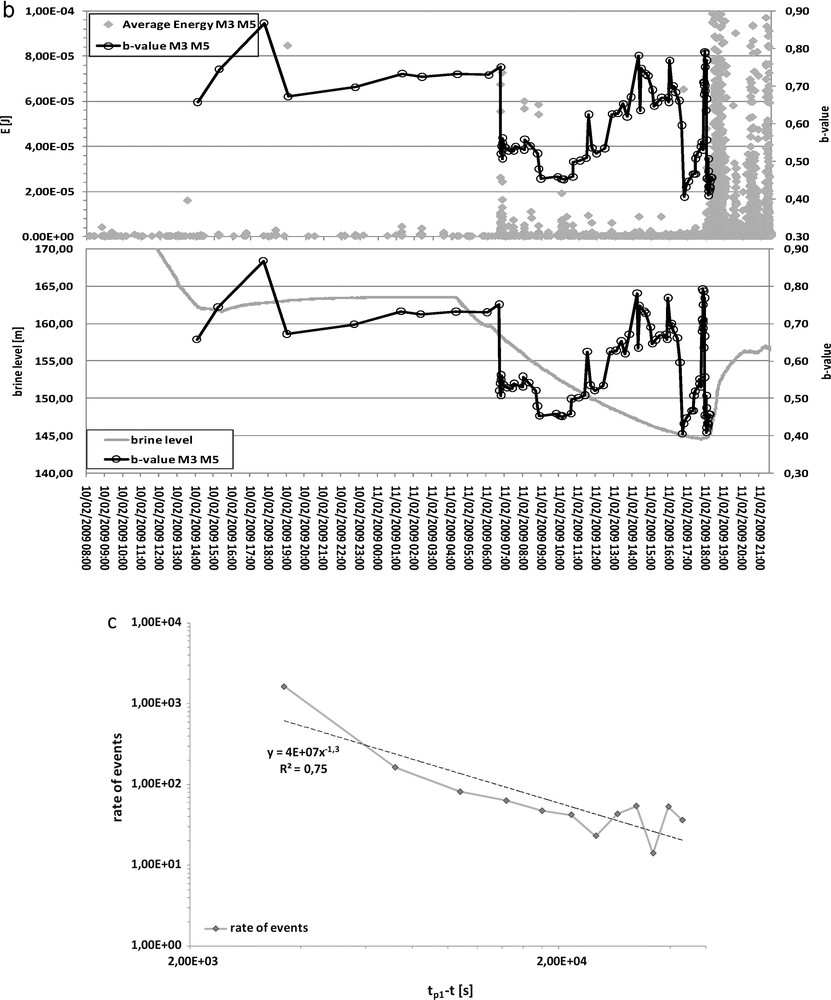
a: cumulative distribution of the seismic energy recorded by the M3 and M5 probes for a sample of 1030 microseismic events that occurred over a period of 42.5 hours before the first microseismic peak, (between 00:22 UT on February 10 and 18:30 OT on February 11, 2009). Dotted lines show the energy distribution of the first 190 events estimated by considering a sliding window of 100 events shifted by 10 events. Solid lines show the same distribution for the 100 to 420 subsequent events. These two groups illustrate the variation of the apparent b-value; b: variations of apparent b-value with time prior to the collapse (black open circle) superimposed on average energy recorded by the M3 and M5 probes (above) and on the brine level in the cavern (below). Several decreases of this parameter are observed before the first main peak of seismic activity (February 11 at 18:00 UT) and the simultaneous rise of the brine level in the cavern; c: frequency of seismic events versus time (gray solid line and diamonds) approximated by a power law (black dotted line).
a: distribution cumulée de l’énergie sismique enregistrée par les sondes M3 et M5 pour un échantillon de 1030 événements qui ont eu lieu sur une période de 42,5 heures avant le premier pic microsismique (du 10 février à 00 h 22 au 11 février à 18 h 30 TU). Les lignes pointillées montrent la répartition de l’énergie sur les 190 premiers événements estimée en considérant une fenêtre glissante de 100 événements, décalée de 10 événements. Les lignes continues montrent la même distribution pour les 100 à 420 événements suivants. Ces deux groupes illustrent la variation du paramètre b apparent; b: variations du paramètre b apparent en fonction du temps avant l’effondrement (cercle noir ouvert), superposé à l’énergie moyenne enregistrée par les sondes M3 et M5 (en haut) et le niveau de saumure dans la cavité (en bas). Plusieurs diminutions du paramètre b sont observées avant le premier pic principal d’activité sismique (le 11 février à 18:00 TU) et la remontée du niveau de saumure dans la caverne au même moment; c: taux d’événements sismiques en fonction du temps (ligne pleine et losanges gris) corrélé par une loi en puissance (ligne noire en pointillés).
Variations of the apparent b-value with time were calculated using a sliding window of 100 events shifted by 10 events on a sample of 1030 microseismic events (Fig. 5b) that occurred over a period of 42.5 hours before the first microseismic peak (between 00:22 UT on February 10 and 18:30 UT the February 11, 2009). Each b-value was associated with the last microseismic event of the window, so the apparent b-value was calculated from the 100 events occurring before the end of the window in question. Over the entire period considered, the mean apparent b-value is 0.63 ± 0.02 using the average sensor energy of the M3 and M5 probes. It is 0.60 ± 0.02 when considering only the M3 probe and 0.63 ± 0.01 for the M5 probe (Fig. 5a). The energy recorded by the M5 probe is slightly lower than the one recorded by the M3 (Fig. 5a). In the next section the apparent b-value is related, by default, to the average energy of the two probes M3 and M5.
At the beginning of the period, a high b parameter is observed (Fig. 5a, b), corresponding, as expected to low-energy seismic events. On Feb. 11, 2009 at 06:45 UT, i.e. 11 hours before the first microseismic peak, an abrupt change in the apparent b-value is observed, from 0.75 ± 0.02 to 0.52 ± 0.01 (Fig. 5a,b). It is correlated with a local increase in the microseismic sensor energy (7.2 × 10⁻⁵ J) and activity (∼70 events/h) and a decrease in the brine level of ∼5 m (Fig. 5b). The apparent b-value then continues to decrease for four hours, reaching a minimum value of 0.45 ± 0.03. After this point several apparent b-value variations are observed, directly linked to the microseismic regime (Fig. 5b): falls in the b-value are related to the occurrence of strong events (Fig. 5b). The last main drop-off in the b parameter, at 18:00 UT on Feb. 11, 2009, is correlated with the onset of the first main peak of activity (∼1640 events/h, Figs. 3a and 5b) which also corresponds to the critical point beyond which the pumping is no longer powerful enough to offset the rise in brine level (Fig. 5b). The associated microseismic surge can then be described by the following power law (Fig. 5c):
| (2) |
7 Conclusion
On preliminary analysis, the complete data set recorded during the Cerville-Buissoncourt experiment made it possible to follow the main stages in the evolution of the solution mine. Early signs of unstable development were detected by high-resolution microseismic monitoring during the spring of 2008: a shift in the microseismic background regime as well as recurrent microseismic episodes were associated with a general process of rock failure caused by the cavern growing upwards. This was accompanied by a few episodes of massive roof falls, with no ground-surface movement detected. During a second and final stage of development, which lasted three days, the cavern collapse was triggered by brine pumping. Three main microseismic regimes were then observed, each being well correlated with changes in both the surface subsidence rate and the brine level in the cavern. The first peak of activity, once again due to massive roof falls below the Beaumont dolomite layer, also initiated the brittle rupture of this bed. The second and major peak of activity marked its rapid and high-energy failure; it also corresponded to an acceleration in the subsidence rate. The last activity peak, a few hours later and weaker in terms of number of events and energy released, marked the final collapse.
The complete dataset confirms the major role of the Beaumont dolomite layer in the site's stability. In addition, while the preliminary analysis of the microseismicity patterns immediately before the general collapse confirms that the acceleration in the microseismic activity follows a power law, it also shows that the b-value is a complex marker in such a context. Although local falls in the b-value correlate well, as expected, with local increases in the release of microseismic energy, it seems inappropriate to use it for forecasting purposes: over a short period of time, several b-value decreases are observed while a continuous pumping regime is being applied to the system. It appears that variations in the b-value do not show a clear precursor pattern, as observed in other case-studies (Amitrano et al., 2005; Scholz, 1968; Urbancic et al., 1992). Nevertheless, further investigations covering the various stages of cavern development, including the collapse period, are needed to confirm this preliminary result.
Acknowledgments
This work was undertaken with the financial support of the French Ministry of Mines, the Lorraine Region, and the French Ministry of Environment. We also thank Solvay for making available the technical and human resources involved, without which this large-scale scientific experiment could not have taken place. The authors also thank their GISOS partners for their collaboration. We also wish to acknowledge all the people who have been involved in this project since 2004: L. Driad-Lebeau, G. Senfaute, C. Nadim, L. Cauvin, the AS2G team (INERIS), P. Bernard, D. Mercerat (IPGP), O. Hernandez (INERIS, now at the University of Montpellier), M. Pierson, J.L. Vautrin, and H. Martin (SOLVAY). We also thank the two anonymous reviewers, and M. Campillo (editor), who made pertinent remarks that helped us to significantly improve the paper.