

1 Introduction
Soultz-sous-Forêts, located in the Upper Rhine Graben, hosts one of the few deep “enhanced geothermal system” (EGS) test sites in the world. At its current state of development, the EGS site consists of five boreholes. GPK2, GPK3 and GPK4 constitute the European geothermal pilot plant which extends to more than 5000 m depth, GPK1 is a 3600 m deep well dedicated to the first hydraulic tests and finally EPS1 fully cored down to 2230 m. Some wells for seismic observation are located near the geothermal plant among which the 1400 m deep well refered to as well 4550 the closest to the wellhead of GPK1 (Fig. 1).
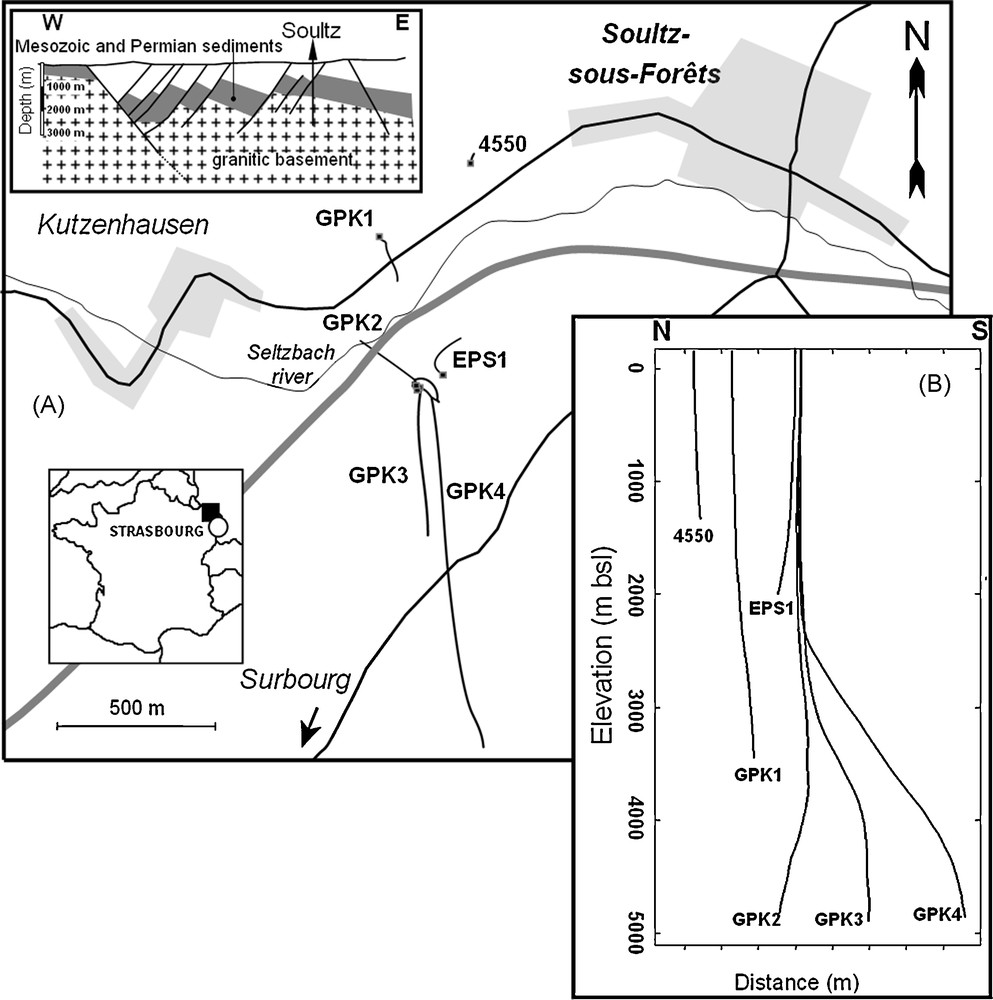
A. Schematic geological map of the Rhine Graben and location of the Soultz-sous-Forêts EGS site. B. Location and traces of the Soultz geothermal (GPK2, GPK3, GPK4) and observation wells (EPS1, GPK1, 4550); solid lines correspond to well traces (A and B). (Modified after Dezayes et al., 2005).
A. Carte géologique schématique du Fossé Rhénan et localisation du site géothermique de Soultz-sous-Forêts. B. Carte de localisation et trajectoires des puits GPK2, GPK3, GPK4 et des puits d’observations annexes (EPS1, GPK1, 4550) (modifié d’après Dezayes et al., 2005).
In deep EGS, in crystalline rocks characterized by low matrix porosity, natural or forced fluid circulation takes place through the fracture networks. The connection between fractures and the consequent anisotropic permeability are then crucial to insure the efficiency of the geothermal exchanger and to recover sufficient fluids with sufficient temperatures at the ground level. The objective of this article is to build a 3D network of the main permeable fractures within the target rock volume which could connect the wells together. The objective is to achieve a better understanding and prediction of the hydraulic response of the granite. An important database of geological data (Genter et al., 1995), well logs (Dezayes et al., 2005, 2010; Sausse and Genter, 2005; Sausse et al., 2006), microseismicity recordings (Cuenot et al., 2007, 2008; Dorbath et al., 2009) and vertical seismic profiling (VSP) results are compiled and combined to build a new orginal 3D model of the Soultz-sous-Forêts fractured reservoir.
2 Geology and geophysics
2.1 Geology
In the Soultz area, the post-Palaeozoic granite is overlain by Mesozoic and Cenozoic sediments forming a 1.4 km thick layer. From 1.4 to 5 km in depth, the deep-seated geology deduced from borehole logging corresponds to several granitic intrusions (porphyritic granite, fine-grained two mica granite; Genter, 1989; Hooijkaas et al., 2006). The granitic basement has been strongly altered by flowing fluids (veins and pervasive alterations). Fluid circulation now takes place through two fracture networks that create scale-related flow: the first is a closely-connected network of small-aperture fractures that may represent the far-field reservoir and will not be addressed in our article, and the second is a set of local, wide-aperture fractures that result in an anisotropic permeability system hydraulically connecting the injection and production wells (Evans et al., 2005; Sausse and Genter, 2005; Sausse et al., 2006, 2008). These wide-aperture fractures represent the major inlets/outlets during hydraulic tests and, are described by Genter et al. (2000) and are therefore the targets of the 3D model.
2.2 Well-logging
The French Geological Survey (BRGM) collected geological and well-logging data to characterize the Soultz-sous-Forêts granite reservoir in terms of petrography, hydrothermal alteration and natural fracture network; well data were acquired by logging companies.
Fracture analysis was carried out in the deepened peripheral well 4550 based on BHTV (Borehole Televiewer) acoustic image interpretation (Genter et al., 1995). One single fracture zone, corresponding to a cluster of individual fractures, intercepts the well at depth 1265 m (Table 1).
Données structurales et géométriques finales permettant la définition du modèle 3D à partir des données diagraphiques, de l’interprétation du nuage microsismique produit par les stimulations hydrauliques des 3 puits profonds GPK2, GPK3 et GPK4 et complétées par les interprétations de sismiques de puits réalisées dans EPS1 et GPK1. Les paramètres géométriques qui caractérisent les principales zones de failles correspondent aux profondeurs d’intersection des puits (MD), aux extensions des axes majeurs et mineurs, et aux orientations en termes de direction de plongement et pendage. Chaque puits est caractérisé par plusieurs zones de fractures identifiées par une nomenclature particulière : nom du puits – FZ – Profondeur mesurée du centre de la fracture. Les corrélations entre les structures définies par les diagraphies et celles définies par les données microsismiques et sismiques de puits (VSP) sont mentionnées.
| Well | Name | Depth (MD) | 2*dh | 2*dv | Dip direction ̊ | Dipd | Fit with |
| EPSl | EPS1-FZ1010 | 1012 | 300 | 300 | 130 | 79 | |
| EPS1-FZ1200 | 1198 | 600 | 600 | 247 | 74 | ||
| EPS1-FZ1640 | 1643 | 400 | 400 | 76 | 58 | ||
| EPS1-FZ2180 | 2179 | 600 | 600 | 278 | 53 | ||
| VSP-EPS1-NI | Not observed at the well scale | 300 | 300 | 65 | 70 | / | |
| GPKl | GPK1-FZ1015 | 1015 | 300 | 300 | 270 | 45 | |
| GPK1-FZ1220 | 1220 | 600 | 600 | 247 | 74 | ||
| GPK1-FZ1820 | 1820 | 600 | 600 | 27 | 47 | ||
| GPK1-FZ2815 | 2815 | 400 | 400 | 230 | 70 | ||
| GPK1-FZ3220 | 3223 | 300 | 300 | 60 | 75 | ||
| GPK1-FZ3490 | 3492 | 300 | 300 | 257 | 63 | GPK3*-FZ4770 | |
| GPK1-FZ2870 | 2868 | 300 | 300 | 290 | 70 | ||
| VSP-GPK1-1800 | 300 | 300 | Same than GPK1-FZ1820 | GPK1-FZ1820 | |||
| VSP-GPK1-2860 | 300 | 300 | Same than GPK1-FZ2870 | GPK1-FZ2870 | |||
| VSP-GPK1-3490 | 300 | 600 | 257 | 55–65 | GPK3-FZ4770* and GPK1-FZ3490 | ||
| VSP-GPK1-NI1 | Not observed at the well scale | 600 | 300 | 250 | 85 | / | |
| VSP-GPK1-NI2 | Not observed at the well scale | 600 | 1000 | 250 | 55 | / | |
| MS-GPK3-2003a | 3492 | 1000 | 2000 | 257 | 63 | GPK1-FZ3490 | |
| GPK3-FZ4770* | 4775 | 3000 | 3000 | 234 | 71 | ||
| GPK2 | GPK2-FZ2120 | 2123 | 600 | 600 | 65 | 70 | |
| GPK2-FZ3240 | 3242 | 300 | 300 | 82 | 69 | ||
| GPK2-FZ3350 | 3347 | 300 | 300 | 231 | 84 | ||
| GPK2-FZ3515 | 3514 | 300 | 300 | 313 | 57 | ||
| GPK2-FZ3900 | 3900 | 400 | 400 | 234 | 64 | ||
| GPK2-FZ4760 | 4760 | 400 | 400 | 250 | 65 | ||
| GPK2-FZ4890 | 4890 | 300 | 300 | 250 | 65 | ||
| GPK2-FZ5060 | 5060 | 400 | 400 | 250 | 65 | ||
| MS-GPK2-2000a | Not observed at the well scale | 600 | 1200 | 244 | 86 | GPK3-FZ4770 | |
| MS-GPK2-2000b | Not observed at the well scale | 200 | 300 | Not defined | GPK3-FZ4770 and GPK1-FZ3490 | ||
| GPK3 | GPK3-FZ1580 | 1579 | 300 | 300 | 69 | 78 | |
| GPK3-FZ1640 | 1637 | 300 | 300 | 46 | 68 | ||
| GPK3-FZ1820 | 1820 | 300 | 300 | 46 | 64 | ||
| GPK3-FZ2040 | 2042 | 300 | 300 | 72 | 65 | ||
| GPK3-FZ2045 | 2046 | 300 | 300 | 243 | 69 | ||
| GPK3-FZ2090 | 2092 | 300 | 300 | 91 | 76 | ||
| GPK3-FZ2970 | 2970 | 400 | 400 | 77 | 82 | ||
| GPK3-FZ3270 | 3271 | 400 | 400 | 345 | 85 | ||
| GPK3-FZ4090 | 4089 | 300 | 300 | 253 | 62 | ||
| GPK3-FZ4770 | 4775 | 3000 | 3000 | 234 | 64 | Original orientation | |
| GPK3-FZ4770* | 4775 | 234 | 71 | Final orientation | |||
| MS-GPK3-2003a | Not observed at the well scale | 1000 | 2000 | 257 | 63 | GPK1-FZ3490 | |
| MS-GPK3-2003b | Not observed at the well scale | 600 | 400 | 270 | 45 | / | |
| MS-GPK3-2003c | Not observed at the well scale | 1000 | 600 | 261 | 67 | / | |
| GPK4 | GPK4-FZ1720 | 1723 | 300 | 300 | 216 | 69 | |
| GPK4-FZ1800 | 1801 | 300 | 300 | 26 | 80 | ||
| GPK4-FZ2820 | 2817 | 300 | 300 | 242 | 86 | ||
| GPK4-FZ3940 | 3940 | 300 | 300 | 250 | 68 | ||
| GPK4-FZ4360 | 4361 | 400 | 400 | 280 | 77 | ||
| GPK4-FZ4620 | 4620 | 300 | 300 | 285 | 78 | ||
| GPK4-FZ4710 | 4712 | 400 | 400 | 212 | 50 | ||
| GPK4-FZ4970 | 4973 | 300 | 300 | 276 | 81 | ||
| GPK4-FZ5010 | 5012 | 300 | 300 | 257 | 85 | ||
| GPK4-FZ5100 | 5100 | 300 | 300 | 255 | 69 | ||
| MS-GPK4-20045a | 4620 | 600 | 1200 | Same than GPK4-FZ4620 | GPK4-FZ4620 | ||
| MS-GPK3-20045b | 4973 | 1000 | 1500 | Same than GPK4-FZ4973 | GPK4-FZ4973 | ||
| GPK3-FZ4770* | 4775 | 3000 | 3000 | 234 | 71 | ||
| 4550 | 4550-FZ1265 | 1265 | 600 | 600 | 260 | 75 |
The reference hole EPS1 has been fully cored. A large database concerning the granite fractures has been collected in this well (Genter, 1989; Genter and Traineau, 1992, 1996; Genter et al., 1995, 1997). These detailed data present an excellent opportunity to study the structural and mineralogical properties of the Soultz granite over a depth interval of 810 m. More than 3000 fractures are described as for their depth of intersection with the borehole, orientation, mineralogy of fillings, tectonic origin and apparent apertures. Among the major fracture zones that emerged from cited previous works, only 4 are selected in this study (Table 1).
A large structural and petrographical database has been collected too for GPK1 based on various logging images and cutting analysis between the top of the granite (depth 1400 m) and depth 3600 m (Genter et al., 1997). The extensive logging of GPK1 throughout the open-hole depth range from 2850 m to 3610 m leads to the characterization of 6 major fracture zones (Table 1).
The main well-logging in the three deepest wells (GPK2, GPK3 and GPK4) consisted of the gamma-ray spectral log. Fracture geometrical properties and their spatial relationships are analyzed based on amplitude and transit time anomalies derived from acoustic image logs (Ultrasonic Borehole Imager; UBI). The fractures can be identified with high accuracy and measured in azimuth and dip by this borehole imagery technique. Since 2003, other flow and/or temperature logs were run in the different deep wells during injection and production tests and some interpretation of the main fracture and permeable zones is proposed by Dezayes et al. (2005, 2010). These hydraulically active fractures could correspond to either isolated fractures or series of thin parallel fractures or large-scale fracture zones. These large-scale fracture zones reach 10 m in thickness and are characterized by sealed core and a peripheral damage zone that is highly fractured and therefore highly permeable (Genter et al., 2000). Fracture orientations and relative contribution to flow are available in the open holes for the three deepest wells (Sausse et al., 2007, 2008). For the GPK2 well, UBI logs were not available all along the well; therefore the fracture orientations corresponding to depths from 3880 m to 5080 m, the bottom of the well, were fully estimated based on our expertise from the Soultz-sous-Forêts site (other log data such as spectral gamma-ray combined with calliper).
Most of the fractures appear to be members of a nearly-vertical system of conjugated fracture sets with a symmetry axis striking NNW-SSE consistent with the Rhine Graben past and present tectonics.
2.3 Microseismicity
Hydraulic stimulation generated micro-seismic activity which was interpreted in terms of major structures: events location were put into relation with fault organisation by Dorbath et al. (2009). The stimulation of GPK2, in year 2000, induced more than 700 seismic events with a magnitude M greater than 1.0. The seismicity depicts a dense, homogeneous cloud, without any apparent large-scale structure (Fig. 2). Medium-sized earthquakes represent more than 80% of the cumulative seismic moment. The b value of the Gutenberg and Richter law is larger than 1.2. The b-value is an indicator of crustal weakness, high localized strain rate resulting from fluid movements. This quite large value is uncommon and could correspond to movement of water and the large number of conveniently oriented fractures stimulated during the hydraulic tests in this well (Dorbath et al., 2009). During the stimulation of GPK2, the injectivity has been increased by a factor 20. These characteristics indicate that the stimulation reactivated a dense 3-D network of fractures. The stimulation of GPK3 in 2003 induced only about 250 events with a magnitude greater than 1.0. Numerous large events, from M > 2.0 up to 2.9, account for the greater part of the cumulative seismic moment. The hypocenters form anisotropic structures identified as large faults (Fig. 2). The b value is about 0.9. The injectivity of the well was already high before the stimulation and remained unchanged (Nami et al., 2008; Schindler et al., 2008). The stimulation of GPK4, achieved in two stages (2004 and 2005, Fig. 2), produced even less induced events, a situation that makes the interpretation difficult. The differences between the seismic response of GPK2 and GPK3 are due to the presence of large faults cut by GPK3 or in its close vicinity and reached by the injected water. Once a seismic event occurs on a fault, a sequence of earthquakes is triggered and the seismicity behaves, for a large part, independently of the injected flow rate.
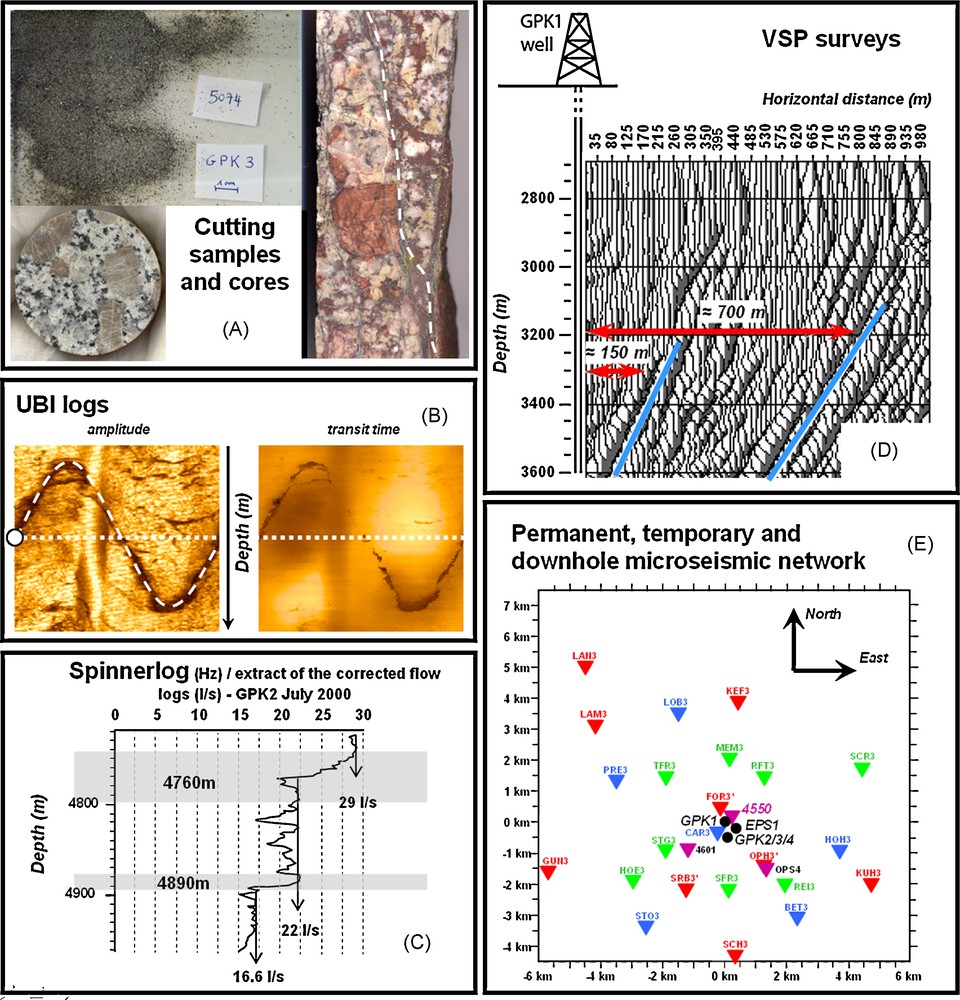
Main combined approaches and data used to realize the 3D modelling. A. Cutting samples and cores are used to match the geological and geophysical well logs. B. Example of ultrasonic borehole image (UBI) in GPK3 (around 4706 m measured depth) with two sinusoidal traces both in amplitude and transit time indicating a potential permeable fracture. C. Two fracture zones in GPK2 at 4780 and 4885 measured depth detected on a July 2000 flow log. Fluid losses of 24% each time are measured in front of the fractures (Dezayes et al., 2005). D. Identification of 2 main fault planes around GPK1 using VSP data (2D depth migration of converted P-S reflections on vertical component, unknown azimuth). Characterization of the fault dips and distances to the well path (modified after Place et al., 2008). E. Plane view of the downhole and surface seismological stations installed around the Soultz site. The type of sensor at each station is indicated by different symbol and the wellheads of 4550, EPS1, GPK1 and GPK2/3/4 are plotted on the map (modified after Cuenot et al., 2008).
Présentation des approches et méthodes utilisées pour réaliser le modèle géométrique 3D. A. Échantillons de cuttings et carottes utilisés pour caler les données géophysiques avec la lithologie des puits. B. Exemple d’image ultrasonique de puits (UBI), enregistrée dans GPK3 (autour de 4706 m MD) et indiquant deux traces sinusoïdales à la fois sur l’image en amplitude et en temps de transit des ondes acoustiques dans le puits ; les deux traces présentes simultanément indiquent la présence de fractures perméables. C. Deux zones de fractures observées dans le puits GPK2 à 4780 et 4885 m MD et détectées sur un enregistrement des débits en fonction de la profondeur (test d’injection, juillet 2000). Des pertes de débit jusqu’à 24 % sont mesurées en face de ces fractures perméables (Dezayes et al., 2005). D. Identification de deux plans de failles majeures autour du puits GPK1 à partir des données de sismique de puits (VSP, migration profondeur 2D des réflexions P-S, composante verticale, azimuth non défini). Caractérisation des pendages de ces failles et de leur distance au puits (modifié après Place et al., 2008). E. Carte du réseau de surveillance sismologique de surface autour du site de Soultz. Les types de géophones utilisés sont indiqués pour chaque station et sont représentés par des symboles différents aux têtes de puits de 4550, EPS1, GPK1 et GPK2/3/4 (modifié après Cuenot et al., 2008).
It must be kept in mind that the 3D relocation of micro earthquakes is done with error bars of around 50 m in GPK3 for the horizontal and vertical location and around 70 m for GPK2 and GPK4.
2.4 Vertical seismic profiles (VSP)
A lot of geological information is known in the Soultz-sous-Forêts EGS but it is restricted to the well scale (Genter et al., 2007). It is indeed very difficult to obtain some relevant information about the deep-seated geology within such a crystalline basement from typical investigation methods like seismic reflection (Place et al., 2010) or seismic walkaway (Beauce et al., 1991). For this purpose, old VSP data (1993 survey) have been interpreted in GPK1 after a specific processing (Place et al., 2007) consisting mainly in an isotropic wavefield separation; the data exhibit three linear arrivals on the time-depth records. Thanks to a high signal/noise ratio of these records, polarisation analysis has been carried out: the arrivals show much more energy on the vertical component than on the horizontal components, suggesting a vertical polarisation. At the well location, these seismic events are recognised at depth levels where the GPK1 well intersects highly permeable faults (Evans et al., 2005).
Combined ray path modelling and polarity analysis show that these seismic arrivals are P waves reflected and converted to S waves on ≈60°dipping fault zones affecting the granite in the vicinity of the acquisition well (Place et al., 2007). Therefore, the dip value of these faults can be derived by travel time analysis, up to several hundreds of meters away from the well. However, as the recorded signals are S waves propagating horizontally and vertically polarised, the azimuth value of the reflectors cannot be systematically assessed. In these cases, azimuth values are taken from other methods (mainly UBI). Further ray path modelling is being developed (Place et al., 2008a,b) to address this point in the future.
A large 4-component VSP survey was carried out in 2007 in order to investigate the deep vicinity of the GPK2 and GPK3 boreholes (Cuenot et al., 2007). These data –and additional old data from EPS1 – are still under processing. Nevertheless, some preliminary results indicate that some large-scale permeable faults affecting the deep crystalline basement are suspected (Del Mar Mesa Salgado, 2007; Naville, 2008).
Based on these seismic and structural data, this article proposes a complete 3D model of the Soultz-sous-Forêts reservoir fracture network matched in details with the granite lithology, geophysical and hydraulic characteristics.
3 Discrete fracture networks
3.1 Discrete fracture networks derived from well-logging
The constitution of a 3D realistic and static model of the fractures cross-cut by the wells in the deep geothermal reservoir is allowed by the high quality dataset derived from the logging data (Table 1). The FractCar Plug-in implemented in the Gocad® 3-D earth-modelling software environment (Paradigm™, Earth Decision™, Mallet, 2002) is dedicated to the modelling and visualisation of 3D fracture patterns and DFN modelling (Macé et al., 2004; Macé, 2006). Fracture representation is made through a specific point set where each element gets an attribute for the fracture plane orientation, defined by the normal vector n of the plane (in the dip-direction convention). The form of the fracture border is a disc or an ellipse centered on a well at measured depth and the fracture size (or extension) is fixed for each fracture from our method of evaluation. If the elliptic form is chosen, a major axis and a minor axis are fields to be informed (Fig. 3).
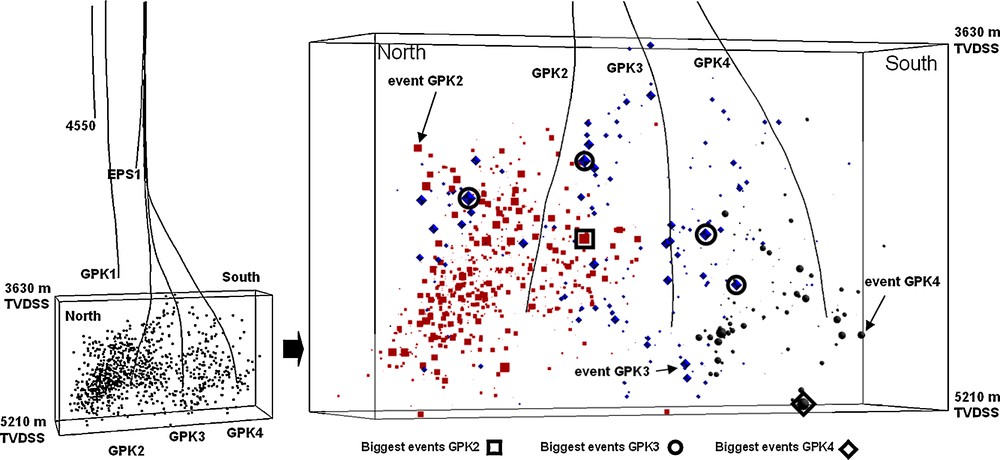
3D view of the three deepest wells GPK2, GPK3, GPK4, the observation wells 4550, EPS1 and GPK1, and the distribution of the microseismic events registered during the stimulations of GPK2 in 2000 (cubes), GPK3 in 2003 (icosahedra) and GPK4 in 2004 and 2005 (spheres).
Vue 3D des 3 puits profonds GPK2, GPK3, GPK4, des puits d’observation 4550, EPS1 et GPK1, et de la distribution des événements microsismiques enregistrés lors des stimulations hydrauliques de GPK2 en 2000 (cubes), GPK3 en 2003 (icosaèdres) et GPK4 en 2004 et 2005 (sphères).
The output of the model is a synthetic 3D set of elliptic planes populating a volume around the wells in the geothermal reservoir (Fig. 5).
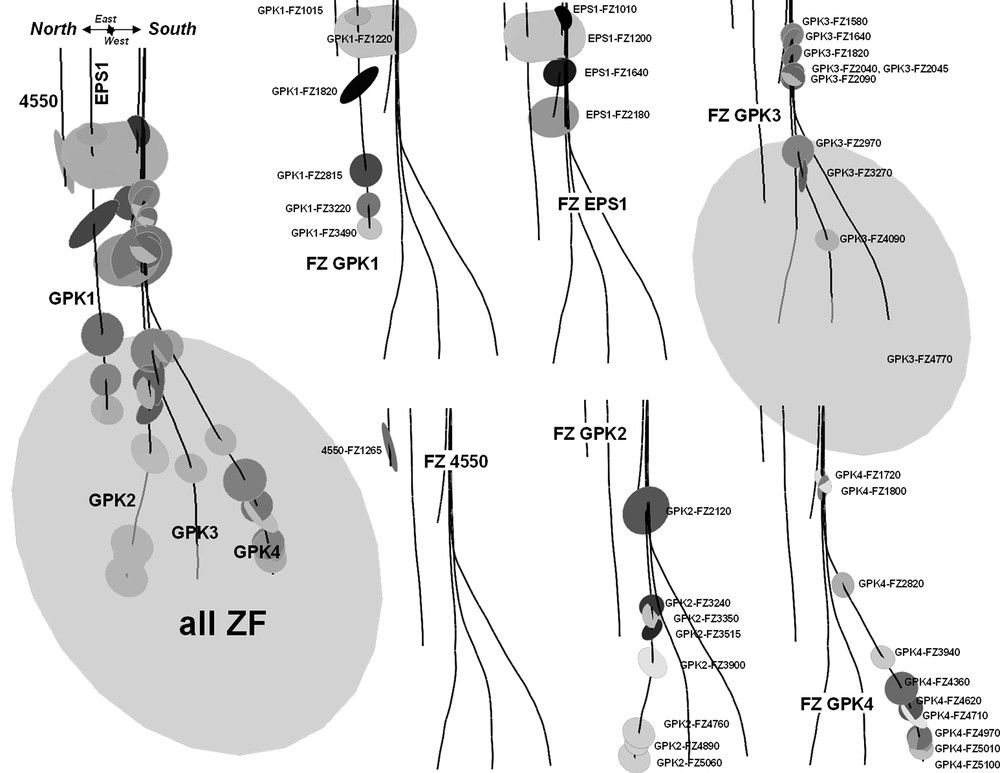
3D view of the main fracture zones cross-cutting the three deepest wells GPK2, GPK3, GPK4 and the observation wells 4550, EPS1 and GPK1. Each disc represents one fracture zone characterized by an orientation, extension and 3D location derived from the well-logging analysis (Dezayes et al., 2010, Table 1).
Vue 3D des zones de failles majeures recoupant les 3 puits profonds GPK2, GPK3, GPK4 et les puits d’observation 4550, EPS1 and GPK1. Chaque disque représente une zone de faille et est caractérisé par une orientation, une extension, et une position sur la trajectoire puits, définie à partir de l’interprétation des mesures géophysiques diagraphiques UBI (Dezayes et al., 2010, Tableau 1).
The major issue for reconstructing the 3D geometry of the Soultz-sous-Forêts fracture network is the question of the fracture size (dv and dh extensions). In a first approach, we define and correlate the fracture extensions according to the importance of flow observed on flow log runs during the injection and stimulation tests in the wells. For example, Fig. 4 puts into evidence two major fracture zones in GPK2, at 4760 and 4890 m depth, where the flow log indicates fluid losses of 24%. Extensions of the fractures in the model are weighted by this ratio of fluid losses (Table 1). Maximal extensions are fixed at 600 m to respect one criterion: a fracture plane that cuts one well cannot intersect the others if no information indicates the presence of such fracture zone on the UBI images. Higher extensions would imply connections between fracture zones and wells that are not practically observed. Finally, 3 main classes of size are separated according to the importance of flow for the different fracture zones: sizes are fixed at 300, 400 or 600 m (disc diameter, Table 1 and Fig. 5).
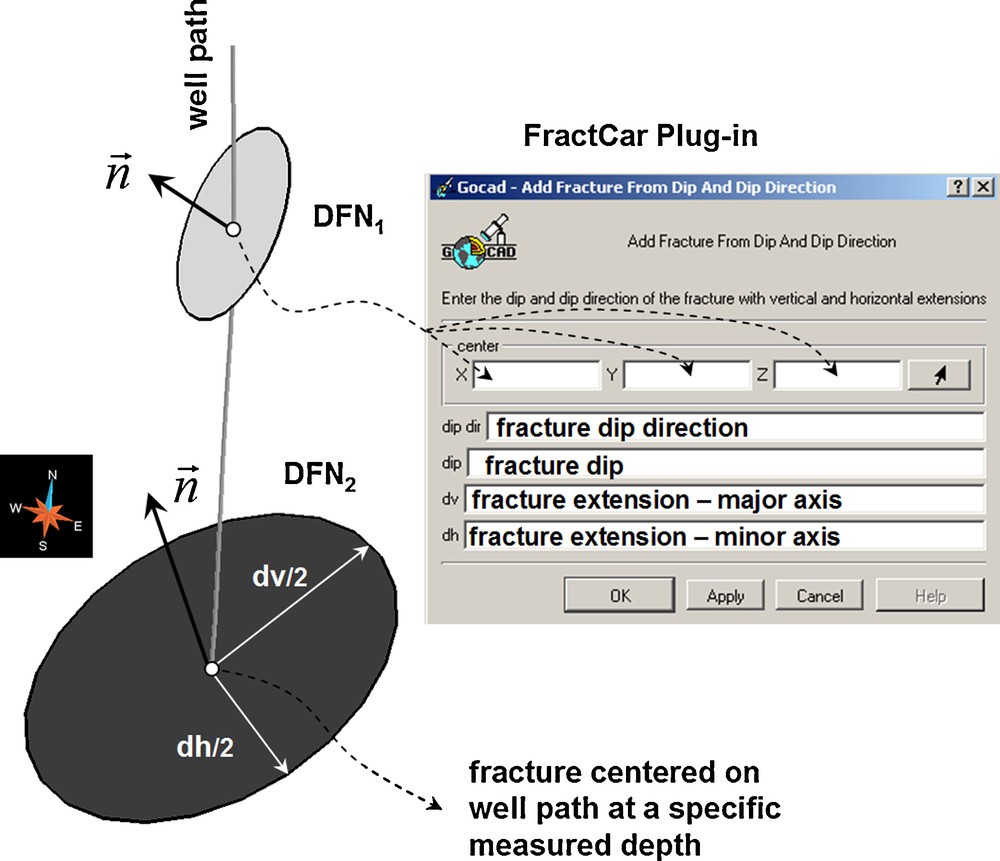
Schematic view of the Discrete Fracture Modelling approach. Fractures are modelled by discs characterized by their orientation (dip directions and dips), extensions (radius dv and dh respectively for major and minor axes of the discs), and the XYZ locations of their centre (intersection with the well paths). The 3D construction is realized with the FractCar plug-in implemented in the Gocad® 3-D earth-modelling software environment (Paradigm™, Earth Decision™).
Vue schématique du modèle de fracture discrète utilisée pour la modélisation 3D. Les fractures sont représentées par des ellipses dont l’orientation est définie par leur direction de plongement et pendage, les extensions sont fixées par la longueur des axes mineurs et majeurs de l’ellipse (rayons dv et dh), et le centre de l’ellipse est localisé à une position XYZ précise correspondant à l’intersection de la fracture avec la trajectoire d’un puits. Cette modélisation utilise le module FractCar implémenté dans Gocad® 3-D earth-modelling software environment (Paradigm™, Earth Decision™).
However, the presence of kilometric scale fault is well known in the Soultz-sous-Forêts Graben site (Renard and Courrioux, 1994). Indeed, one of the fracture zones was specifically treated and was assumed to be a first order discontinuity in the reservoir. This fault zone GPK3-FZ4770 intersects GPK3 at depth 4775 m (Measured Depth MD). Its orientation is coherent with the NNW-SSE main Rhine Graben tectonic and until 70% of fluid losses of are observed at this depth during hydraulic tests.
Tracer tests performed between year 2000 and 2005 in the Soultz-sous-Forêts wells demonstrate that two types of circulation loops are developed between GPK2, GPK3 and GPK4. These tests give evidence of a fast and direct hydraulic connection between GPK3 and GPK2 (short loop) but also indicated the existence of another larger and slower hydraulic connection between GPK3 and GPK4 (large loop, Sanjuan et al., 2006).
A simple extrapolation of the GPK3-FZ4770 plane orientation was tested in gOcad® to check its intersection with the other wells. GPK3-FZ4770 cuts GPK2 but does not cut GPK4. The fault plane is located around 90 m below the bottom of the GPK4 hole. The absence of a direct connection between the open hole of GPK4 and the fault plane could explain these two types of hydraulic behavior. The assumption of the presence of first order discontinuities in the deep reservoir is therefore done and a final extension (disc diameter) of 3000 m is fixed for fracture zone GPK3-FZ4770 (Table 1 and Fig. 5). This extension will be further discussed according to microseismic and VSP results.
3.2 Interpretation of microseismicity during injection tests
The 3D discrete organization of the fracture zones presented in Fig. 5 was matched with the distribution of the microseismic events around the wells.
3.2.1 Microseismicity around GPK2
The microseismic cloud defines a dense zone around the open-hole section of GPK2. Among whole microseismic events, 718 events characterized by magnitudes ranging from 1 to 2.5, were selected by Dorbath et al. (2009).
A clustering approach was performed using some 3D regular grid (voxet) functions available in gOcad®. A 3D grid is built to fit the volume developed by GPK2 microseismic events with a final dimension of m with top and bottom sections respectively at Z = 3630 and Z = 5210 m TVDSS (True Vertical Depth Sub Sea) (Fig. 6). The grid resolution is . Each parallepipedic cell of the grid contains, or not, one microseismic event. Then, the main connected volumic regions of the grid can be defined.
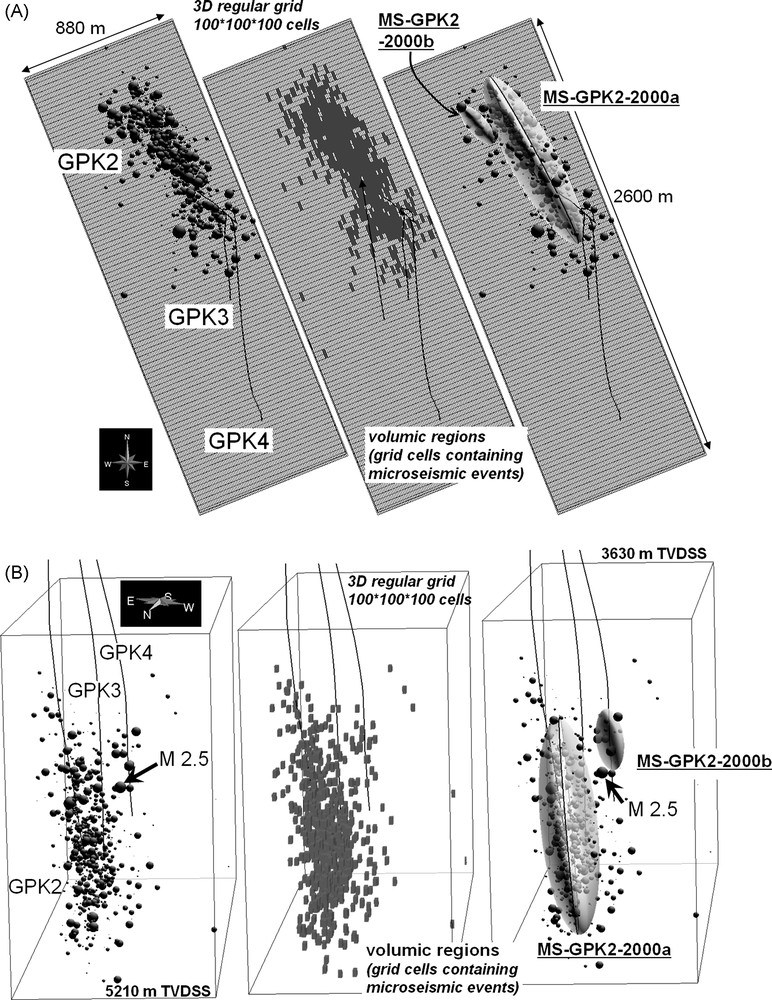
Microseismicity observed during the hydraulic stimulation of GPK2 in 2000 and derived and interpreted structural structures. A. Top view. B. Vertical view. All the microseismic events are plotted within a regular grid including the deepest zone of the reservoir around GPK2, GPK3 and GPK4. A cluster analysis and the use of the best-fit ellipsoid function of gOcad® allow to defined two main microseismic anisotropic structures MS-GPK2-2000a and MS-GPK2-2000b.
Microsismicité observée lors de la stimulation hydraulique de GPK2 en 2000 et placement des structures microsismiques interprétées. A. Vue carte. B. Vue verticale. Tous les événements microsismiques sont positionnés à l’intérieur d’une grille régulière 3D représentant le réservoir profond autour de GPK2, GPK3 et GPK4. Une analyse de clustering est réalisée et deux ellipsoïdes moyens sont ajustés autour des structures microsismiques identifiées comme MS-GPK2-2000a et MS-GPK2-2000b.
Among little isolated microseismic clusters, a biggest one can be defined. The gOcad® best-fit function is used to define first a representative mean ellipsoid including all the events of the connected cells and in a second time the best-fit medium plane of the ellipsoid. This ellipsoid structure is called MS-GPK2-2000a (Microseismic Structure “a” based on the clustered analysis of the seismic events occurring during the hydraulic stimulation of well GPK2 in year 2000, Fig. 6) and is centred around 1004819 m, 2451536 m and 4638 m respectively for the X (Lambert II) Y, (Lambert II) and Z (TVDSS) coordinates. Its related medium plane is oriented 244°, 86° (dip direction, dip) (Fig. 6) and its extension is estimated around 1200 and 700 m respectively for the major and minor ellipsoid axis (Fig. 6).
The microseismic events are anisotropically distributed in this part of the reservoir and forms and clear oriented ellipsoid. Finally, the microseismic cloud observed around GPK2 is characterized by the huge homogeneous MS-GPK2-2000a zone of events. Another significant but small cluster, MS-GPK2-2000b is not only tighter but less anisotropic than the main cluster. Therefore, its medium plane could not be defined as a realistic discontinuity.
Over the 718 observed events, 112 are not covered by these two planes, including 4 among the 26 highest magnitude events (M > 2), and especially the highest one (M = 2.5). The correlations of these 4 isolated big events with other structures will be discussed farther.
3.2.2 Microseismicity around GPK3
The microseismic cloud developed around GPK3 is sparser than that observed for GPK2. Two hundred and forty events are relocated by Dorbath et al. (2009) and define a huge volume, including the depth zone of the three well open-hole sections. The highest magnitude GPK3 event (M = 2.9, Fig. 7) is included in the tight structure MS-GPK2-2000b previously defined (Fig. 6). This fact confirms the location of an important structure in this zone of the reservoir.
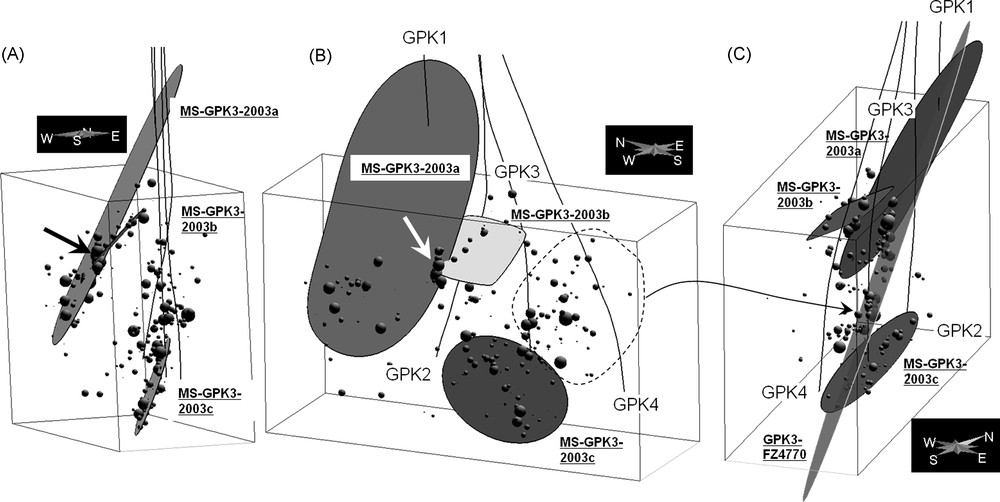
Microseismicity observed during the hydraulic stimulation of GPK3 in 2003 and derived and interpreted structures. A. West-east vertical view. B. North-south vertical view of the deepest part of the reservoir: the alignment and anisotropic distribution of the microseismic events allow for the definition of three medium planes MS-GPK3-2003a, MS-GPK3-2003b and MS-GPK3-2003c. Some of the biggest events appear at the structure intersections (white and black arrows). Some of the events are not described by the 3 structures. C. Fit between the microseismic events not included in the structures and the main huge fault plane GPK3-FZ4770 (corrected dip, see text for details).
Microsismicité observée lors de la stimulation hydraulique de GPK3 en 2003 et placement des structures microsismiques interprétées. A. Vue verticale ouest-est. B. Vue verticale nord-sud du réservoir profond : l’alignement et la distribution anisotrope des événements microsismiques permettent la définition de 3 plans moyens appelés MS-GPK3-2003a, MS-GPK3-2003b et MS-GPK3-2003c. Certains des événements de magnitudes les plus élevées semblent se localiser à l’intersection de ces plans (flèches noires blanches). Quelques événements microsismiques ne correspondent pas à ces plans. C. Calage de ces événements non représentés par les 3 plans moyens précédents avec la zone de faille majeure GPK3-FZ4770 (pendage corrigé, voir le texte pour plus de détails).
Moreover, UBI logging data have shown the existence of an important fracture zone in GPK1, GPK1-FZ3490 (3492 m MD, Table 1, Dezayes et al., 2010). The 3D extrapolation of this fracture plane orientation was tested to reach the deepest part of the reservoir and to observe its relationship with the GPK3 microseismic zones. GPK1-FZ3490 seems to be a good candidate to describe: (1) the tightest GPK2 microseismic structure MS-GPK2-2000b; and (2) the presence of high magnitude events occurring in this zone of depth during the stimulation of GPK3 (Fig. 7). Indeed, along the GPK1-FZ3490 plane, 14 among 29 events of GPK3, with magnitudes higher than 2, are aligned. This structure that fits with GPK1-FZ3490 is called MS-GPK3-2003a and characterized by the same orientation i.e. 257°, 63° dip direction, dip (Table 1). The best-fit medium plane of MS-GPK3-2003a is characterized by a final extension of around 2000 m for its major axis (from 2900 m to 4700 m TVDSS). Its lateral extension is reduced (1000 m). No intersection with GPK2, GPK3 or GPK4 is observed for this structure.
Another spatial pattern that forms scattered clouds is located on the border of MS-GPK3-2003a structure. Inside this subregion of the reservoir, a manual selection of subsets of events presenting an anisotropic distribution in 3D was performed allowing the definition of a fourth microseismic structure called MS-GPK3-2003b. This structure intersects MS-GPK3-2003a and includes two of the biggest events of GPK3 2003 stimulation (M = 2.7, black and white arrows on Fig. 7A and B). Then, applying again the gOcad® best-fit medium plane functions, a 270°, 45° (dip direction, dip) orientation is estimated for MS-GPK3-2003b.
A cluster of events, MS-GPK3-2003c, defines another individual structure around GPK3 in a deepest part of the reservoir. MS-GPK3-2003c is centered on the depth of 4900 m TVDSS, just below the bottom hole of GPK3. Such as for MS-GPK3-2003b, MS-GPK3-2003c shows a tightest 3D development than MS-GPK3-2003a and less anisotropy with major and minor axes around 800 m. The best-fit orientation of MS-GPK3-2003c is 261°, 67° (dip direction, dip).
None of the microseismic events occurring during GPK3 stimulation seems to be included within the main microseismic structure MS-GPK2-2000a observed in GPK2. 20 GPK3 events among the 29 M > 2 events are included within MS-GPK3-2003a, MS-GPK3-2003b and MS-GPK3-2003c structures. The 9 others are sparsely distributed in a large zone surrounding the open holes of GPK3 and GPK4 (dashed line on Fig. 7B). Their locations seem to show some anisotropy but their spreading in the reservoir makes difficult to fit any plane along them. Such as for MS-GPK3-2003a, one test was done to try to match these isolated events with the biggest UBI fracture zone observed at Soultz-sous-Forêts: GPK3-FZ4770.
GPK3-FZ4770 is oriented 234°, 64° (dip direction, dip), cuts the well path of GPK3 at 4775 m MD and is characterized by a minimal extension of 3000 m (Fig. 5, Table 1). The plane orientation does not match exactly with the locations of the remaining high magnitude GPK3 microseismic events. Some dip small modifications were therefore tested for GPK3-FZ4770. One of this test shows that a final orientation of 234°, 71° fits perfectly all of these isolated events. This dip modification leads to a final intersection with GPK2 at 3900 m MD. This depth is well known at Soultz-sous-Forêts because it corresponds to the presence of a huge cave (diameter higher than the caliper 20’ arms) and to a casing leak. At that depth, there is a casing collapse due to a casing rupture. A shearing phenomenon was suspected at this depth due to a casing restriction that could match with the crossing of an important fault zone. In the case of the Soultz-sous-Forêts fracture zones, where clusters of thin, hydrothermally altered conjugated fissures and fractures intersect each other to produce a highly cataclased zone, the choice of realistic values of orientations is complex. The initial orientation of GPK3-FZ4770 was fixed by the mean dip values measured over a dozen of fractures in this zone of depth, several of them showing higher dip than 64°W (Dezayes et al., 2010). The assumption was therefore done to choose a final GPK3-FZ4775 dip of 71°W that allows one to fit technical and structural observations, hydraulic and microseismic criteria (Table 1). This final orientation of GPK3-FZ4770 fits with the isolated big events and with another hundred of GPK3 events of lesser magnitude that did not match with previous structures.
Finally, MS-GPK3-2003a, MS-GPK3-2003b, MS-GPK3-2003c and GPK3-FZ4770 allow to describe 215 among the 240 events (90%) recorded in 2003 during the hydraulic stimulation of GPK3.
3.2.3 Microseismicity around GPK4
The microseismic cloud developed in the vicinity of GPK4 open-hole section is tighter than the others. GPK4 microseismicity spreads in a frame volume of 0.7 km3 (from 3940–5190 m TVDSS) in comparison with respectively 1.95 km3 (from 3950 to 5210 m TVDSS) and 2.9 km3 (from 3630 to 5180 m TVDSS) for GPK2 and GPK3 events. These volumes represent respectively for GPK2, GPK3 and GPK4, 35%, 52% and 13% of the whole volume of the reservoir where microseismicity is observed.
Eight GPK4 events among a total of 128 are characterized by higher magnitudes than 2. These biggest events do not show specific alignments and no realistic planes can be deduced from their locations. However, the biggest one (M = 2.6), observed deeper from the bottom hole of the well, is directly located on the most important GPK3-FZ4770 plane (corrected dip, Table 1). Again, this observation confirms the major structural role of GPK3-FZ4770 in the geothermal reservoir and validates the dip modification from 234°, 64° to 234°, 71° (Table 1).
GPK4 UBI well logs indicate two fracture zones, GPK4-FZ4620 and GPK4-FZ4970, that crosscut the well respectively at 4620 and 4973 m MD (Table 1). The extrapolation of these two planes fits with all the big events observable in the vicinity of GPK4 open-hole section. Moreover and again, the intersection between the huge GPK3-FZ4770 and the extrapolated plane of GPK4-FZ4970 precisely matches with the location of the biggest observed GPK4 event (white and black arrows on Fig. 8). All of these facts validate the definition of 3 main microseismic zones around GPK4: MS-GPK4-20045a and MS-GPK4-20045b that fit respectively with fracture zones GPK4-FZ4620 and GPK4-FZ4970, and the third one is GPK3-FZ4770. The orientations of MS-GPK4-20045a and MS-GPK4-20045b are respectively 285°, 78° and 276°, 81° (dip direction, dip, Table 1). Three fracture zones, previously identified from UBI data, have been proved to concentrate 85% of GPK4 microseismicity.
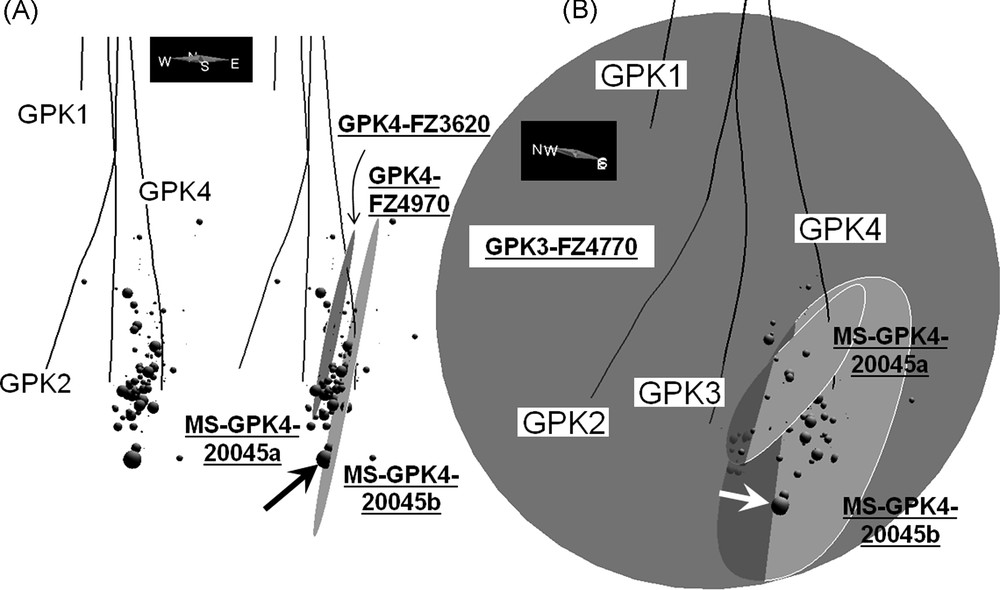
Microseismicity observed during the hydraulic stimulation of GPK4 in 2004 and 2005 and derived and interpreted structural structures. A. West-east vertical view of the deepest part of the reservoir: the alignment and anisotropic distribution of the microseismic events allow the definition of three medium planes MS-GPK4-20045a and MS-GPK4-20045b that correspond to two fracture zones GPK4-FZ4620 and GPK4-FZ4970. B. North-south vertical cross-section showing the location of the biggest GPK4 event at the intersection of MS-GPK4-20045b and the huge fault plane GPK3-FZ4770 (white and black arrows) that include events that are not described by MS-GPK4-20045a and MS-GPK4-20045b.
Microsismicité observée lors de la stimulation hydraulique de GPK4 en 2004 et 2005 et placement des structures microsismiques interprétées. A. Vue verticale ouest-est du réservoir profond : l’alignement et la distribution anisotrope des événements microsismiques permettent la définition de 2 plans moyens appelés MS-GPK4-20045a et MS-GPK4-20045b qui correspondent aux deux zones de fractures GPK4-FZ4620 et GPK4-FZ4970. B. Vue verticale nord-sud montrant la localisation de l’événement microsismique de plus forte magnitude enregistrée à l’intersection entre la structure MS-GPK4-20045b et la faille majeure GPK3-FZ4770 (flèches blanches et noires), qui correspond également aux événements sismiques non décrits par les structure MS-GPK4-20045a et MS-GPK4-20045b.
3.3 Interpretation of VSP data
3.3.1 EPS1 data
One big structure, VSP-EPS1-NI, is located below the bottom hole of EPS1 at a depth of 2290 m TVDSS and characterized by an orientation of 65°, 70° (dip direction, dip, Fig. 9). The well is not deep enough to cut this structure, but its artificial deepening following the local deviation would lead to intersect this structure at a measured depth of 2500 m. Within this range of depth, no correlation can be done with the microseismicity localized in the deepest part of the reservoir.
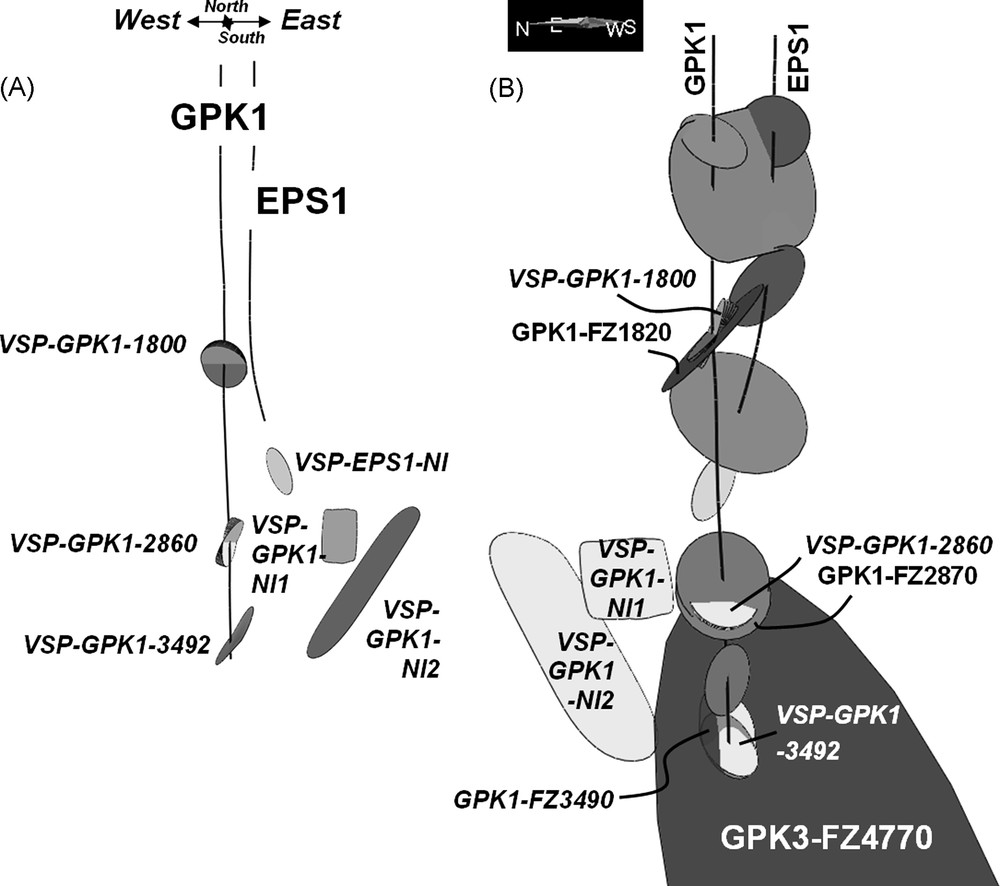
A. Main VSP derived stuctures. B. A good matching is observed between VSP-GPK1-1800 and GPK1-FZ1820, between VSP-GPK1-2860 and GPK1-FZ2870 and finally VSP-GPK1-3492 is coincident with both GPK1-FZ3490 and the main structure GPK3-FZ4770.
A. Principales structures identifiées à partir des études en sismique de puits (VSP). B. Une corrélation correcte est observée entre VSP-GPK1-1800 et GPK1-FZ1820, entre VSP-GPK1-2860 et GPK1-FZ2870 et finalement VSP-GPK1-3492 correspond à la fois à GPK1-FZ3490 et GPK3-FZ4770.
This east dipping plane does not match with the west dipping orientation of GPK3-FZ4770. A potential intersection between VSP-EPS1-NI and GPK3-FZ4770 is possible but no structural or microseismic criterium is available to check this proposal. The hypothesis of a maximal extension of 300 m, such as the intermediate UBI fracture extensions, is done for VSP-EPS1-NI (Fig. 9).
3.3.2 GPK1 data
Three main structures are deduced from the VSP analysis and related to the well path of GPK1 (Place et al., 2007 and Fig. 9). VSP-GPK1-1800 and VSP-GPK1-2860 are identified from two respective linear seismic arrivals; thus they are represented by single discs. However, VSP-GPK1-3490 is more complex as it corresponds to several seismic events probably linked to several reflectors; it is therefore characterized by two main orientations and modelled by the association of two planar surfaces.
VSP-GPK1-1800 and VSP-GPK1-2860 are characterized by a single orientation, VSP-GPK1-3490 is more complex and is characterized by two main orientations and modelled by the association of two associated planar surfaces instead a single disc.
VSP-GPK1-1800 and VSP-GPK1-2860 cut the GPK1 well path at 1800 and 2860 m MD. The azimuth values of these structures are not precisely characterized by the VSP surveys. Nevertheless, within this range of depths, two main fracture zones are described from the UBI log analysis (Dezayes et al., 2010, Table 1 and Fig. 9).
Indeed, GPK1-FZ1820 and GPK1-FZ2870 could match with the VSP structures despite of the slight differences of measured depths (Fig. 9B). However, as well as the orientations, the depth of VSP-GPK1-1800 and VSP-GPK1-2860 is not precisely defined in the current VSP interpretations.
This uncertainty allows to match VSP-GPK1-1800 with GPK1-FZ1820 (27°, 47°, dip direction, dip, Table 1) and VSP-GPK1-2860 with GPK1-FZ2870 (290, 70°, dip direction, dip, Table 1).
The extensions of VSP-GPK1-1800 and VSP-GPK1-2860 are fixed to 300 m for the same reasons as those mentioned for VSP-EPS1-NI.
The third VSP structure, VSP-GPK1-3490, is composite and the VSP surveys allow to fix two main orientations with first, a plane that cross-cuts GPK1 at 3492 m MD, with an orientation of 257°, 55°C and a second plane that does not cut GPK1, with the same dip direction 257° but a higher dip value of 65° (Fig. 9).
At the scale of the 3D model, VSP-GPK1-3490 seems again to fit with GPK3-FZ4770 striking 234° and dipping 71° W (corrected dip). The difference of 6° between the maximal dip values of VSP-GPK1-3490 and GPK3-FZ4770 is acceptable if we keep in mind that the orientation of GPK3-FZ4770 is derived from UBI interpretation and characteristic of a tight section of the well and that the extrapolation of the fracture plane leads to a final extension of 3000 m (Table 1).
Then, two other VSP structures, VSP-GPK1-NI2 and VSP-GPK1-NI1, are identified but do not cross-cut the GPK1 well path. They are characterized by extrapolated depths of 4300 m and 10 000 m with respective orientations of 250, 55° and 250°, 85° (dip direction, dip, Table 1 and Fig. 9). These structures cannot be matched with other structural or microseismic data because of their distance to the wells.
4 3D model exploitation and limits
This model proposes a preliminary view of the 3D fault organization in the reservoir. The major faults consist in west dipping fractures with 3D extensions between 300 and 3000 m.
In the confrontation between large-scale imagery (seismic methods) and borehole imagery, scale problems are encountered. As the resolution of the different methods is not the same (for example, the VSP and UBI MD depth resolution: ten meters versus a few centimeters), the correspondences are tricky. In fact, this problem is only reduced to a “data management” aspect, as the geological structures imaged by the methods are not comparable. Large-scale methods will allow one to delineate the major structures (e.g. faults in their entirety), whereas logging tools will focus on small scale structures (individual fractures and joints). The encountered problem thus becomes resolution power of large-scale methods versus the ability of small scale methods (like UBI) to deduce the orientation of a fault from a cluster of small fractures by subsequent interpretation.
Moreover, in many cases, real faults have a rather complex geometry. The 3D model is based on the construction of smooth surfaces that preserves all the major geometric features. Minor sinuosity or roughness of the fracture planes, which are likely artefacts at the model scale, are not taken into account. Whereas, a best-fit function uses a least-square methodology and gives the average strike and dip of the structures, but it will miss any step, bend, splay, or changes in dip of the fault. The scale related heterogeneity cannot be detected with sufficient confidence at the microseismic and VSP interpretation scales.
The modification of the UBI interpretation of zone GPK3-FZ4770 leading to a 64°W to 71°W correction is characteristic of such problems. GPK3-FZ4770 could be characterized by its UBI derived dip (64°W) in the near vicinity of the GPK3 well path and could be naturally, progressively, slightly bended to reach a final dip of 71°W in the vicinity of the GPK2 well path.
It has been shown in GPK1 that there is a correlation of the peculiar seismic signature (P-S reflection) of fault zones with their high hydraulic conductivity (Place et al., 2007). As this constant elastic behaviour is recognised all along these faults up to several hundreds of meters away from the well, it constitutes a strong evidence of the presence of hydraulic drains at the geothermal reservoir scale.
Therefore, the quantification of the fractured rock hydraulic properties strongly depends on the knowledge of the geometrical parameters of fractures (orientation, extension, aperture, density). However, even if the orientation of fractures can be measured by field observations or borehole imagery, many problems appear when the quantification of their extensions and apertures is considered. The extension parameter will be essential when the probability of fracture intersections (percolation threshold) is calculated. However, the length of a fracture can be measured only if its two lateral ends are visible. In the Soultz-sous-Forêts reservoir and in many other cases, this is not possible. The only criterion stays to respect the fact that fractures are precisely located by UBI on the well paths and cannot artificially appear in the other wells because of too large extrapolations of their extension. Some correlation studies have been done (Valley, 2007; Valley and Evans, 2007) to try to match fractures from well to well but this exercise is complex and not always relevant.
The matching between microseismicity, VSP results and fracture UBI orientations and derived flow-log extensions is therefore the single possibility in this paper to fit a limit of the fracture zone extensions keeping in mind the error bars of 50 m for event relocations. Moreover, the real influence of the fluid on the generation of large microseismic event is still misunderstood and debatable. However, at Soultz-sous-Forêts, some obvious correlations between the apparition and location of the microseismic events and the existence of the huge fault zone such as GPK3-FZ4770 have been discussed since a long time (Charléty et al., 2005). The matchings between the main microseismic anisotropic structures and the fracture zones derived from UBI study are another clue to try to understand this link between the fluid pressure propagation and the fault plane development in the reservoir.
The recent VSP survey (April 2007) performed at Soultz-sous-Forêts in the deep wells will probably help to improve the 3D model of the deep fracture zones developed within the EGS reservoir.
At the regional scale, geological mapping, borehole logs from the Pechelbronn oil field and surface reflection seismic were previously used to characterize the geological structure of the Soultz-sous-Forêts site in its sedimentary part. A series of seismic profiles was available, calibrated on former oil wells and reinterpreted in order to better define the structure of the Soultz-sous-Forêts horst. A 3D geological model was built thanks to previous seismic profile interpretations (Renard and Courrioux, 1994) and updated recently (Castéra et al., 2008). It shows mainly dip-slip faults striking nearly parallel to the graben axis, i.e. close to north-south direction. They are preferentially dipping to the west, i.e. antithetically to the western graben border fault (Genter et al., 2007). However, no direct link could be done between the 3D regional scale model of Renard and Courrioux (1994) in the sediments and the 3D basement reservoir scale model proposed in the paper. Is this absence of link due to the difference of resolution between the two types of data? Could this difference be linked to a decoupling of stress and strain between the sediments and the granites? New and very recent studies are still engaged to try to understand the structural organization at this regional scale using new seismic data. Recent reflection seismic interpretation indeed shows that a decoupling of the deformation between the sediments and the basement may occur within some Triassic salt or clay levels (Place et al., 2010). The integration of such results in a 3D model as presented by the present article or by Castera et al., 2008 will be necessary to constrain the structural sketch of the Soultz-sous-Forêts area. A future perspective of this work is therefore to integrate all the scales of fracturation and faulting in the Soultz-sous-Forêts geothermal site by combining structural information collected in the sediments and in the basement.
5 Conclusion
The Soultz-sous-Forêts site is the object of various and numerous studies since 1987. The knowledge of the fracture distribution in wells is optimal thanks to numerous structural and geophysical studies. Finally, 53 structures are defined in the vicinity of the geothermal plant and between depths of 800 to 6000 m TVDSS. 39 fracture zones, 7 microseismic structures and 6 VSP derived structures are represented in the 3D model (Table 1 and Fig. 10). The matching of these various geophysical approaches shows that fractures described at the well scale could be extrapolated at the reservoir scale to propose new guidelines for a global 3D model of the Soultz geothermal reservoir.
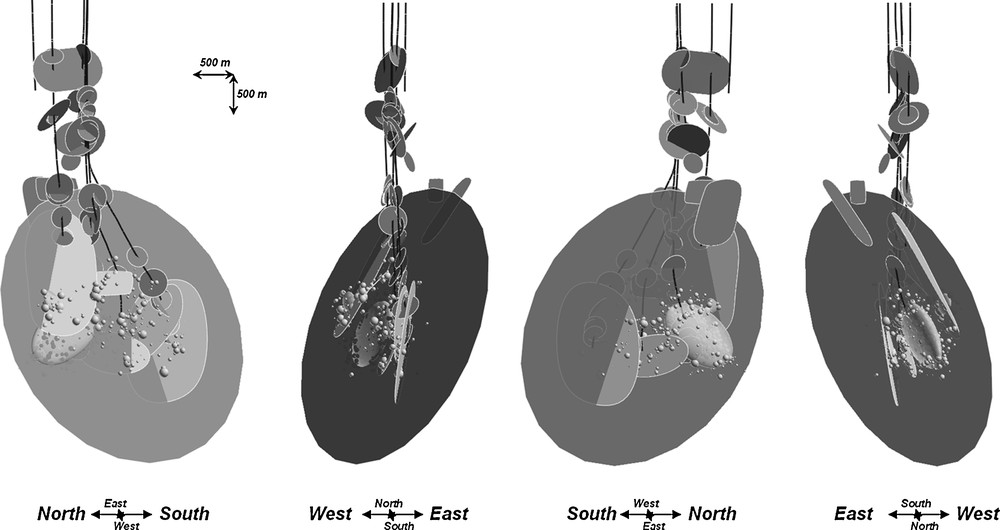
Four final 3D views of the whole modelled faults cross-cut by the wells or derived from VSP and microseismicity interpretation.
Quatre vues finales 3D montrant l’ensemble des zones de failles recoupant les puits ou déterminées à partir des interprétations du nuage microsismique et des études de sismique de puits.
Acknowledgements
This work has been carried under financial support of the Specific Targeted Research Project under the sixth Framework Program of the European Community ‘EGS Pilot Plant’ as well as ADEME. EHDRA working group 6 and 7 teams are kindly thanked for their contributions. Particular thanks are due to all my co-authors for our fruitful and friendly meetings leading to the construction of the 3D Soultz-sous-Forêts model. Acknowledgements are addressed to the anonymous reviewers that help to improve the manuscript.