

1 Introduction
This article aims to present a preliminary evaluation of soil gas measurements carried out around Lake Pavin during three campaigns staggered from August 2008 to September 2009. Such measurements were initiated following new 14C dating that suggested the occurrence of phenomena related to volcanic activity around 2130 ± 40 BP and 340 ± 40 BP (Del Rosso and Bernardi; Lavina and Del Rosso, pers. comm.). Previously, the phreato-plinian volcanic phase, which led to the emplacement of Pavin crater lake, was dated at 6700 ± 200 years (Boivin et al., 2003), constituting the most recent volcanic event in metropolitan France. Another phreatomagmatic phase, dated at 3450 years, has also been proposed by Brousse (1969), but has not been confirmed since then.
As a consequence, these possible recent events led us to examine if some gaseous species, especially those known to be frequently affected by deep processes, such as CO2 or 4He, may be affected by effects linked to these last volcanic episodes. This study aims to analyze the characteristics of gas emanations, including CO2, in order to determine if there are evidences of hydrothermal activity, experiencing reactivation or not. By the late 1980s, this theme, related to natural hazards that can potentially represent Lake Pavin, has been explored through the determination of the origin of the CO2 gas phase and its quantification in the lake itself (Camus et al., 1993; Michard et al., 1994). Later on, solute fluxes were estimated (Viollier et al., 1995), profiles characterising dissolved and rare gases were performed as well as isotope analyzes in order to clarify the dynamics and the material balance of the lake (Olive and Boulègue, 2004). However, until now, no quantification of the distribution of the gas content in soils was performed. Only spot monitoring were made by Del Rosso and Bernardi (pers. comm.) on some piezometers at varying depths, concentrations rising up to 5% being measured at Escarot (Fig. 1), 7% near a peat bog (Estivadoux) and up to 10% in a piezometer located under the outlet of the lake.

Location of the study area. Left side: simplified geological map, from the 1/1000000th French synthetic map (BRGM). The dashed lines represent the supposed fracturation of the area, after Lavina and Del Rosso (pers. comm.), white squares represent the sampling points and the rectangle indicates the location of Escarot; the background picture is taken from Google Earth.
Localisation de la zone d’étude. Partie gauche : fond géologique simplifié, issu de la carte géologique 1/1000000e du BRGM. Partie droite : les tirés représentent la fracturation supposée de la zone d’après Lavina et Del Rosso (pers. comm.), les carrés blancs les points d’échantillonnage et le rectangle la localisation d’Escarot; le fond photographique est issu de Google Earth.
Soil gas monitoring techniques are used here to measure the levels of CO2, CH4, O2, 4He and 222Rn, in that sense following the approach initiated in the 1970s, particularly through researches in geothermal, mineral and hydromineral resources, as well as for volcanic and seismic monitoring (Aubert and Baubron, 1988; Israel and Bjornsson, 1967; Koga et al., 1983; Sidle, 1984; Sugisaki, 1978; Sugisaki et al., 1983). The soil gas method experienced further applications and developments in the last decade through studies of CO2 storage sites or natural analogues (e.g. in Europe: Annunziatellis et al., 2008; Battani et al., 2010; Beaubien et al., 2008; Gal et al., 2010; Krüger et al., 2009; Pauwels et al., 2007). Joint quantification of several gases can indeed help increase accuracy in detecting abnormalities associated with leakage of structural discontinuities in the crust (faults, magmatic fumaroles…) and energy flows (Baubron and Sabroux, 1984; Baubron et al., 2002; Ciotoli et al., 1999; Guerra and Lombardi, 2001; Klusman and Jaacks, 1987; Walia et al., 2010). Indeed, soil gas monitoring combines the quantification of ubiquitous species in soil atmosphere (CO2 and O2) with that of radon-222 activities and helium-4 concentrations, both gases originated from the decay chain of uranium-238. These two gases have different origins and properties, which may allow better characterization of areas where important CO2 levels are encountered. Radon is a rare gas almost chemically inert, with poor intrinsic mobility. It is produced through the decay chain of uranium-238 and decays itself in a short period. Radon detected in soil has a near surface origin, but may indicate the presence of an area marked by advection processes of water or other gases. We therefore use radon to highlight areas where its own emanation is more important than the one only resulting from local geological background. The determination of helium concentrations is used to complete the set of analyzed gases, as this element may also reveal the presence of drains or structures with significant permeability. Helium contents may indeed deviate significantly from the average atmospheric concentration, indicating the existence of deep discharges or hydrothermal seepages (Toutain and Baubron, 1999). Due to its inert chemical nature, helium does not interact during migration from its source to the surface. At the opposite, helium is a very mobile element and therefore spreads very easily (its diffusion coefficient is almost 10 times that of CO2).
2 Geographical and geological settings
The study area lies between 1100 and 1400 m a.s.l. The majority of the measurements were carried out between 1200 and 1300 m height, the outlet of Lake Pavin being located at 1197 m (Fig. 1). This area of 30 km2 covers the entire feeding area of the lake (approximately 2 km2, Del Rosso and Bernardi, pers. comm.). Mean annual temperature recorded at Besse-en-Chandesse, located 4 km north-east of the lake, is 6.3 °C, with more than 100 days of frost per year (http://www.drire.gouv.fr/auvergne/telechargement/saveQualit%E9DeLairVol1.pdf), and rainfall amounts ranging between 1200 and 1600 mm per year (Devaux, 1980).
Geologically, the group formed by the Montchal, Montcineyre and Pavin volcanoes (Fig. 1) is located along a N160° to N170°E vertical fault. In addition, the Pavin–Montchal group is located at the southern end of a N105° to N125°E dyke group, linked to the Sancy stratovolcano (Lavina, 1985) or to the Chaîne-des-Puys volcanic series (Boivin et al., 2003). Finally, Lavina and Del Rosso (pers. comm.) identify a north-south graben, 2.5 km wide, intensely fractured and now completely filled, emplaced at the base of the Pavin–Montchal system and extending 8 km southward. At greater geographic scale (Fig. 1), this volcanic system is part of the large French Massif Central volcanic field with magmatic activity beginning in the Late Mesozoic and continuing through to the Holocene, with much of the volcanic activity taking place at 4–6 Ma (Wittig et al., 2007), and is emplaced close to the 45°30′N parallel that evidenced a major chemical discontinuity in the sublithospheric mantle (Lenoir et al., 2000). Alpine orogeny was also responsible of crustal faulting that led to the emplacement of Cenozoic grabens, the Limagne one (east from Pavin area) being the largest sedimentary basin of the French Massif Central. All those geological formations lie on Variscan terrains that result from a succession of 6 tectonometamorphic events that occurred between Silurian to Stephanian times (Faure et al., 2009).
Various hydrothermal venues and carbogaseous springs, as well as spot emissions of CO2, are also reported in the study area. This regionally known CO2 has carbon isotope ratios that bind it to a magmatic origin in the upper earth mantle, linked to attenuation and fracturing of the continental crust beneath the Massif Central (Olive and Boulègue, 2004).
3 Methods
Investigations carried out around Lake Pavin are built from the procedures for measuring gases in the soil. The detailed methodology used by the authors can be found e.g. in Michel-Le Pierrès et al. (2010) and is, in great part, from that used e.g. by Baubron and Sabroux (1984) or Baubron et al. (1992). We just recall here the basic principles of those methods.
CO2 concentrations, like that of CH4 and O2 concentrations, are measured onsite, the equipment used also allowing to collect samples for helium and radon analysis. Sampling and measurements are conducted at a constant depth of 1 m, first to allow comparison between measurements acquired at different times, and second to limit the influence of atmospheric gases (Hinkle, 1994). CO2 and CH4 concentrations are determined by nondispersive infrared absorption and the concentrations of O2 by electrochemistry (LFG20 gas analyzer, ADC Gas Analysis Limited, UK).
222Rn activities are determined by photomultiplication counting using samples taken in dedicated flasks (“Calen” counter, Algade, France), between 3 and 6 hours after onsite collection. This time interval is needed to reach equilibrium in the flask and allow the disappearance of 219 and 220 radon isotopes, alpha emitters with very short period. Hourly measurements of radon activities at a specific location (Escarot) were also conducted using a Barasol probe (Algade, France), which measures activities by absorption spectrometry via a silicon detector.
Last, helium is quantified by mass spectrometry (leak detector Adixen ASM102S, France) with reference to the atmospheric content (5.24 ppm), using samples stored in Tedlar bags and analyzed on a semi-daily basis. The measured species is the 4He isotope, the most abundant one, whose concentration approaches the one of total helium (Oliver et al., 1984).
Occasionally, additional sampling was carried out in glass bulbs to determine δ13CCO2 isotope ratios at laboratory by mass spectrometry (Delta S Thermo/Finnigan or Gas Bench system associated with a Delta + XP). δ13CCO2 isotope ratios are expressed relatively to the standard reference Vienna Pee Dee Belemnite (‰ VPDB). Other gaseous species present in these samples are also quantified by gas chromatography (Varian 3400), the following species being monitored: CO2, H2S, Ar, O2, N2, He, H2, CnH2n+2 (n = 0 to 6).
Spot measurements were conducted in August and September 2008, February, April and September 2009, and acquisitions by the Barasol probe have been initiated in May 2009.
The interpretation of results should always be made in conjunction with weather conditions that prevailed before and during the measurement campaigns. Numerous of factors may affect the emission of gases (Finkelstein et al., 1998; Toutain and Baubron, 1999): climatic ones (atmospheric pressure, temperature, soil moisture, wind effects and ventilation), but also intrinsic soil characteristics (composition, structure) and external forcing (diurnal variation linked to the sun, solar activity, earth tides). These factors primarily affect radon, but also CO2 (Heinicke et al., 1993) and helium (Virk and Walia, 2001).
In this study, temperatures and pressures records were only collected since May 2009 by the Barasol probe. For the other campaigns, we refer to the weather history database of Météo-France (Table 1). The year 2008 was wetter than the 30 years average, but the sampling periods have not been greatly affected by this rainfall excess. On the other hand, 2009 was a dryer year, only springtime being rainy. As the sampling strategy was focused on a complete scan of the area in 2008 and on specific areas in 2009, for which some data were then already available, it appears that weather conditions do not constitute the major factor explaining the variability of the measurements. This is particularly due to the fact that large amounts of rainfall on short time intervals are needed to significantly alter the concentrations of soil gas at depth. Hinkle (1994) reports a quantity of 50 mm likely to affect the CO2 concentrations at 70 cm depth in Hawaiian soils, which are naturally quite moist. Moreover, we performed measurements at a greater depth, where the external forcing has a smaller influence (Wattananikorn et al., 1998). This statement is corroborated by the Barasol data: between 16 May and 7 September 2009, soil temperatures varied only between 8.28 and 15.25 °C (mean value: 12.77 ± 1.61 °C), whereas, for example, air temperatures ranged from 13 to 26.2 °C in August 2009 in Aurillac. Thermal attenuation in soils is well highlighted. Pressure measurements do not follow the same behaviour. As the Barasol probe is driven into the ground via PVC tubing, pressure changes replicate those of the atmosphere directly, and therefore are more variable over the same period. Barometric pressure, corrected to sea level, varied between 1002.7 and 1033.6 mbar (mean value: 1022.4 ± 4.5 mbar).
Paramètres météorologiques au cours de campagnes de mesure; d’après http://france.meteofrance.com; la station météorologique de Clermont-Ferrand (331 m) est située à 30 km au NNE du Pavin; la station d’Aurillac (639 m) à 70 km au SSW du Pavin.
| Clermont-Ferrand | Aurillac | |||
| Tmin/Tmax (°C) | Rainfall (mm) | Tmin/Tmax (°C) | Rainfall (mm) | |
| Year 2007 | 7.1/16.8 | 587 | 5.4/15.2 | 1131 |
| Year 2008 | 6.5/16.6 | 734 | 5.1/15 | 1281 |
| Year 2009 | 6.9/17.4 | 510 | 5.2/15.9 | 1073 |
| Mean 1971-2000 | 6.1/16.3 | 592 | 4.9/14.6 | 1232 |
| Pavin area | ||||
| Climatological norms | Rainfall (mm) | |||
| August 2008 | Slightly more humid than norms | # 60 | ||
| Similar temperatures than norms | ||||
| September 2008 | Rainfall deficit | # 100 | ||
| Temperatures lesser than norms (by 1 °C) | ||||
| February 2009 | Rainfall deficit | # 50 | ||
| Temperatures lesser than norms (by 1 °C) | ||||
| April 2009 | Rainfall excess (by a factor 2) | # 200 | ||
| Temperature greater than norms | ||||
| September 2009 | Rainfall deficit (50%) | # 60 | ||
| Similar temperatures than norms | ||||
4 Results and discussion
4.1 Spot data
Concentrations ranges for monitored gases are reported in Table 2. The CO2 content varies between subatmospheric one to 100% (vol.). The oxygen content is inversely correlated and varies between 21.2 and 0% (vol.). Radon activities are comprised between 10 and 83,500 Bq/m3, helium concentrations between 5.1 and nearly 50 ppm. A majority of the measurements were made during periods of biological activity in soil: for CO2, 203 measurements were performed in August and September 2008, 6 in February 2009, 70 in April 2009 and 36 in September 2009.
Teneurs mesurées en gaz des sols autour du lac Pavin, par mesure directe (haut) et sur prélèvement au laboratoire (bas).
| CO2 (%) | O2 (%) | 222Rn (Bq/m3) | 4He (ppm) | |||
| Nb. of meas. | 315 | 307 | 240 | 88 | ||
| Minimum | 0.03 | 0 | 10 | 5.14 | ||
| Maximum | 100 | 21.2 | 83500 | 47.74 | ||
| 1st Quartile | 0.37 | 17.2 | 3180 | 5.23 | ||
| Median value | 0.93 | 19.6 | 10800 | 5.25 | ||
| 3rd Quartile | 3.1 | 20.4 | 20800 | 7.52 | ||
| Mean value | 9.03 | 17.6 | 15000 | 9.28 | ||
| Std. dev. | 24.9 | 5 | 16000 | 8.27 | ||
| CO2 (GC) | O2 (GC) | N2 (GC) | Ar (GC) | CH4 (GC) | δ13CCO2 (‰ VPDB) | |
| Nb. Of meas. | 8 | 8 | 8 | 8 | 4 | 8 |
| Minimum | 0.63 | 0.2 | 1.3 | 0.02 | 0.001 | −25.5 (CO2 = 1.6%) |
| Maximum | 99.5 | 20 | 79.5 | 1.04 | 0.012 | −3 (CO2 = 99.5%) |
| 1st Quartile | 1.6 | 13.6 | 77 | 0.89 | 0.001 | −23.9 |
| Median value | 2.98 | 18 | 77.4 | 0.93 | 0.001 | −23.1 |
| 3rd Quartile | 6.68 | 19.8 | 78 | 0.97 | 0.004 | −22.8 |
| Mean value | 15.92 | 14.9 | 68.3 | 0.83 | 0.004 | −21 |
| Std. dev. | 31.8 | 6.7 | 25.3 | 0.31 | 0.005 | 6.9 |
Moreover, there is a very good correlation between measurements made on the field and laboratory measurements. The 8 samples analyzed show a very slight overestimation of CO2 quantified by infrared detection on the field (+0.12%), and consequently a slight underestimation of the O2 levels quantified by electrochemistry (–2.3%). Other detected gases are atmospheric compounds, namely nitrogen and argon (Table 2), in quantities close to the atmospheric levels except for the sample at 99.5% CO2. Traces of methane have sometimes been reported, the maximum (120 ppm) was encountered in the periphery of a peat bog.
The CO2 concentrations mostly fall below 10% (vol.), except for specific areas that will be discussed later (Fig. 2). This pivot point allows to define two different groups, and consequently two different behaviours, between CO2 and O2. The first one, valid for CO2 concentrations lesser than ten percent (line “a” in Fig. 2), shows a very rapid decrease in oxygen concentrations as the carbon dioxide content increases, whereas the second one (line “b” in Fig. 2) shows a less steeply decrease. The relative depletion of O2 for the first group is done five times faster than for the second, respective relationships being, for a threshold value taken at 11% CO2: O2 = −0.95 × CO2 + 20.4 (n = 283; r2 = 0.66) and O2 = −0.2 × CO2 + 20.8 (n = 32; r2 = 0.94).
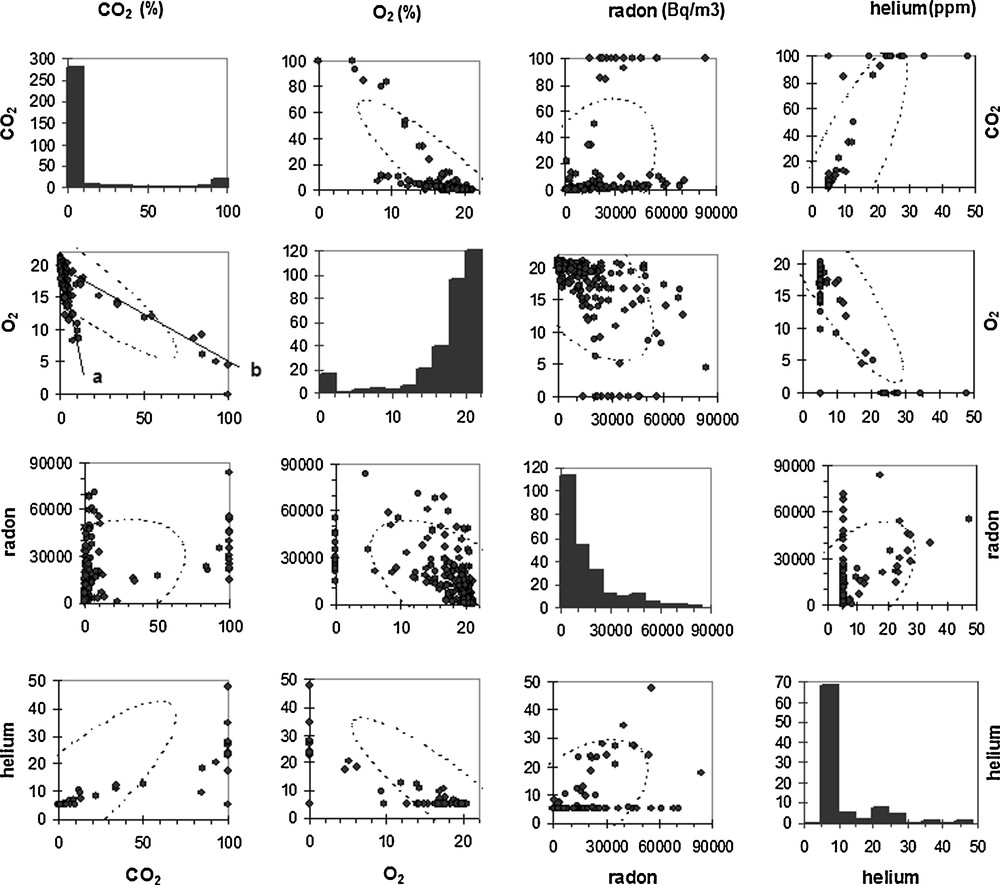
Relationships between gaseous species detected in soils; for significance of a and b labels, please refer to text.
Relations entre les gaz mesurés dans les sols; pour la signification des indices a et b, se référer au texte.
This observation therefore leads us to distinguish the two following cases:
- • the more frequent case, where oxygen levels decline rapidly as CO2 levels increase (range 0.03 to 11% CO2 approximately). Given maximum CO2 concentrations encountered in natural environments where CO2 emissions mainly result from biogenic processes (Gal et al., 2010; Michel-Le Pierrès et al., 2010), it is quite likely that the main mechanism of oxygen depletion is consumption of this gas by biological processes. This seems to be confirmed by the carbon isotope analyzes (Table 2). Samples with CO2 concentrations between 0.6 and 13.8% have isotope ratios of −22.3 to −25.5‰ VPDB (average −23.6‰), typically in the field of CO2 produced from temperate climate vegetation ruled by Calvin photosynthesis cycle (−22 to −25‰ VDPB; Bakalowicz, 1979). In this perspective, the variability detected in the measurements may be based on the intensity of biological phenomena at the sampling point (inducing different CO2 levels), the nature of the overlying vegetation or the result of re-equilibrations between free CO2 and CO2 dissolved in soil pore water, as the moisture content of soils may vary (Amiotte-Suchet et al., 1999);
- • the second case, less frequent, which suggests that oxygen depletion operates at a much slower rate. This lower oxygen consumption, that is not linked to the sampling period, indicates that the processes needing oxygen to occur are not preponderant. On the other hand, CO2 levels for which this relationship is verified are high compared to average values commonly reported in soils (around 4%, Brooks et al., 1983). An additional mechanism, provider of CO2 but not of O2, should exist. In the context of the Massif Central, an endogenous process bringing additional CO2 can be invoked. In this case, the isotopic ratio of the gas will be very different from that produced by biological activity, and close to −4 to −8‰ VPDB (Gerlach and Taylor, 1990). Moreover, the existence of a deep CO2 flux is also known in this area, both at the Goyon mineral spring and in Lake Pavin itself (Assayag et al., 2008; Olive and Boulègue, 2004). This other occurrence of a deep gas vent seems then to be verified in the present case, since the sample with 99.5% CO2 provides a δ13CCO2 at −3‰ VPDB.
In order to confirm this hypothesis, i.e., the existence of localized areas characterised by high CO2 content originated from depth, let us examine 4He and 222Rn measurements.
Helium measurements have a median value almost identical to that of the atmosphere (Table 2), indicating that there is no widespread supply of helium in the area. Nevertheless, very important concentrations, exceeding 10 ppm, were measured for samples having 10% CO2 or more (Table 2, Fig. 2), but these helium rich samples do not correlate with radon amounts (Pearson's correlation coefficient of the 4He/222Rn ratio: 0.4). Accordingly, a common production mechanism for both radon and helium gases (i.e., production via the decay chain of uranium-238) does not seem to be a valuable explanation. A deeper origin of helium still seems the most likely, especially as the correlation between CO2 and helium is fairly good (Pearson's coefficient: 0.88). Yet, for nearly pure CO2 soil atmospheres, levels in helium are highly variable, covering the entire range of variation. Demixing phenomena in varying proportions, both quantitative and spatial, could cause these variations in the helium content of soils. Thus an area marked by a strong gas flux from depth is able to quickly carry the gas up to the surface without separation between species, while an area with a smaller and/or slower flux may allow the helium to degas preferentially, inducing the measurement of low helium levels. This led, as will be seen later, to the definition of anomalous areas with a smaller spatial extension for helium than for CO2 (Annunziatellis et al., 2008). The occurrence, at Escarot, of both an important CO2 flux, clearly of magmatic origin, and high helium concentrations, emphasizes the specificity of this mofette, unlike other ones encountered in the Massif Central (Battani et al., 2010).
Radon activities measured in soils around Lake Pavin do not exceed 90,000 Bq/m3 (Table 2), a rather low value compared to those encountered in the Limagne d’Allier (Gal et al., 2010). As highlighted in the introduction, the combined use of radon and CO2 quite often highlights a good statistical relationship between these two gaseous species, the latter playing the role of carrier phase of the first (Etiope and Martinelli, 2002). In the present case, such an agreement is not established (Pearson's coefficient = 0.42), since high activities can be measured at low or high CO2 content (Fig. 2). Frequently this relationship between CO2 and radon is attributed to the achievement of an optimum of the ratio “radioactive decay/radon transfer speed” without dilution by the CO2 phase. Consequently, measurements that are performed at the vertical of a more pronounced CO2 upflow zone should deliver a diluted radon signal and thus lower activities (Baubron et al., 1992). Here, the highest activities are measured near the Escarot area that is also characterised by strong CO2 anomalies and uncommon helium enrichment. Regarding the available data, we cannot invoke a dilution effect to explain the CO2–radon relationships at the Escarot mofette. On the other hand, it is possible that the heterogeneity of the volcanic formations lying at the surface masks this “plume” effect of the CO2. Apart from this particular area, the poor correspondence between CO2 and radon may also be influenced by other carrier gas, e.g. such as N2 (Hong et al., 2010; Walia et al., 2010).
These contrasted behaviours between the different gases are used to produce a synthetic map of the study area (Fig. 3). The interpolation technique used is the natural neighbour one. Krigging interpolation is not used, as semi-variogram calculations suggest a too prominent nugget effect, which makes this method poorly suited. From the natural neighbour mapping the following points emerged:
- • the Escarot area is by far the most anomalous one of the sector and has all the characteristics of a deep fed mofette: very high CO2 and helium contents, slightly depleted carbon isotope ratios. The mofette cannot be highlighted using radon activities, for the reasons mentioned above. The interpolated helium map cannot help to define a preferred direction for degassing, this effect being induced by the calculating procedure. In contrast, high CO2 levels are almost aligned along a north-south direction, which is the same as the one proposed by Lavina and Del Rosso (pers. comm.) for tectonic structures. This area is however limited to a relatively small extent, that we were able to visually estimate the extension in April 2009, thanks to the presence of a water saturated–upper soil layer due to snowmelt. Many gas exhausts, mainly of pure CO2, were identified in a 400 m long (north-south) and 100 m wide (east-west) corridor, centered on the so-called Escarot mofette;
- • a second CO2 anomalous zone can be identified in the immediate vicinity of the carbogaseous Goyon mineral spring, which is understandable through the occurrence of stripping and phase separation phenomena during the upwelling to the surface. In this area, no significant anomaly in helium contents is found, probably indicating a fluid circulation occurring under moderate to low fluxes;
- • apart from both the above-mentioned areas, some smaller scale anomalies are highlighted in Fig. 3, but often linked to the existence of few measurements (mapping bias induced by the interpolation method). Two of these areas are located southward and south-eastward from Lake Pavin, but do not show apparent relationship with the geological structures. A third, perhaps more significant (larger number of measurements), is aligned along a NE–SW direction between the mofette and the lake, that may correspond to a direction also highlighted by Lavina and Del Rosso (pers. comm.);
- • finally, the radon behaviour results from a combination of complex processes, namely emanation, diffusion and/or advection/convection, and finally exhalation ones (Ielsch et al., 2010). As a whole, such an intricacy makes interpretations difficult to perform using the current dataset, except in the vicinity of the Escarot mofette, where this method can help to better define gas dynamics when a deep rising gas is present.

Synthetic map of the study area: contours of the CO2, helium and radon activity concentrations are done using the natural neighbour interpolation method; red dashed lines figure the structural sketch as proposed by Lavina and Del Rosso (pers. comm.).
Cartographie synthétique de la zone d’étude : interpolations (méthode du voisin naturel) des teneurs en CO2, hélium et des activités en radon; les tirets rouges représentent le schéma structural de la zone tel que proposé par Lavina et Del Rosso (pers. comm.).
4.2 Hourly radon measurements
In order to take into account the better knowledge of the mofette the radon may bring, long-term radon monitoring has been done at Escarot. The Barasol probe was emplaced at 60 cm depth, in one of the most anomalous location, where the CO2 content was measured at 100% (2 measurements) in April 2009 (δ13CCO2 = −3‰ VPDB; 1 measurement), together with radon activities of 40,000 to 55,400 Bq/m3 and helium concentrations of 34.5 to 47.7 ppm. 222Rn activity, soil temperature and atmospheric pressure measurements extend from 11 May to 7 September 2009 (Table 3).
Statistiques calculées sur les enregistrements de la sonde Barasol (2764 mesures horaires).
| 222Rn (Bq/m3) | Soil temperature (°C) | Barometric pressure (mbar, normalised to sea level) | |
| Minimum | 54,700 | 8.28 | 1002.7 |
| Maximum | 102,900 | 15.25 | 1033.6 |
| 1st Quartile | 66,900 | 11.48 | 1020 |
| Median value | 72,400 | 13.24 | 1023.2 |
| 3rd Quartile | 79,400 | 14 | 1025.6 |
| Mean value | 73,800 | 12.77 | 1022.4 |
| Std. dev. | 9200 | 1.61 | 4.5 |
Radon activities measured since May are on average higher than those measured punctually in April. This variability in radon activity over time is clearly visible in Fig. 4, and is not related to pressure and/or temperature changes. Pressure variations are dictated by the alternation of anticyclones and depressions in the study area. Temperature variations reflect the gradual soil warming during summertime, the thermal optimum being reached at mid-August.
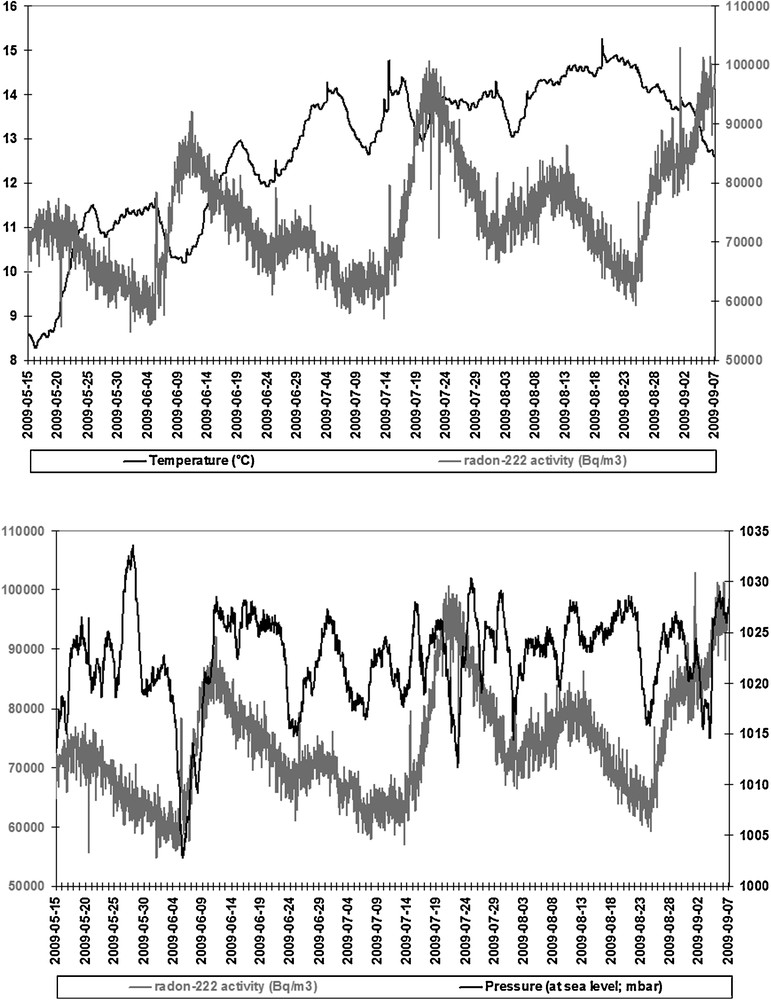
Hourly variations of radon-222 activities, soil temperature and atmospheric pressure–Escarot mofette–period from the 11th of May to the 07th of September 2009.
Variations horaires des activités en radon-222, de la température du sol et de la pression atmosphérique–zone de la mofette d’Escarot–période du 11 mai au 07 septembre 2009.
This meteorological derived information does not allow to identify a predominant mechanism leading to the occurrence of low or high radon activities. For example, the beginning of June is marked by a strong depression episode, with several tens of millimetres of rainfalls. Nevertheless, the radon activities measured in June do not differ from those found a few days before rainfall occurrence. This is surprising, as a rainy episode is expected to cause either a decrease in activities by partial dilution of gas in water, or an increase by induced barrier effect, and, simultaneously, a decrease in atmospheric pressure will tend to increase the concentrations of gases by pumping effect (Charlet et al., 1989; Finkelstein et al., 1998; Garavaglia et al., 1998; King, 1985; Kumar et al., 2009; Richon et al., 2003). At other times, a drop in activity is found contemporaneously with rainfalls (23 August), or, in other cases, an increase (22 July). The temporal evolution of radon activities thus relies upon other factors.
There is no more relationship with temperature, neither diurnal nor seasonal dependence (Fig. 4). High activities (> 80,000 Bq/m3) are both measured in cool (11 °C) or warmer (15 °C) soil. At hourly time scale, this lack of relationship is reflected by a Pearson's correlation coefficient of only 0.147.
Other phenomena may contribute to the observation of variations of the radon activities, in particular the existence of cycles in the production of CO2 in soil (Reardon et al., 1979). Nevertheless, this hypothesis is here unlikely, as the very high CO2 levels encountered would mask the possible influence of organic production, which could only contribute to some percents and not tens of percents. Moreover, the CO2 gas phase has been identified to be of endogenous origin.
The most plausible explanation is a connection between radon activity trends and changes in CO2 emissions related to deeper causes. Density spectra analysis suggests a long-term determinism of the radon activity pulses (Fig. 5). Indeed, if temperatures preferentially evolve on a daily basis, and pressures on a semi-daily basis, two other trends seem to exist. The first one concerns pressure evolutions, suggesting the existence of a 460 hours-long period (c.a. 20 days); the second, concerning radon evolution, a 920 hours-long period (c.a. 40 days).
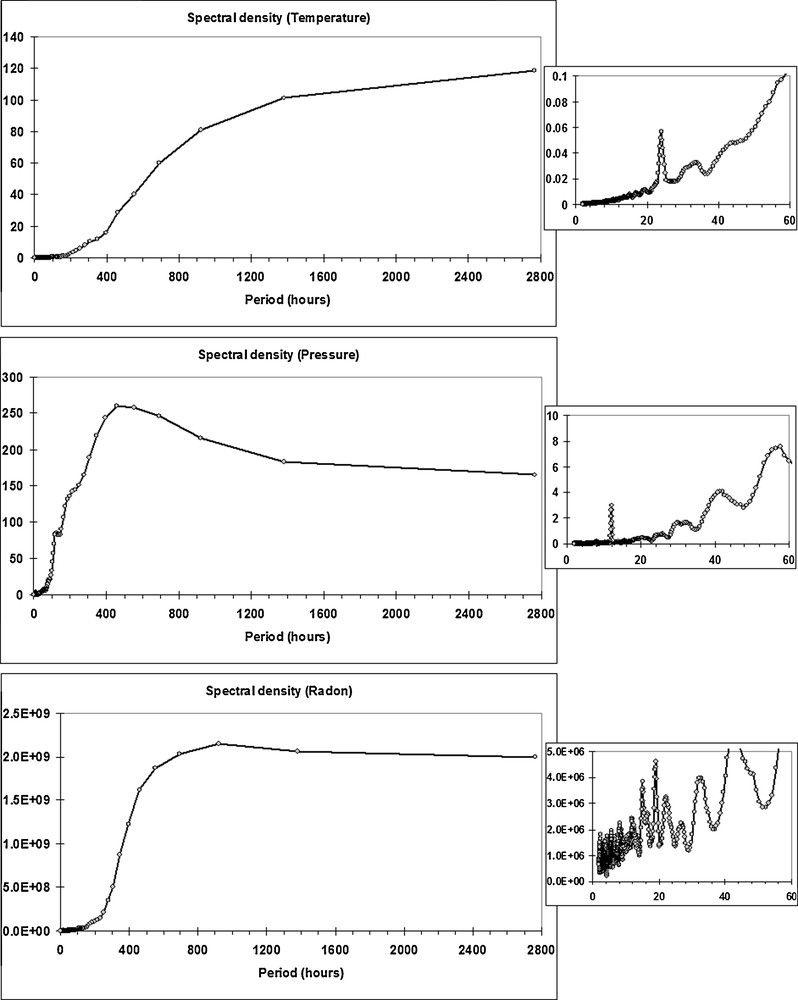
Spectral density analysis of Barasol probe data.
Analyse en densité spectrale des données acquises par la sonde Barasol.
Based on this observation, two full periods of 40 days are available through the records. To better compare these two time intervals, they have been brought together to a common temporal origin (Fig. 6). Moreover, to enhance the readability of the figure, we chose to represent the 12 hours moving average rather than the hourly variations. The common origin is taken at a period of reduced activity, close to 60,000 Bq/m3. A remarkable synchronicity appears when comparing these data. Around 8 days after the registration of the minimum radon activity, and following the appearance of a very short burst 24 to 36 hours after that minimum, a peak of the radon activity occurs, followed by a period of slow decline. Subsequently, a secondary peak of activity is visible, before activities decrease again to reach their lowest values.

Comparison between two 40-days long radon activity cycles.
Comparaison de deux cycles de 40 jours sur les activités radon.
This period of about 40 days does not seem to be directly dependent from lunar/solar and terrestrial tides, whose main periods are 12 and 24 hours with harmonics at 15 and 30 days (Cagniard, 1960). A possible link to cyclical CO2 fluxes at depth, and thus, to an activity underneath the study area (of geodynamic, of magmatic type?), may be the most likely phenomenon that could explain these temporal variations.
5 Conclusion
In connection with natural hazards issues and gas hazard in Lake Pavin, quantitifications of CO2, O2, helium and radon contents in soils have highlighted an area rich in gas, of mofette type. Such structures are not unique across the Massif Central (the Neyrac-les-Bains mofette in Ardèche; the “dog cave” in Chamalières and the Brissac geyser in Saint-Maurice-ès-Allier, Puy-de-Dôme), as well as the numerous carbogaseous occurrences reported e.g. by Matthews et al. (1987). As a consequence, the existence of a CO2 degassing zone in such a geological context does not constitute, in itself, a sign of magmatic reactivation. However, the concomitance of high CO2 and high helium concentrations confers to the Escarot mofette an original feature in the Massif Central. Examination of other parameters, including chemical and isotopic composition of groundwater, will be in the future associated with these soil gas measurements, to bring additional data that could help to constrain fluid dynamism near the mofette. The Escarot area seems to have its own dynamism, which appears at first sight dominated by a pulsation close to 40 days. Apart from this particular area, no area susceptible to experience significant CO2 emissions is highlighted. Soil CO2 concentrations are very frequently lesser than 5%, levels that occur naturally during periods of photosynthetic activity, even in areas completely devoid of recent Quaternary volcanic activity.
Acknowledgments
This study has been funded by the “Direction Départementale de l’Équipement” (Natural Risks Department) of the Puy-de-Dôme district and the BRGM Research Division. The authors are indebted to P. Rocher for having initiated this research project.
The authors would also like to thank B. Henry for chromatographic analyzes, C. Flehoc and E. Proust for isotope ratios measurements. Field measurements were held with the help of N. Audouin, M. Brach, G. Braibant, F. Jouin and D. Rouzaire (†).
Helpful comments from two anonymous reviewers are also gratefully acknowledged.