

1 Introduction
Interest in diffuse seismic waves has seen an extraordinary growth over the last decade, driven in large part by the promise of noise correlations to reveal seismic velocities and changes in the earth's elastic properties. Key to this was the observation (Lobkis and Weaver, 2001; Weaver, 2005; Weaver and Lobkis, 2001) that fully equipartitioned diffuse waves permit, on cross-correlating the apparent noise, retrieval of the Green function, where the Green function is the signal one would have at one receiver if the other were replaced with an impulsive force. Further theoretical arguments (Roux et al., 2005a; Snieder, 2004; Wapenaar, 2004; Weaver and Lobkis, 2004), and laboratory demonstrations (Derode et al., 2003; Larose et al., 2004; Malcolm et al., 2004) in support of this conclusion quickly appeared.
Applications in long-period seismology have been particularly striking. Tomographic maps of Rayleigh wave velocity have been constructed (Lin et al., 2008; Sabra et al., 2005; Shapiro et al., 2005). The literature also reports retrieval of waveforms due to Love waves, and bulk waves (Roux et al., 2005b), and even to measures of Rayleigh wave anisotropy (Lin et al., 2008). Dense large arrays consisting of up to hundreds of seismic stations permit high resolution; the worldwide availability of their daily records for periods of years lends itself naturally to the necessary kind of data processing.
The original theoretical basis for the relation is restrictive; ambient seismic noise fields are rarely fully diffuse in the required manner. Long-period seismic noise fields are directional. Nevertheless numerous researchers report robust retrieval of travel times between distant stations, both in the lab and on the earth's surface. This is now understood as a consequence of azimuthal variations of intensity being smooth and seismic stations tending to be well separated compared to a wavelength. Quantitative details are provided by Froment et al. (2010), Godin (2009), and Weaver et al. (2009). In this asymptotic limit, travel times are largely unaffected and ambient noise directionality is unimportant. While correlations are not identical to the Green functions, the seismic velocities inferred from their direct arrivals are valid.
This robustness does not apply, however, to the amplitudes of the correlation functions. Any program to examine noise correlation amplitudes in order to infer attenuations will require a thorough understanding of the effect of noise directionality. Correlation amplitudes are also affected by site amplification factors, detector gain, and wave focusing. A program to retrieve attenuation will be challenging but the payoffs are potentially large. A successful retrieval of attenuation will necessarily also retrieve site factors and noise directionality, with implications for detecting the scattering that may have affected the directionality and determining the site factors relevant to strong ground motion (Prieto and Beroza, 2008) in earthquakes. It is towards this goal that this work is directed. For simplicity, we will confine our attention, for the present, to 2D scalar wave systems without focusing (wavespeed is homogeneous) and without scattering, and to cases in which there are linear arrays of detectors.
Prieto and Beroza (2008) and Prieto et al. (2009) suggested that azimuthal and regional averages (at fixed detector separation r) of frequency-domain normalized correlations (“coherency”) can be compared to Bessel functions Jo(ωr/c) times a decaying exponential exp(−αr). From this comparison, (average) wavespeed c and (average) attenuation α may be extracted. The particular genius of this approach is that it obviates concerns over noise directionality; the azimuthal average renders the ambient field effectively isotropic. It is also conjectured that such averaging mitigates the effects of focusing and defocusing. That this correlation ought look like a Bessel function Jo is well established (Aki, 1957). That deviations from a Bessel function ought be ascribable to a factor exp(−αr) is less clear. Inasmuch as attenuation manifests as a complex wavespeed c, the quantity √r Jo(ωr/c) does not diminish with r like exp(−αr). It is readily seen, e.g. by plotting it or analyzing its asymptotic form at large r, that it increases like a hyperbolic cosine or sine. It is only the causal Green function Ho(ωr/c) that decays in a manner similar to exp(−αr)/√r. There is a further concern that wavespeed c may vary with direction due to material anisotropy, or with position. An azimuthal and spatial average would correspondingly incur a spurious attenuation due to phase cancellations unrelated to anelasticity or scattering. Comparison of coherency with a theoretical form like Jo(ωr/c) exp(−αr) is, in this author's opinion, problematic.
Cupillard and Capdeville (2010) considered the recovery of attenuation from correlations as obtained from numerical simulations of noisy wave fields. They found, for the case of uniformly distributed noise sources (and in accord with theorems saying that such noise field correlations ought be precisely the Green function), that both geometric and intrinsic attenuation could be recovered. This was the case regardless of whether or not one-bit preprocessing was applied. They also presented numerical simulation data for the case in which the sources were distributed over a finite area patch, and for which recovering attenuation was more difficult.
As an alternative approach to retrieving amplitudes and attenuation for general noise source distributions, we here start with the theoretical form that correlation takes in a two-dimensional wave field composed of diffuse attenuating plane waves having a smoothly varying noise directionality, or “ponderosity”, B(θ) (Weaver, 2011). The amplitude of the narrow-band correlation's ray arrival from site i to site j is
| (1) |
Additional influences on X may include focusing and defocusing of the ambient wavefield due to inhomogeneity of wavespeed. Here we neglect those effects and correspondingly confine the numerical examples to the case of spatially constant wave speed.
It is desired to retrieve information on α, and by implication also on B and s, from measurements of the X. This may be impossible if B is not constrained. But as discussed by Weaver (2011), B is not arbitrary; it varies in space and direction as governed by a radiative transfer equation (Ryzhik et al., 1996; Turner and Weaver, 1994) or RTE:
| (2) |
Ponderosity B is thus interpretable as ‘specific intensity’. It is the density (per direction angle) of diffuse wave intensity. It depends on direction and position . Here, α is the same attenuation as in Eq. (1). The left side indicates that intensity B in a given direction decays with distance along that direction like exp(−2α distance). It is noteworthy that α is responsible not only for the decay of the Green function and the noise correlation (Eq. (1)), but also for decay of the diffuse intensity B, and thus the prefactor in Eq. (1). The right side of Eq. (2) indicates that B is augmented by sources P. is also augmented by scattering, with strength p, into direction from waves at going in direction . For long-period seismology P is probably zero within the continents. Whether scattering p is negligible is less clear.
Equations (1) and (2) constitute a starting point for understanding ray arrival amplitudes, and thus for retrieval of attenuation and site factors from correlations of ambient noise. Even within the approximation that focusing and defocusing are unimportant and that site factors are scalar and local, inversion from the X to the α will be non-trivial. Before attempting more general cases, however, we wish to confirm that this picture is valid by examining the particular case in which there is a linear array of sensors, arrayed along a line of direction . This is a great simplification, but it is not impractical; dense linear seismic arrays are not uncommon. In this case, the above RTE simplifies.
| (3) |
where x is a coordinate along the linear array. Instead of an infinite number of directions, there are only two. There are two intensities of interest, B±, one for each of the two directions . Each B varies along the linear array. Each attenuates exponentially at a rate 2α in its direction of travel, and is augmented by sources S±. These sources may be intrinsic (P), or may be due to scattering (p) from other directions. It is particularly noteworthy that B does not decay geometrically.
The radiative transfer equation (2) simplifies even further in the case that S = 0, as would follow if both P and p vanish. The quantity p represents the scattering of Rayleigh waves into other Rayleigh waves and may or may not be important in practice, but for the present purposes we will assume it to be negligible. Under these conditions, B is determined entirely by two boundary values and the attenuation. It is not difficult to show that the theoretical expression for log X may then be written as a linear combination of the log s, the log B at the end points of the array, and the attenuations, thus permitting inversion for these parameters. That the parameters are over-determined can be accommodated by least squares minimization (if error estimates are available on the measured X) or singular value decomposition. As such, the inversion is unique and straightforward.
Given a set of N stations, there are N(N–1)/2 amplitudes X associated with each of the two directions, N(N–1) in all. (The auto correlations Xii depend on noise intensity in all directions, not just the strike direction, and are not useful for inversion on a linear array). In the absence of effective sources S within the array, the Xij depend on the two on-strike intensities at the end sites, the N site factors si and N–1 attenuations between neighboring sites. Inasmuch as the X are independent of a uniform rescaling of the s and an inverse scaling of the B, there are really only N-1 independent site factors. Thus there are 2N parameters to be fit by N(N–1) data values. The system is over-determined if N(N–1) > 2N, i.e. if N > 3. As discussed above, the inversion is a linear process. In the presence of effective sources p or P, there are 2N–4 additional parameters S to be fit, so the system is over-determined if N (N–1) > 4N–4, i.e. N > 4. That inversion is not linear. (Alternatively one could formulate the linear inversion of Eq. (1) without (3) in terms of N–1 attenuations and 2N–2 individual values of B, and N–1 independent site factors s, and afterwards infer the S). In either case arrival amplitudes X between pairs in a sufficiently long array will suffice to specify all parameters of interest.
2 Numerical experiments
Numerical simulations in support of the proposed approach are carried out on a discrete 271 × 271 mesh representing a square two-dimensional domain. The wave equation is solved using central differences with time step dt:
| (4) |
In the absence of forcing (f = 0) and with constant anelasticity σ, the difference equations (4) admit plane wave solutions:
| (5) |
| (6) |
For small k, i.e. long wavelengths and low frequencies, and negligible anelasticity, this is approximately , corresponding to an isotropic medium with unit wavespeed.
The chief interest here will be in waves in the x-direction (such that ky = 0) with frequency specified by a band pass filter in the vicinity of ω ∼ 2π/10. In the limit of small dt, the dispersion relation becomes
| (7) |
At this frequency kx is 0.6391 (wavelength 2π/kx is 9.831 mesh spacings); group velocity vg = dω/dk is 0.9493. In the simulations discussed below σ is a constant in the interior of the mesh, at a value of 4/271. Thus Imω is 0.0074 and attenuation α = Imω/vg = 0.0078 nepers per mesh spacing.
The domain is shown in Fig. 1 where the dark ring (of diameter 230 mesh spacings) represents the positions of the broadband Gaussian noise sources f. The sources are distributed uniformly in angle, at a fixed distance of 115 from the central point of the mesh. The thickness of the ring in the figure is a representation of the relative strengths of the sources (not the positions of the sources). The discrete dots indicate six receiver stations in a linear array. Attenuation is set high on the edges of the domain, to eliminate edge reflections. No scattering is included (p = 0). There are no sources within the array either (P = 0), so S = 0.
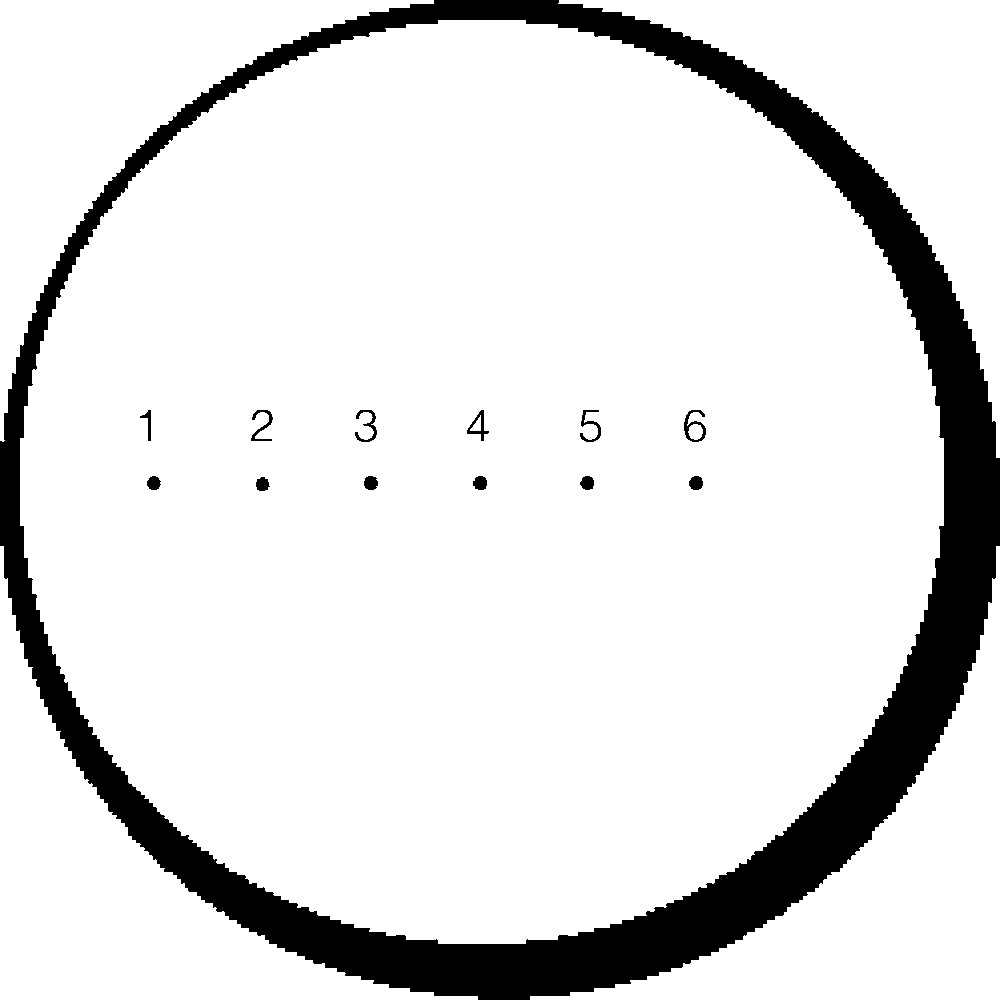
Sketch of the 271 × 271 region on which diffuse wave field was simulated. Gaussian noise sources were distributed uniformly in angle over a ring of radius 115 and unit width. The thickness in the figure represents the source intensity (3 + cos(θ + π/4))2. Thus the noise field is not isotropic. The locations of the six receiver stations (numbered 1 through 6 from left to right with interstation spacing of 27 units) are indicated by the dots.
Croquis de la région sur laquelle un champ d’ondes diffuses a été simulé. Les sources de bruit Gaussien ont été distribuées sur un anneau de diamètre 230 dont l’épaisseur de la figure représente l’intensité de la source (3 + cos(θ + π/4))2. Ainsi, le champ de bruit n’est pas isotrope. Les emplacements des six stations de réception (numérotés de 1 à 6 de gauche à droite, avec un espacement interstation de 27) sont indiqués par des points.
In order to compare with seismic scales, it is convenient to identify one time unit of the simulation (3.3 time steps dt) with one second. Assuming a seismic speed of ∼3 km/sec, one identifies the mesh spacings as 3 km, such that the source ring has a diameter of 700 km and the station separations are 81 km. The simulation is run for 225 time steps of dt = 0.3 s each, thus a scaled duration of four months. Fig. 2 shows a grey-scale snapshot of the wave field at a typical instant of time, with positive ψ in black and negative ψ in white. The received signal at each of the six stations was correlated with that at each of the others, filtered into a band centered on a period of 10 s (i.e. 33.3 time steps dt), stacked in the usual manner, and plotted. At this frequency, the station separation is 2.7 wavelengths. The specified attenuation corresponds to a seismic Q of 43. A typical stack is shown in Fig. 3.
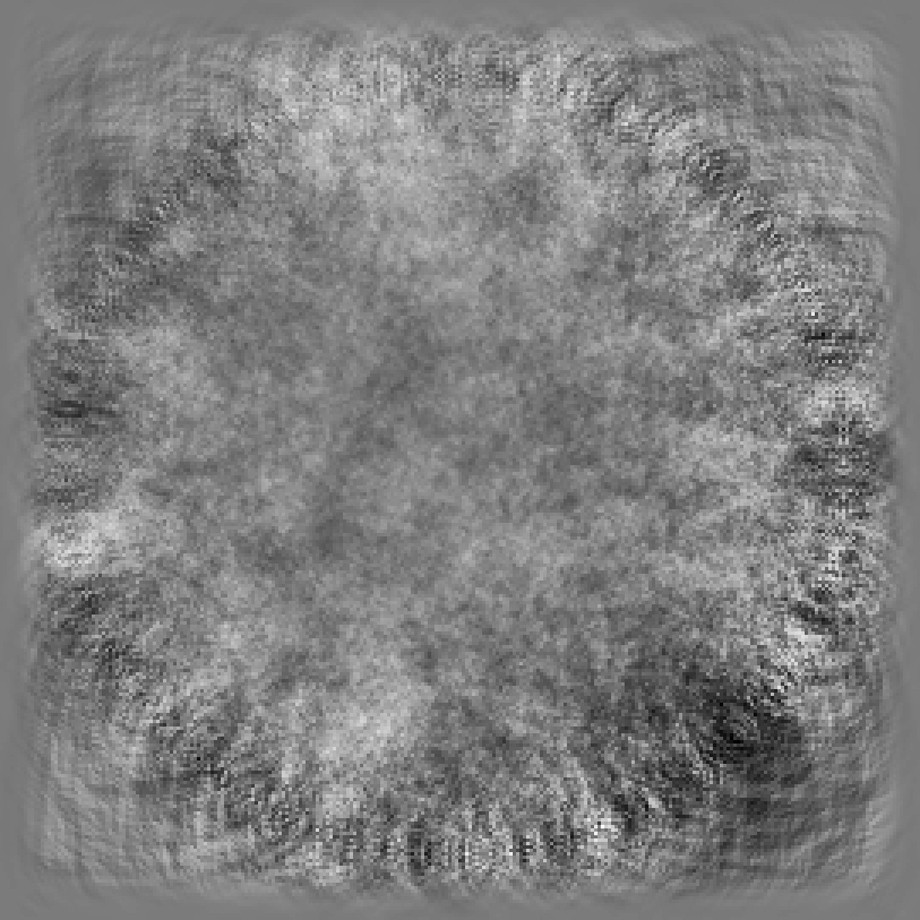
Snapshot of the simulation domain at a typical instant in time. The high intensity near the sources is evident, as is the high attenuation on the edges and modest attenuation across the interior. The simulation is broadband (a band pass filter is applied to the six records before correlation processing), hence the short length scale graininess in places.
Instantané du domaine de la simulation dans un instant typique. La forte intensité près des sources est évidente, comme l’est l’atténuation importante sur les bords, ou l’atténuation modeste à l’intérieur. La simulation est à large bande (un filtre bande de transition est appliqué aux six signaux avant traitement de corrélation), d’où la graininess de courte longueur d’onde sur l’image.
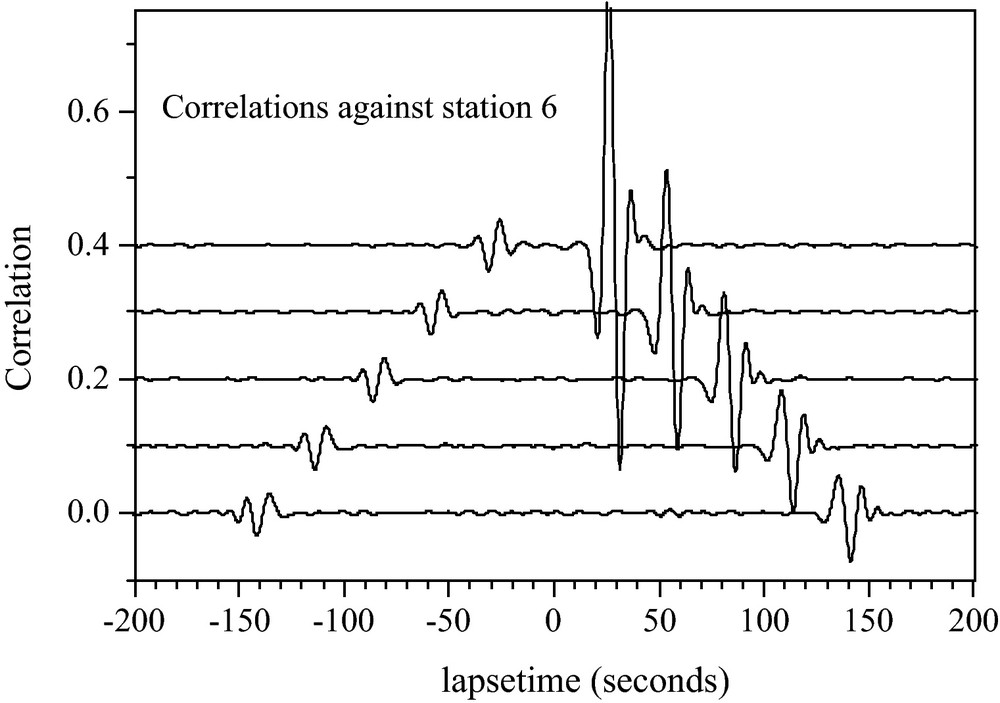
Stack of correlation waveforms between station 6 (the rightmost in Fig. 1) and the five others (from top to bottom are 6–5, …, 6–1, respectively). Temporal asymmetry is a consequence of the on-strike noise intensities in the two directions being not equal. Amplitude decay is evident at positive lapse time (propagation in direction from right to left, i.e., 6→5, …, 6→1). It is due to both geometric attenuation and anelasticity.
Addition des corrélations entre la station 6 (la plus à droite à la Fig. 1) et les cinq autres (de haut en bas, 6–5, …, 6–1, respectivement). L’asymétrie temporelle est une conséquence des intensités du bruit, non égales dans les deux directions. La diminution de l’amplitude est évidente au temps positif (propagation dirigée de la droite vers la gauche, c’est-à-dire 6→5, …, 6→1). Ceci est dû à la fois à l’atténuation géométrique et à l’anélasticité.
3 Extraction of attenuation from the correlations
Amplitudes X are extracted from correlation waveforms like those of Fig. 3 as the root mean square (rms) of the correlation over a period from 10 s before the theoretical ray arrival time to 10 s after (20 s corresponds to the inverse bandwidth i.e. the duration of the filtered autocorrelations). While unnecessary in the present simulations as dispersion is weak, in principle the amplitude of a ray arrival ought be identified with its rms, not its peak value. Following Eq. (1), (and taking all s = 1) the average attenuation along the linear array can be retrieved from a fit of the log of the geometrically-corrected amplitudes vs distance (Fig. 4). The results agree with the known value of 0.0078 nepers/mesh spacing. The vertical offsets of different fitted lines are due to different noise intensity at different originating stations. The RTE (3) tells us that the intensity B should diminish exponentially with distance along the array like exp(−2α * distance), but not geometrically. This prediction is confirmed by examining the amplitudes of the adjacent pairs (Fig. 5). This simple numerical simulation demonstrates retrieval of medium attenuation and noise intensity using the approach outlined above for the case of uniform site factors s and no internal sources P or scattering p. In particular it confirms that the prefactors B are governed by a radiative transfer equation.
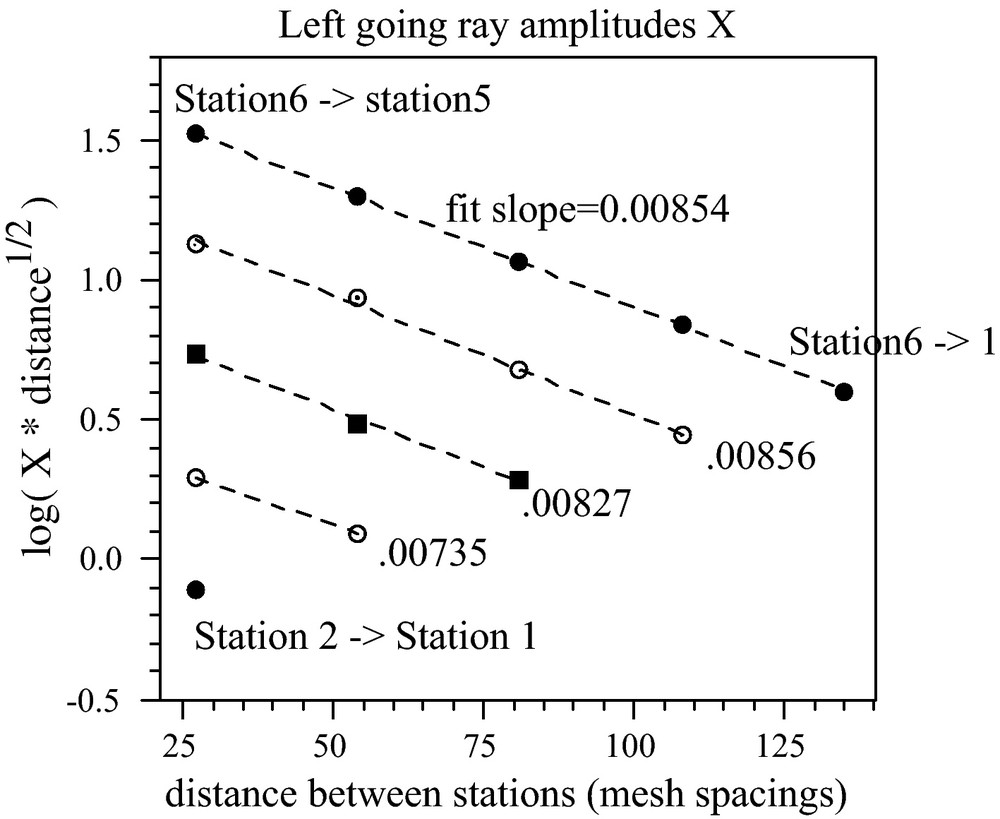
Amplitudes of the left-going rays in the simulations – after correction for geometrical attenuation – versus interstation distance in units of mesh spacing. The upper five points (filled circles) correspond to the amplitudes from station 6 towards all the others. The next set of four symbols (circles with central dots) corresponds to the amplitudes from station 5 to stations 4, 3, 2, and 1. Filled squares correspond to the amplitudes from station 3 to stations 3, 2 and 1, and so forth. Dashed lines are linear fits (slope in units of nepers/mesh spacing). The known value is 0.0078.
Amplitudes des rayons de la Fig. 3, allant vers la gauche (après correction de l’atténuation géométrique) en fonction de la distance interstations. Les lignes en pointillés sont des ajustements linéaires. La valeur connue est 0,0078.
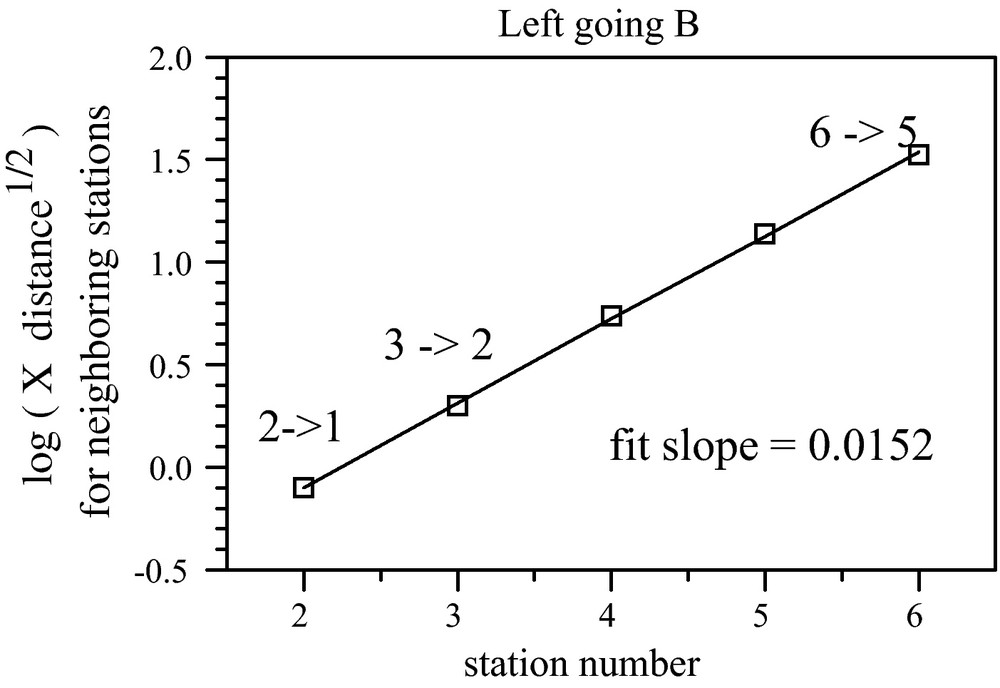
The left-most data points of Fig. 4, i.e. the offsets between the lines, corresponding to the left-going intensities B at stations 2 through 6, are seen to diminish with distance across the array like exp(−2α * distance along array), as predicted by the radiative transfer equation. The solid line is a best fit.
Les points les plus à gauche de la Fig. 4 correspondant à des intensités B qui vont à gauche dans les stations de 2 à 6, diminuent avec la distance au travers du réseau comme exp (−2α distance), tel que le prédit l’équation de transfert radiatif. La ligne continue est le meilleur ajustement.
Similar results are obtained using the amplitudes of the correlations from left to right (for example from station 1 to other stations). One curious observation is that the amplitudes at negative lapse time in Fig. 2 are nearly constant. This is, though, consistent with theory; it is a consequence of geometric and exponential attenuation and the differences between the right-going noise intensities B+ at the different stations. The rays at the negative lapse time of Fig. 3 are 5→6, …, 1→6. The amplitudes are Bi+ exp(−α distance)/sqrt(distance), where i is 5, 4, 3, 2 or 1, respectively. According to Eq. (3), Bi+ varies like exp(+2α distance). The net effect is exp(+α distance) divided by the square root of distance, which is roughly constant.
4 Simultaneous inversion for attenuation, site factors, and incident intensity
The above straight line fits are illustrative, but fits to linear functions of distance like those of Figs. 4 and 5 are both more restrictive than necessary and less restrictive than they could be. They are overly restrictive in that a straight line is appropriate only for identical site factors s and attenuation that is constant across the array. They are insufficiently restrictive in that separate fits for different originating stations (the four straight lines of Fig. 4), and for right-going and left-going waves, do not constrain the attenuation to be only a function of position . To illustrate a more general retrieval, the full set of all 30 amplitudes X was inverted by singular value decomposition for the B at the ends of the arrays, the site factors, and the interstation attenuations, twelve parameters in all. (The S were assumed to be zero).
Equation (3) was put in a form that represents the (log of the) B± at each of the stations as linear functions of the five interstation attenuations and the (log of) B+ at the left end and the (log of) B− at the right end. Similarly Eq. (1) was put in a form representing the (logs of the) Xij |xi − xj|1/2 as linear functions of the log s, the log B, and the five interstation attenuations. Combining these, one represents the (thirty distinct) log Xij |xi − xj|1/2 as linear functions of the (six) log s, the (five) interstation attenuations and the (two) end intensities B±. The sum of the log s was set to zero by absorbing an unknown scaling into the B. The resulting set of 30 linear equations in twelve parameters was pseudo-inverted by singular value decomposition, essentially a linear least squares procedure with uniform weighting.
This inversion procedure does not assume equal site factors s or uniform attenuation, nevertheless each site factor was correctly retrieved to within 2% of its known value (unity), and each interstation attenuation was correctly retrieved to within 10% of its known value . The inversion demonstrates recovery of independent site factors and independent interstation attenuations from correlations amongst a linear array of stations (for the case in which there are no sources S internal to the array). It thus endorses Eqs. (1–3) and correspondingly endorses the theoretical basis for retrieval of site factors and attenuations and specific intensities B in more general circumstances.
5 The effect of one-bit preprocessing
To reduce the influence of earthquake signals and to enhance the strength and bandwidth of the ambient noise correlations, ambient noise correlation studies have commonly applied data preprocessing that includes temporal normalization and spectral whitening. Lacking this, days of high noise intensity can dominate the averages and reduce the effective record length far below the nominal months. Lacking this, a record of months may be dominated by a few earthquakes and represent more the correlations of signals from a few point sources than a diffuse field. Common methods of temporal normalization include one-bit (Larose et al., 2004) and normalization using a running average. See Benson et al. (2007) for tests on preprocessing techniques. These data processing methods have been demonstrated to be highly effective at accelerating the convergence of the correlations and improving their signal-to-noise ratios.
However, such severe nonlinear preprocessing can cause problems in amplitude retrieval. Studies have shown that true amplitude may be poorly recovered after one-bit preprocessing when the ambient noise is not uniform (Cupillard and Capdeville, 2010; Larose et al., 2007). It has been suggested that amplitude information would be best recovered using raw data. The cost on the signal-to-noise ratio of doing this can be severe, however, and there may be other approaches.
The effects of one-bit operations on the amplitude of the correlation are difficult to quantify precisely. Nevertheless, it is clear why one-bit preprocessing distorts the ray amplitudes. Following the procedures of Cupillard et al. (2011) using their concepts of incoherent and coherent intensity and assuming the latter dominates, it is possible to show that the apparent amplitude of a ray arrival from site i to j after doing one-bit preprocessing is proportional to
| (8) |
This is confirmed by applying one-bit preprocessing to the above simulated data, and seeing that attenuation is not correctly recovered (Fig. 6). The fitted slope, 0.0062, is smaller than the known value 0.0078. This is consistent with the above argument that apparent attenuation is smaller when analyzing propagation away from the chief source of the noise (intensity is stronger on the right side of Fig. 1). Fig. 6 also shows that the quality of the straight line fits is poor and that the prefactors do not diminish with distance along the direction like exp(–2α × distance) as required by the RTE.
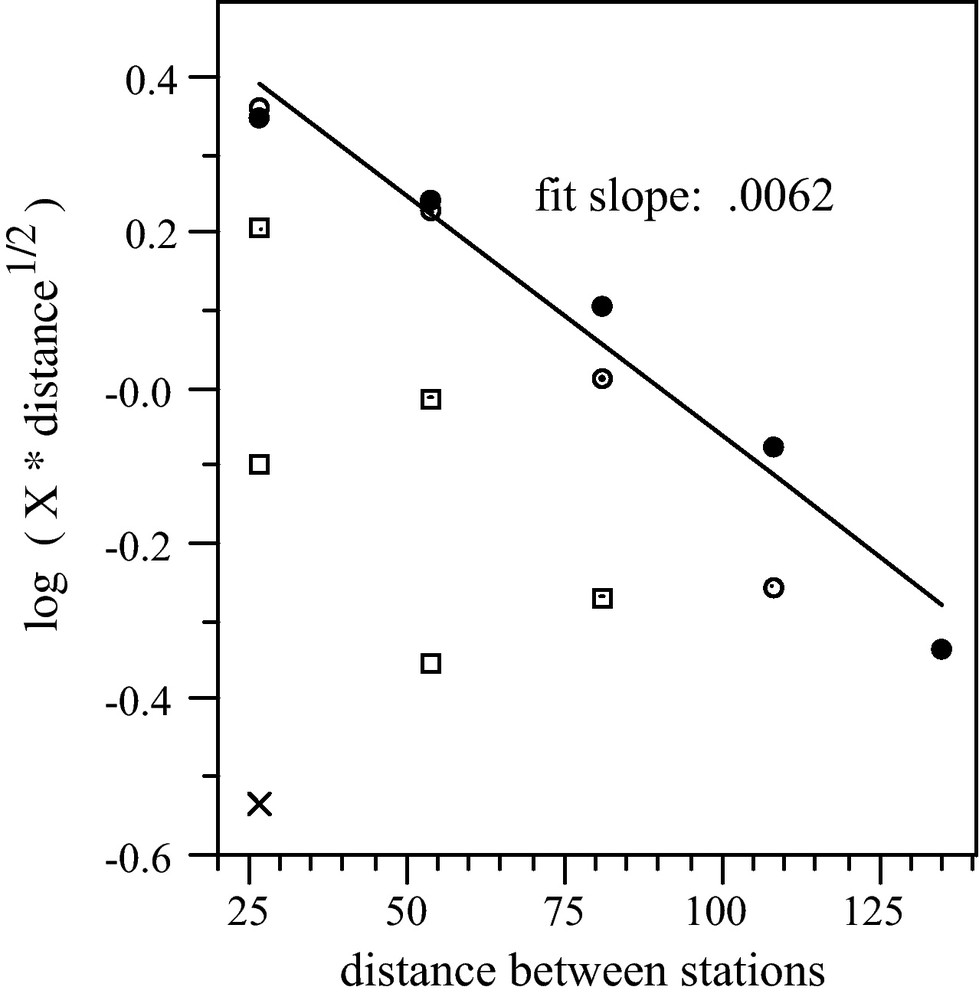
Amplitude decay in the correlations obtained after one-bit preprocessing of the simulated data. This figure should be compared with Fig. 4 from band-passed raw data without one-bit preprocessing. Symbols are defined as in Fig. 4.
Atténuation d’amplitude dans les corrélations obtenues après prétraitement one-bit des données simulées. On doit comparer cette figure avec la Fig. 4, à partir de données brutes de la bande de transmission sans prétraitement one-bit. Les symboles sont les mêmes que sur la Fig. 4.
One-bit preprocessing is attractive because it mitigates the effects of transients and accelerates convergence when noise intensity varies in time. It is simple but it is not always necessary. In order to retain rapid convergence amidst time-varying noise intensity, while preserving the relative gains at different stations, a different procedure is suggested here. If noise intensity varies slowly, more slowly than the propagation time across the array, it should suffice to do narrow-band temporal “flattening”, in which every station's band-limited signal is normalized by a running average of the array's total band-limited energy. Thus each station is treated equally so that relative amplitudes are preserved. Furthermore, one day of high noise will not dominate a month's averaging. In practice this recipe may call for rejection of periods of high amplitude transient seismic activity.
To demonstrate the procedure, new numerical simulations were conducted using the same parameters as above but with noise intensity increased by a factor of 16 for 1/16th of the time. Correlations were then generated using both the raw data and the flattened data. The relative amplitudes X of the arrivals were essentially the same for these two cases (and the same as originally) showing that apparent attenuation is not affected by flattening. In fact, the correlations from the flattening were identical to those of the original case using temporally-constant noise. The signal-to-noise ratio SNR, after preprocessing by flattening was also the same as originally. However, the SNR in the correlations of the raw data was degraded. Temporal flattening equalized the variable noise source, leading to faster convergence with all information being used, while (unlike one-bit preprocessing as in Fig. 6) preserving relative signal amplitudes between stations.
6 Summary
Disentangling the many factors affecting correlation amplitudes in order to reliably recover attenuation is challenging. It has been argued here that one key factor, noise intensity, or ponderosity, may be modeled by a radiative transfer equation and that this recognition is sufficiently constraining that we may hope to fit measured correlation amplitudes and retrieve attenuation, at least for the linear detector arrays considered here. Further work will require extending these ideas to two-dimensional arrays, to the case in which noise intensity is augmented by sources P and scattering p, to incorporating knowledge of confidence levels on the correlation amplitudes (essentially the SNR) so as to properly weight least squares minimization, and to the effects of focusing and defocusing due to spatially varying wavespeed.
Acknowledgements
The author's work was supported by a contract from Los Alamos National Laboratory. He thanks Xiaodong Song for helpful discussions, and in particular for performing the singular value decomposition pseudo inverse.