

1 Introduction
The study of paleoenvironmental records in continental domain is important to understand and model the climate evolution over recent periods (Preuser, 2009; Qing Yu et al., 2010; Senut et al., 2009). It is especially crucial for boreal and sub-boreal regions, which could be subject to significant environmental changes in the context of the present-day global warming (French, 2007). The study of sedimentary deposits in relatively small size saline lakes, which are very abundant in some of these regions, particularly in Siberia, could become relevant. As Sklyarov et al. (2010) recently suggested, the analysis of lake sediments could help to reconstruct recent changes in climatic and environmental parameters of the surrounding areas, completing therefore the studies and information collected through analysis of sediment cores from the large Siberian lakes, such as the Baikal Lake (Goldberg et al., 2010).
The Siberian lakes from the Lake Baikal Region are in specific tectonic settings, but also marked by a large range of salinity among the lakes, even in very small geographical areas. The origin of such variability remains poorly understood. It might reflect mixing processes in varying proportions of surface fresh waters with deeper saltier ones. It might also reflect secondary chemical evolution of lake waters, different from one lake to another. The actual origin of such a variability in lake water geochemistry should however be understood if one wants to use correctly the lake sediment geochemical signature as paleoenvironmental recorders.
The aim of this study is to provide novel information on the origin of the geochemical variability of the lakes by analyzing spring and lake waters from the Lake Baikal Region. This work includes the analyses of major and trace element concentrations along with Sr and U isotope ratios of a series of samples collected in 2001 and 2003. Such a multi geochemical tracing approach has been shown to be a powerful tool to constrain the origin and the evolution of surface water chemistry (Durand et al., 2005; Lucas et al., 2010).
2 Context and sampling locations
The springs and lakes sampled for this study are located in the Ol’khon Region, near the boundary of Siberian Craton with Caledonian Fold Belt, in Siberia, Russia (Fig. 1a-b). A few samples from the Anga River, a river draining the Ol’khon Region, were also collected for this study, and a sample taken from the Lake Baikal (see location on Fig. 1a). The structure of Caledonides of central Asia is the result of accretion of numerous terranes to the Siberian Craton during the Early Paleozoic collision processes (Fedorovsky et al., 1995; Fedorovsky, 1997). The Ol’khon Region is one of these terrains. It belongs to the Baikal Rift system, and lies between the Primorsky ridges and the Baikal Lake. It represents a plateau uplifted above Baikal Lake and oblique to the shoreline of the lake. It is a 700 km2 territory with a maximum elevation of 1055 m. The region is characterized by a typical steppe landscape, a hypercontinental climate marked by low precipitation (less than 200 mm/year in some places). The average annual temperature is about 0 °C. The rocks reported in this region are mostly metamorphic (Dobrozhinetskaya et al., 1992; Fedorovsky et al., 1993; 1995; Sklyarova et al., 2002).
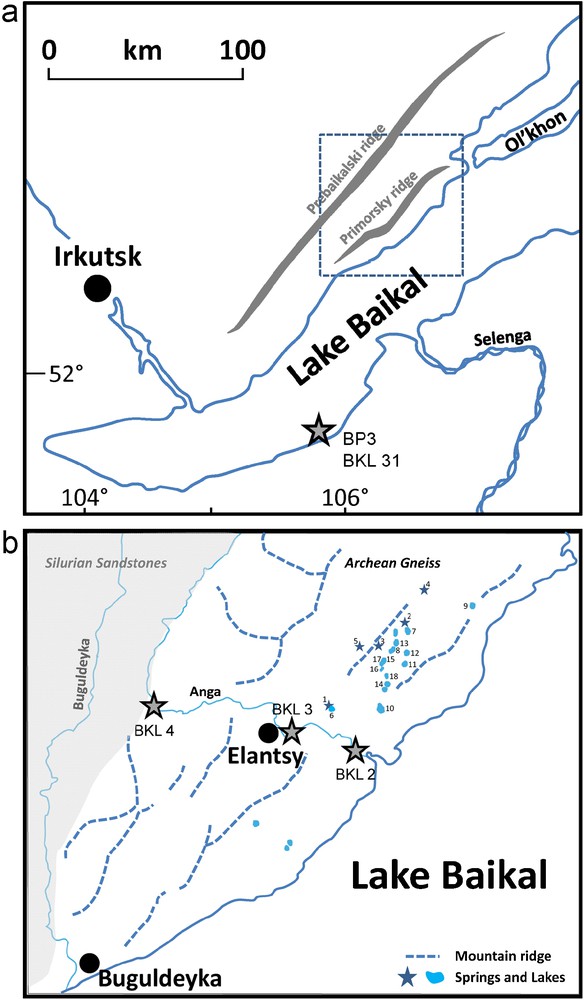
Map of the Lake Baikal Region (a) and location of the sampled springs, lakes and rivers (b).
Carte de la région du lac Baïkal (a) et localisation des sources, lacs et rivières échantillonnés (b).
Numerous springs and lakes are present in Ol’khon Region (Dzyuba et al., 1997; Sklyarova et al., 2002). Most of the lakes are very small (0.5–3 hectares) with a depth, which generally does not exceed two meters. The location of springs and saline lakes appears to be controlled by tectonics. The lakes are located within linear grabens and in pull-apart structures (Sklyarova et al., 2002). The first system coincides with ancient strike-slip sutures, whereas the second is discordant to all ancient structures and corresponds to a subsidiary pull-apart fracture system, related to recent sinistral strike-slip movements during the evolution of the Baikal Rift (Fedorovsky et al., 2003). Generally speaking, and as underlined in Sklyarova et al. (2002), springs and freshwater lakes in the Ol’khon Region are “located within the inherited faults or at their junction with pull-apart faults” whereas most of the brackish and saline lakes are located in basins associated with pull-apart faults formed under extension “during synrift (..) faulting”.
3 Sampling procedure and analytical methods
All the water samples, used in this study, were collected during two sampling campaigns in August 2001 and August 2003. The water samples have usually been collected at the middle of the lakes, at about 50 cm depth. Water samples (1 to 2 L) were filtered on site through 0.45 μm acetate cellulose filters. Aliquots for the measurement of major and trace element concentration analyses, and for U and Sr isotope analyses (about 1 L) were stored in pre-cleaned polypropylene bottles. Aliquots for determination of cations and trace element concentrations, and for U and Sr isotope ratios, were acidified to pH 1 with bidistilled HNO3. All the analyses were performed in Strasbourg, France, at the Centre de Géochimie de la Surface (now named Laboratoire d’Hydrologie et de Géochimie de Strasbourg) following the classical procedures used in the laboratory (Chabaux et al., 2005; Durand et al., 2005; Riotte and Chabaux, 1999). Cation concentrations were determined by flame atomic absorption spectrometry, using a Perkin Elmer 430 spectrometer. Anion concentrations were measured with a Dionex chromatograph. The detection limits for these methods are 0.001 mmol/L. The analytical reproducibility is better than 2%. The pH was measured with a Mettler DL40GP memotitrator, the conductivity with a Consort K511 conductimeter. Alkalinity was measured by Gran's titration (pH range 3.0 ± 4.04 single step procedure). DOC analyses were performed with a Shimadzu TOC 5000-analyser. For Sr isotope ratio analysis, Sr is separated and purified following the classical anion exchange resin procedure used in the laboratory (Riotte and Chabaux, 1999; Steinmann and Stille, 1997). 87Sr/86Sr ratios were measured on a VG Sector mass spectrometer using a dynamic multicollection and a W single filament technique. Analyses yield an uncertainty of 0.000015 (2 σ). The accuracy was controlled by regular measurements of the NBS 987 standard. The mean value for the 15 measured ratios is 0.710262 ± 12 (2 σ). It compares with published data by less than 0.1‰ (Lahd Geagea et al., 2007). The U isotopic compositions were determined with about 20 ng of U. After preconcentration by coprecipitation with Fe hydroxide, U was separated and purified using an ion exchange chromatography (Chabaux et al., 1997; Riotte and Chabaux, 1999 and references therein). The U isotope compositions were determined on a Thermo-Finnigan Triton using the single Re filament procedure with graphite. (234U/238U) was calculated from the measurement of 234U/235U isotope ratio assuming that 238U/235U = 137.88 and using the following decay constants: λ238 = 1.551 × 10⁻¹⁰ y−1 and λ234 = 2.823 × 10⁻⁶ y−1 (Akovali, 1994; Cheng et al., 2000). Analytical uncertainties of the 234U/235U ratio are about 0.005 (2 σ). The reproducibility and the reliability of the U isotopic analyses were controlled by analyzing the HU1 standard solution. The mean value for the 15 ratios measured during this work is 0.007567 ± 10 (2 σ) which is totally consistent with published data (Bagard et al., 2011; Chabaux et al., 2001; Durand et al., 2005; Granet et al., 2007, 2010; Ma et al., 2010; Pelt et al., 2008). The blanks of the whole procedure are less than 2 ng for Sr and 20 pg for U. They remain negligible compared to the amounts used for analyses.
4 Results
Major and trace element data, as well as 87Sr/86Sr isotope ratios and (234U/238U) activity ratios of all water samples are given in Table 1. Generally speaking, the Lake Baikal sample and the Anga river samples have lower concentrations than the spring waters, which are themselves less concentrated than the lake waters.
Concentrations en éléments majeurs et en éléments en trace – rapports isotopiques du Sr et de l’U pour les échantillons de sources, lacs et rivières analysés pour ce travail.
| Sampling name | pH | Conductivity μS/cm | Alk (meq/L) | Na+ mmol/L | K+ mmol/L | Mg2+ mmol/L | Ca2+ mmol/L | S+ (meq/L) | Cl- mmol/L | NO3- mmol/L | SO42- mmol/L | F mmol/L | |
| Springs | |||||||||||||
| 1 | BKL 104 | 8.24 | 871 | 5.76 | 3.64 | 0.26 | 2.05 | 1.30 | 10.6 | 1.04 | 0.004 | 1.82 | 0.07 |
| 2 | BKL 112 | 7.99 | 524 | 5.17 | 0.46 | 0.18 | 1.08 | 1.85 | 6.5 | 0.03 | 0.01 | 0.57 | 0.02 |
| 3 | BKL 113 | 7.95 | 365 | 3.23 | 0.36 | 0.14 | 0.60 | 1.28 | 4.3 | 0.03 | 0.05 | 0.42 | 0.02 |
| 4 | BKL 5 | 8.15 | 503 | 4.53 | 0.51 | 0.14 | 1.08 | 1.75 | 6.3 | 0.15 | 0.26 | 0.61 | 0.02 |
| 5 | BKL 6 | 8.20 | 601 | 3.48 | 0.54 | 0.07 | 1.08 | 2.37 | 7.5 | 0.09 | 0.02 | 1.92 | 0.03 |
| Lakes | |||||||||||||
| 6 | BKL 103 | 7.62 | 738 | 4.70 | 2.72 | 0.19 | 1.56 | 1.36 | 8.7 | 0.82 | 0.14 | 1.45 | 0.06 |
| 7 | BKL 111 | 8.87 | 904 | 7.38 | 2.32 | 0.83 | 3.76 | 0.63 | 11.9 | 0.57 | 0.003 | 1.82 | 0.05 |
| 8 | BKL 115 | 8.22 | 781 | 7.58 | 1.51 | 0.40 | 2.62 | 1.58 | 10.3 | 0.18 | 0.002 | 1.06 | 0.04 |
| 9 | BKL 1 | 8.57 | 1001 | 6.16 | 3.12 | 1.13 | 2.90 | 1.48 | 13.0 | 0.19 | 0.004 | 2.99 | 0.01 |
| 10 | BKL 105 | 9.08 | 1948 | 12.4 | 11.0 | 1.92 | 6.06 | 0.36 | 25.8 | 2.31 | 0.02 | 5.23 | 0.36 |
| 11 | BKL 107 | 8.84 | 4710 | 18.7 | 34.6 | 4.33 | 10.30 | 0.69 | 60.9 | 15.80 | 0.03 | 13.10 | 0.06 |
| 12 | BKL 108 | 9.23 | 5770 | 37.8 | 58.0 | 3.95 | 9.87 | 0.26 | 82.2 | 5.23 | 0.07 | 18.70 | 0.22 |
| 13 | BKL 117 | 9.18 | 4340 | 26.1 | 29.9 | 1.93 | 16.80 | 0.28 | 66.0 | 5.77 | 0.06 | 16.30 | 0.03 |
| 14 | BKL 106 | 9.84 | 7360 | 9.25 | 52.8 | 6.66 | 19.40 | 0.88 | 100.0 | 23.50 | 0.14 | 32.30 | 0.07 |
| 15 | BKL 114 | 8.76 | 4600 | 7.47 | 27.8 | 1.41 | 15.40 | 1.98 | 64.0 | 9.48 | 0.04 | 23.30 | 0.05 |
| 16 | BKL 118 | 8.63 | 3650 | 6.24 | 17.7 | 2.55 | 12.70 | 2.37 | 50.4 | 6.60 | 0.04 | 18.20 | 0.03 |
| 17 | BKL 9 | 8.80 | 4579 | 7.55 | 28.5 | 1.42 | 15.80 | 2.06 | 65.6 | 9.90 | 0.001 | 23.70 | |
| 18 | BKL 13 | 8.64 | 16338 | 17.0 | 140.0 | 13.00 | 22.30 | 1.32 | 200.2 | 124.00 | 0.001 | 30.40 | |
| Anga | |||||||||||||
| BKL 2 | 7.83 | 155 | 1.59 | 0.15 | 0.04 | 0.30 | 0.54 | 1.9 | 0.03 | 0.001 | 0.07 | 0.03 | |
| BKL 3 | 7.78 | 97 | 0.95 | 0.12 | 0.02 | 0.18 | 0.32 | 1.1 | 0.02 | 0.001 | 0.05 | 0.03 | |
| BKL 4 | 7.72 | 92 | 0.89 | 0.10 | 0.01 | 0.19 | 0.31 | 1.1 | 0.01 | 0.001 | 0.05 | 0.03 | |
| Baikal | |||||||||||||
| BP 3 | 8.05 | 104 | 1.03 | 0.15 | 0.02 | 0.13 | 0.39 | 1.2 | 0.02 | 0.001 | 0.06 | ||
| BKL 31 | 8.03 | 107 | 1.03 | 0.15 | 0.03 | 0.13 | 0.40 | 1.2 | 0.02 | 0.003 | 0.06 | 0.01 | |
| Sampling name | S- (meq/l) | H4SiO4 mmol/L | DOC ppm C | NICB (%) | Rb μg/L | U μg/L | Sr μg/L | Ba μg/L | 87Sr/86Sr | (234U/238U) | |||
| Springs | |||||||||||||
| 1 | BKL 104 | 10.5 | 0.23 | 12 | 0.8 | 0.67 | 5.36 | 1110 | 20.0 | 0.70932 | 2.071 | ||
| 2 | BKL 112 | 6.4 | 0.33 | 10 | 1.8 | 0.57 | 1.03 | 346 | 49.0 | 0.71110 | 1.524 | ||
| 3 | BKL 113 | 4.2 | 0.34 | 5 | 2.0 | 0.22 | 2.60 | 186 | 31.0 | 0.71158 | 1.930 | ||
| 4 | BKL 5 | 6.2 | 0.30 | 3 | 2.2 | 0.38 | 13.4 | 91 | 30.0 | 0.71044 | 2.208 | ||
| 5 | BKL 6 | 7.5 | 0.44 | 2 | 0.7 | 0.60 | 3.50 | 165 | 13.4 | 0.70883 | 1.722 | ||
| Lakes | |||||||||||||
| 6 | BKL 103 | 8.6 | 0.28 | 6 | 1.5 | 0.09 | 11.4 | 953 | 9.0 | 0.70924 | 2.116 | ||
| 7 | BKL 111 | 11.6 | 0.43 | 22 | 2.4 | 2.39 | 4.02 | 418 | 42.0 | 0.71058 | 1.998 | ||
| 8 | BKL 115 | 9.9 | 0.61 | 26 | 3.8 | 1.12 | 6.86 | 592 | 76.0 | 0.71115 | 2.238 | ||
| 9 | BKL 1 | 12.3 | 0.44 | 42 | 5.1 | 2.04 | 0.47 | 950 | 44.7 | 0.70942 | 1.415 | ||
| 10 | BKL 105 | 25.5 | 0.15 | 24 | 0.9 | 4.06 | 15.2 | 8316 | 122.0 | 0.70886 | 1.731 | ||
| 11 | BKL 107 | 60.8 | 0.08 | 79 | 0.2 | 1.34 | 19.7 | 206 | 6.0 | 0.71007 | 2.449 | ||
| 12 | BKL 108 | 80.7 | 0.03 | 104 | 1.8 | 5.20 | 60.6 | 305 | 15.0 | 0.71006 | 2.383 | ||
| 13 | BKL 117 | 64.6 | 0.11 | 71 | 2.2 | 3.25 | 11.4 | 868 | 28.0 | 0.70962 | 2.107 | ||
| 14 | BKL 106 | 97.3 | 0.02 | 77 | 2.5 | 0.83 | 1.08 | 151 | 3.0 | 0.70984 | 2.546 | ||
| 15 | BKL 114 | 63.6 | 0.41 | 33 | 0.5 | 3.05 | 10.2 | 4132 | 28.0 | 0.70922 | 2.135 | ||
| 16 | BKL 118 | 49.3 | 0.39 | 33 | 2.1 | 2.92 | 8.44 | 2100 | 24.0 | 0.70919 | 2.440 | ||
| 17 | BKL 9 | 64.9 | 0.39 | 22 | 1.2 | 2.75 | 7.25 | 240 | 24.3 | 0.70919 | 2.133 | ||
| 18 | BKL 13 | 201.8 | 0.18 | 75 | -0.8 | 14.9 | 15.9 | 1770 | 39.0 | 0.70946 | 2.986 | ||
| Anga | |||||||||||||
| BKL 2 | 1.8 | 0.18 | 7 | 5.2 | 0.76 | 1.70 | 106 | 16.8 | 0.76802 | 1.918 | |||
| BKL 3 | 1.1 | 0.19 | 7 | 5.1 | 0.60 | 1.60 | 54 | 11.2 | 0.80424 | 1.947 | |||
| BKL 4 | 1.0 | 0.18 | 7 | 6.8 | 0.51 | 1.35 | 48 | 9.0 | 0.79948 | 1.990 | |||
| Baikal | |||||||||||||
| BP 3 | 1.2 | 0.02 | 1 | 3.6 | 0.49 | 0.46 | 83 | 10.0 | 0.70858 | 1.924 | |||
| BKL 31 | 1.2 | 0.02 | 1 | 2.7 | 0.78 | 0.52 | 131 | 13.4 | 0.70788 | 2.042 |
As it would be apparent in Piper diagrams (not shown), where the relative proportions of the major cation and anion concentration data are plotted, the anionic charge of spring water samples is mainly controlled by alkalinity and the cationic one by calcium. The relative anionic concentration of Cl is limited. The proportions of SO4, Mg and Na + K are variable depending on the water samples. However, compared to spring waters, the anionic charge of lake waters defines a much larger range of variations between alkalinity and SO4 end-members. Lake water samples with chemical compositions overlapping those of spring waters in the anionic Piper diagram (not shown) are the less concentrated lake waters, with a conductivity ranging from about 700 to about 1000 μS/cm. Hereafter, they will be named ‘diluted lake waters’ whereas the other more concentrated lake water samples are named ‘concentrated lake waters’. They are enriched in Cl and/or SO4 and display a conductivity ranging from about 2000 to 16,400 μS/cm. Diluted and concentrated lake waters can also be distinguished on the basis of their cationic charge. The diluted lake water samples have cationic characteristics close to those of the spring water samples. Their cationic charge is mainly controlled by Ca and Mg. By contrast, the concentrated lake waters are significantly enriched in Na and K compared to both diluted lake and spring waters.
Sr isotope ratios of spring and lake water samples display very similar ranges of variation (Table 1): from about 0.7092 to 0.7101 for the concentrated lake waters, and from about 0.7088 to 0.7116 for the spring waters (Fig. 2). There is no simple relationship between the value of Sr isotope ratio and the location of the water sample in the basin, nor the kind of outcropping bedrocks. Spring and lake waters are marked by large 234U-excesses with (234U/238U) activity ratios from 1.415 to about 3.0. The highest (234U/238U) activity ratios are measured in the concentrated lake waters, as shown in Fig. 3 where the (234U/238U) activity ratios are plotted against the conductivity or the Na concentration. The samples from the Anga river and the Baikal lake have similar activity ratios, which are relatively high compared to the world river waters [(234U/238U) = 1171 in Chabaux et al., 2008], and comparable to those measured in the springs and diluted lakes of the Ol’khon region. By contrast, the Sr isotope ratios in the Anga river (0.76802–0.80424) are significantly higher than those measured in the other water samples analyzed in this study (from 0.70788 to 0.71158). This is certainly due to differences in lithologies (Silurian sandstone and Archean gneiss) drained by the Anga river compared to the bedrock lithology (only Archean gneiss) in the Ol’khon area (Fig. 1b).
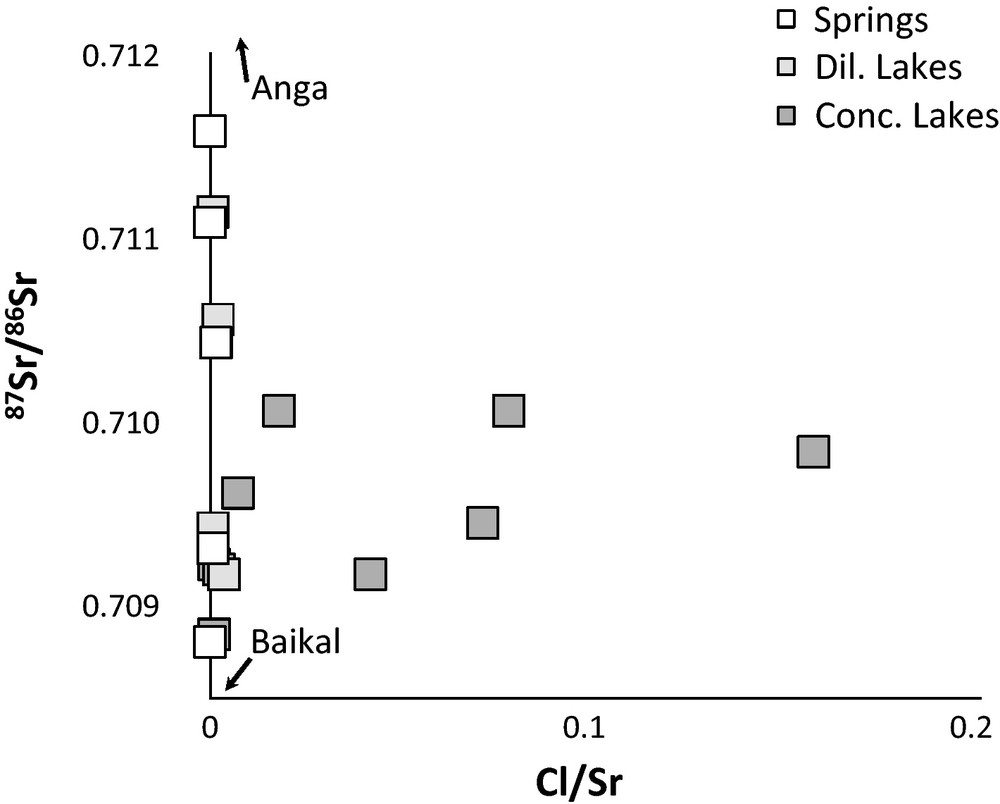
Variations of Sr isotopes ratios against Cl/Sr elemental ratios.
Variation des rapports isotopiques du Sr en fonction du rapport élémentaire Cl/Sr.
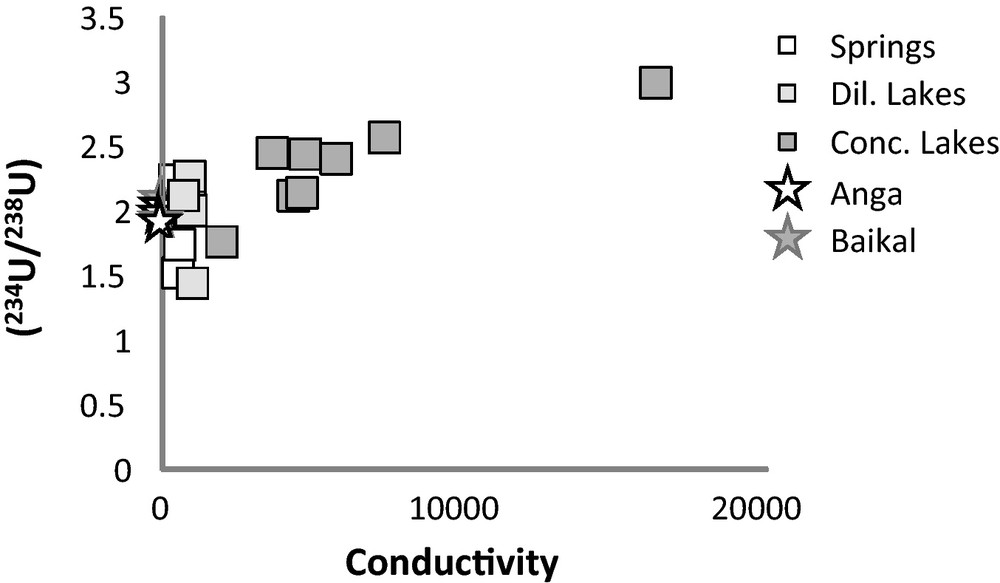
Variations of U isotopes ratios against conductivity.
Variations des rapports isotopiques de l’U en fonction de la conductivité.
5 Discussion
As presented in the previous section, the lake water samples can be subdivided into two groups: the diluted and the concentrated lake waters. Whereas diluted lake waters have chemical compositions quite similar to those of the spring waters, the concentrated lake waters are significantly enriched in Na and K relative to Ca and Mg, and in Cl and SO4 relative to alkalinity.
5.1 Water mixing or water concentration process?
A simple scenario explaining the range of variations of the conductivity and of the chemical compositions of the lake waters would involve an input of concentrated and Na-K-Cl-SO4-rich waters into fresh waters having geochemical characteristics similar to those of spring waters. The magnitude of the input would vary from lake to lake. Such a binary mixing scenario should however entail that, in mixing diagrams such as for instance X/Cl vs. Na/Cl (X = Ca, Mg, Sr, Ba, Si) or 87Sr/86Sr vs Cl/Sr diagrams, the data points representative of the lake water samples would plot along a linear mixing trend between a fresh water end-member, represented by the spring waters, and a highly saline end-member represented by the most saline lakes enriched in Na, K, Cl and SO4. This is clearly not the case (Figs. 2 and 4), therefore ruling out the simple binary mixing scenario. Incidentally, it can be noticed that in all these diagrams the characteristics of the Anga river and Lake Baikal samples are quite similar to those of the spring and ‘diluted lake’ waters, but systematically different of those of the ‘concentrated lake’ waters.
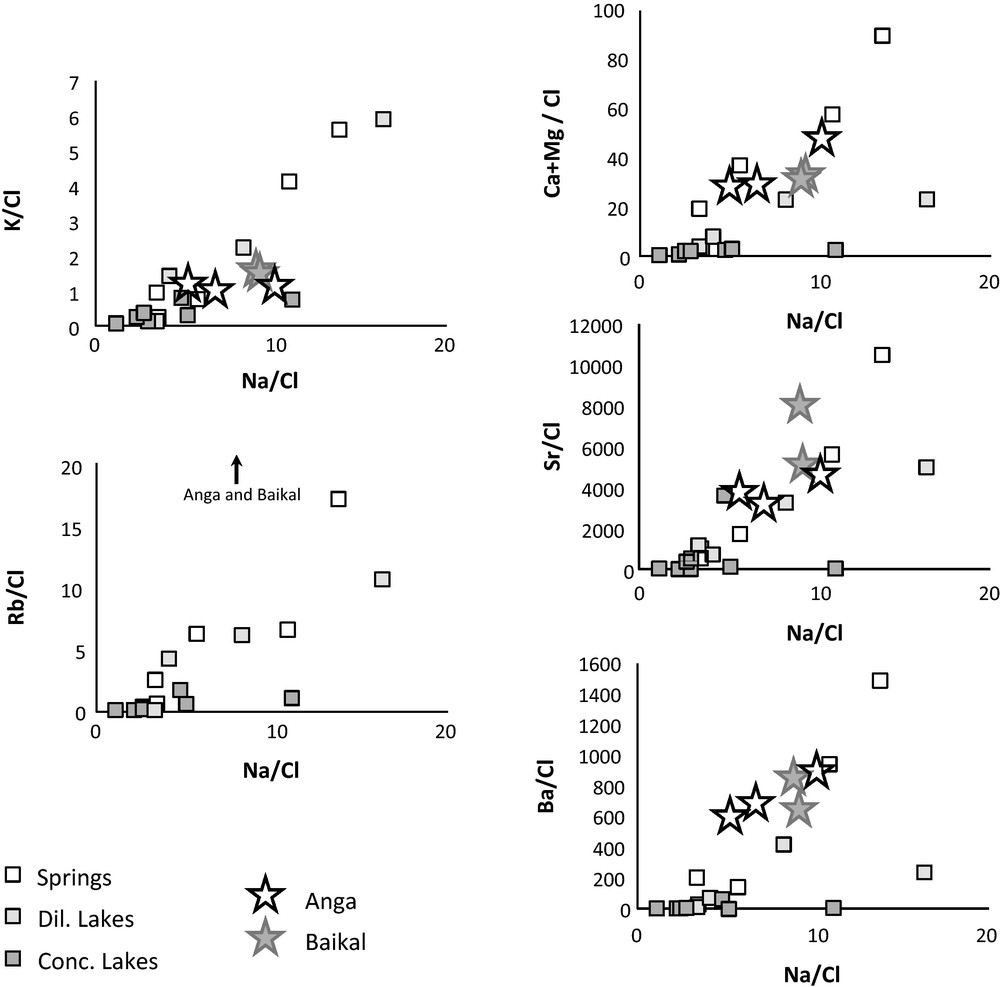
Position of the water sample data points in X/Cl vs. Na/Cl diagrams (X= K, Rb, Sr, Ba, Ca + Mg).
Position des points représentatifs des échantillons dans les diagrammes X/Cl vs. Na/Cl (X= K, Rb, Sr, Ba, Ca + Mg).
The observation that the lake and spring waters exhibit very similar Sr isotope ratio ranges of variation certainly outlines that the different Sr sources that control the Sr isotope ratios of the waters, such as bedrock minerals or atmospheric deposits, are not really different for lakes and springs. Such a geochemical similarity between lake and spring waters is not only found in Sr isotope ratios. It is also observed in X/Cl element ratios when X is an alkali metal (Na, K or Rb). By contrast it disappears when X is an alkaline earth metal such as Ca, Mg, Sr or Ba (Fig. 4). In this case, the X/Cl ratios are systematically lower in lake waters than in spring waters which could indicate a loss of alkaline earth elements in lake waters compared to spring waters. It might also indicate an input of Cl in lake waters; however such a scenario has already been ruled out (see above). Usually, the first minerals to precipitate during evaporation of natural waters are alkaline earth metal bearing minerals, whereas alkali metal bearing minerals only precipitate when water has reached a sufficiently high degree of concentration (Jones and Deocampo, 2005). For this reason, and on the basis of our data, we propose that the range of variations of chemical composition and conductivity of the lake waters results from a water evaporation or water concentration process. Such process would vary in intensity from lake to lake leading to different degrees of elemental concentration and of secondary salt mineral precipitations. The region investigated in the present study is indeed under hypercontinental climate (e.g., Sklyarov et al., 2010; Vogt et al., 2010). Such a climate is dry and can therefore induce a net elemental concentration process due to evaporation in summer and/or to cryogenesis in winter.
The assumption that the lake water salinity is mainly controlled by concentration processes was investigated using the EQL/EVP program (Risacher and Clément, 2001). This numerical code has been computed to simulate the evaporation of freshwaters to high concentration at temperatures equal or above 0 °C. The thermodynamical parameters controlling the dissolution and precipitation of natural minerals are indeed usually given or determined for temperatures above 0 °C. The results of such simulation can be therefore questioned as in this Siberian region mean monthly temperatures can significantly drop under 0 °C, especially in winter. However, as the mean annual temperature remains close to 0 °C, we consider that the results of the simulation performed at 0 °C can be seen as a first and realistic approximation.
The code calculates the chemical composition of waters during an evaporation process, using activity coefficients based on the Pitzer's interaction model, which makes possible their calculation to high ionic strength. The set of mass-action equations is solved through a Newton-Raphson method (for details, see Risacher and Clément, 2001). The results of an evaporation process, occurring at 0 °C at equilibrium with atmosphere, for the five spring waters collected and analyzed in this study are given in Fig. 5, where the concentrations of the major cations are plotted against the chloride concentrations. The data points representative of the lake waters are also plotted on the diagrams. The numerical simulations were run until the salinity reaches 100 g/L, the highest order of salinity measured in the study lakes. The simulations point out that intense evaporation/concentration of spring waters leads to the precipitation of first Ca and Mg-carbonates, then of sulfate minerals such as gypsum and even mirabilite for a salinity higher than 50 g/L (Fig. 5). This is in agreement with the occurrence of carbonates and gypsum reported by Sklyarov et al. (2010) in a sediment core from a saline lake in the same area, and with the observation of mirabilite in the hollow of dried-up lakes in the Barguzinskaya Rift zone (Akulov and Rubtsova, 2011), a geographical area very close to the study region, and hence submitted to a very similar climate and hydrological working. Furthermore, it appears from Fig. 5 that such a simple evaporation scenario accounts relatively well for the geochemical characteristics of the lake waters. In all the X versus Cl logarithmic diagrams, the data points of lake waters plot to the first order along the evaporation trends of the different spring waters. All these observations certainly argue for the simple ‘concentration/evaporation’ scenario we propose to account for deriving the geochemical characteristics of the lake waters from spring type waters.

Simulation of the evaporation of freshwaters to high concentration at 0 °C, for Na–Cl (a), Ca–Cl (b), Mg–Cl (c). Grey squares: data points representative of the different lake samples. White squares labeled 1, 2, 3, 4, 5 are the spring waters 1, 2, 3, 4, 5.
Simulation de de l’évolution chimique d’eaux douces s’évaporant à 0 °C, dans les diagrammes Na–Cl (a), Ca–Cl (b), Mg–Cl (c). Les carrés gris sont les points de données, représentatifs des différents échantillons de lacs. Les carrés blancs dénommés 1, 2, 3, 4, 5 représentent les eaux de source 1, 2, 3, 4, 5 à partir desquelles ces simulations ont été réalisées.
5.2 Coexistence of “diluted” and saline lakes
Two main parameters have to be taken into account in order to explain the coexistence of lakes with low salinity and others with higher salinity in the same geographical area. The first concerns the input of feeding water into the lakes as compared with the water loss through evaporation or any other concentration process. As the climate is homogeneous at the scale of the study area, the relevant parameter in this case would be the input of feeding water into the lakes. Because the diluted lakes and the saline ones are located in slightly different structural settings, one might assume that the input of feeding waters would be more important for diluted lakes than for saline ones. The other parameter to take into account for explaining the range of salinity of lake waters observed in the Ol’khon Region, is the duration of the concentration process. If such a time parameter were the key parameter, this would mean that saline lakes have undergone a longer period of water concentration than the diluted ones. Field observations and lake sediment datings indicate that the age of the lakes can be variable at the scale of the study area. In the Ol’khon Region, it was observed, for instance, that some lakes dried out for quite long periods of time, and that, new lakes were formed during the past 10 or 20 years (Sklyarova et al., 2002; Sklyarov, pers. comm.). Furthermore, 14C-datings analyses have pointed to ages as old as 8000 years for lacustrine sediments of a saline lake of the Ol’khon Region (Sklyarov et al., 2010), indicating that some of these lakes can be old.
U isotopic data show that time is probably an important parameter to be taken into consideration for explaining the large range of lake salinities. As shown in the result section, the (234U/238U) activity ratios of the most concentrated lake waters are higher than those of the spring and diluted lakes in contrast to Sr isotope ratios which exhibit very similar ranges of variations for diluted and salt lake waters. Such a difference can be the consequence of a longer period of water-rock interactions between lake waters and lake sediments in the concentrated lakes than in the diluted ones. Indeed during water-rock interactions the behavior of 234U and 238U isotopes is not similar, i.e., 234U tends to be more enriched in waters than 238U. This is explained by the well-known alpha-recoil process: during the alpha radioactive decay of 238U into 234Th, which decays very quickly into 234U, the recoil energy can be sufficient so to eject the 234Th isotope outside the crystal lattice, or if not ejected, the 234Th isotope is in a damaged lattice compared to that initially occupied by the parent nuclide 238U. Thus, during the water-rock interactions 234U is either directly ejected into the surrounding water, or becomes more mobile than 238U (for more details, see Ivanovich and Harmon, 1992; or Chabaux et al., 2003; 2008). Consequently, for similar physical characteristics (same water-rock ratios, same grain size, etc.) the water enrichment in 234U compared to 238U will be all the more greater than the duration of water-rock interaction will be longer. Assuming, for the studied lakes that the enrichment of 234U in water is only controlled by the ejection of 234U out of the crystal lattice of the sediment minerals, then the (234U/238U) activity ratios in lake waters will obey the following relationship (Henderson et al., 1999):
In the case of sediment and water of the study lakes, the following parameters can be proposed: r = 10 μm, α = 0.055 μm, 238Used = 80 ppm (Sklyarov et al., 2010), 238Uwater = 5 ppb i.e., the mean value in spring waters, ρsed = 2.8 g/cm3 (as carbonates and biotite are the main minerals of the lake sediments, Sklyarov et al., 2010), ρwater = 1 g/cm3, φ = 0.7 (Sklyarov, pers. comm.), λ234 = 2.83 × 10⁻⁶ y−1. Using these values a time of about 4000 years is calculated for the (234U/238U) activity ratio of lake waters to increase from about 2.2 (i.e., the highest U activity ratio in spring and diluted lake waters) to 3.0 (i.e., the U activity ratio of the most concentrated lake waters). Such an age is a minimum age, as the calculation implicitly assumes that all the lake water is in contact with the sediment. This age is also very dependent on the mean values retained for the model parameters, especially the water and sediment concentrations in U, and the sediment porosity. For instance, the age will range from 2400 yr to 6400 yr when the mean sediment porosity varies from 0.6 to 0.8%. It will vary from 2100 yr to 5500 yr for a variation of the U concentration in feeding waters from 3 to 7 ppm and from 2900 yr to 4900 yr for a U concentration in the sediments ranging from 60 to 100 ppm.
This age estimate remains therefore a first order approximate. It is, however, important to notice at this stage that it is entirely consistent with the age of 8000 years inferred for the sediments of a saline lake in the same geographical area (Sklyarov et al., 2010). Such a consistency can be considered as a first argument indicating that the duration of the concentration by evaporation process can be a parameter playing a leading part in explaining the salinity range of the lake waters in the Ol’khon Region. If it were assumed that the water flux feeding the different lakes had similar geochemical characteristics, it might be then concluded that the most saline lakes in the Baikal Region would be the oldest ones. Assuming similar concentration processes of the lake waters (evaporation in summer, cryogenesis in winter) at the scale of the study area, such a relationship between the age of the lakes and salinity of their waters might indicate that the water supply of the saline lakes has been stable for a much longer time period than that of the freshwater lakes. The two types of lakes are located in slightly different tectonic settings (Section 2). Therefore one should assume, in the above scenario, that the hydrology of these two tectonic contexts evolved differently over the recent past. In turn recent tectonic movements could induce changes in soils and/or bedrocks associated or not to spatial variations of the frozen soil thicknesses. At this stage, such assumptions remain clearly working hypotheses, which need to be further discussed on the basis of further investigations focused on the hydrological and hydrogeological contexts of the region and/or on the study of salt lake sediments. This relationship between the age of the lake and their salinity would indeed disappear if the different lakes were fed by waters with different geochemical characteristics, especially for their U concentrations. Nevertheless, it is important to stress that the U data obtained on the lakes of the Ol’khon region confirm that these lakes can be quite old and hence the lake sediments relevant paleoenvironmental recorders for the last few ky. Due to the abundance of lakes in the Lake Baikal Region, the geochemical study of their bottom sediments could help constraining the response of the Lake Baikal Region to Quaternary climatic variations, at a much finer spatial scale than that obtained up to now by analyzing only sedimentary deposits of the Baikal Lake. Such an information is relevant to fit, at a regional scale, the results of global climatic models and to generate a much more precise regional modeling of the response of the past, present and future climate changes in the Baikal Lake Region.
6 Conclusions
The geochemical (major and trace element concentrations, Sr and U isotope ratios) study of spring and lake water samples of the Ol’khon Region, Siberia, confirms the large range of salinity and of geochemical compositions of the lake waters in this geographical area. Our data point out that the geochemical data cannot be explained by a binary (conservative) mixing scenario between a surface freshwater and a deeper and saltier water. The geochemical variations, observed at the scale of a few square kilometers, should rather result from changes due to a secondary concentration process of the waters through evaporation in summer and/or cryogenesis in winter, which varies intensity from lake to lake. The U isotopic data suggest that one important parameter to take into account for explaining the salinity range of the lake waters is the total duration of the evaporation process, implying possible old ages for these lakes. The U data confirm therefore that the sedimentary deposits at the bottom of these lakes can be used as regional paleoenvironmental recorders of a given geographical region for the past several thousand years. The potential of this novel tool remains now to be fully explored.
Acknowledgements
This work was part of the Cooperative Research project 2986 CNRS/Russian Academy of Sciences. N. Clauer and B. Fritz are thanked for their help in establishing the French/Russia Cooperation. Daniel Million is acknowledged for the analyses of major element concentrations, and René Boutin for the trace element analyses. Discussions with José Honnorez and comments on the manuscript have helped us to improve it. Reviews by two anonymous reviewers and comments by the Editor, Marc Chaussidon, helped us to improve the manuscript. This is an EOST-LHyGeS contribution.