

1 Introduction
The coastlines of the Earth are composed of about 80% of rocky coasts (Emery and Kuhn, 1982). These coasts are composed of either consolidated or unconsolidated rocks such as clay (Collins and Sitar, 2008). It is crucial to be able to forecast cliff recession rate as a function of the local forcing parameters and the different underlying physical mechanisms should be understood. The main factor controlling cliff erosion is wave attack, but to mention a few others, tidal cycles (Kanyaya and Trenhaile, 2005), lithology, and living organisms (Nesteroff and Mélières, 1967) also play a role. In this work, we focus on erosion controlled by wave attack.
Wave-driven cliff erosion involves several processes. The wave impact creates a notch (Trenhaile et al., 1998) at the bottom of the cliff which grows until the weight of the overlying cliff exceeds the material strength, causing cliff collapse (e.g. Hampton, 2002; Young and Ashford, 2008). This collapse is responsible for cliff retreat and sediment supply to the beach. Then wave-driven collapsed material transport modifies the sea bed morphology. In turn, wave dynamics is changed by sea bed profile evolution (Walkden and Dickson, 2008).
Damgaard and Dong (2004) performed a wet sand cliff erosion experiment in a wave basin with a constant slope. The cliff was located on a flat platform. Incident waves were generated with a wave maker allowing variable wave incidence. They concluded that the cliff recession rate exponentially decreases in time for normal waves and seems to be constant for oblique waves. In addition, the recession rate increases with wave height and period and decreases with cliff height.
The aim of the present work is to analyze the cliff erosion dynamics within scales compatible with laboratory scale because such in situ analysis is made difficult by the large time scales involved in natural systems. Here, the time scale considered is of the order of a day and the spatial scale is metric. We performed experiments in a wave flume where the wet sand cliff was located upon a constant slope (Fig. 1). We will introduce experimental set up and parameters in the next section. Then the self-organization of the sea bed morphology is studied. Then, the influence of the wave properties and sediment supply on cliff recession rate is analyzed. The results are discussed before conclusions are drawn.

Experimental device.
Dispositif expérimental.
2 Experimental setup/method
In the present work, the experiments were carried out in a 5 m-long, 14 cm-wide and 25 cm-high wave flume where only normal incident waves are allowed (Fig. 1). The flume is equipped with a flap wave paddle producing monochromatic waves with a height up to 5 cm and periods between 0.5 s and 2 s. The offshore water depth is d = 15 cm. A hard nearshore slope of tan(β) = 1/10 is used. The wet sand cliff is built on the slope (Fig. 1) with a cliff length Lc = 40 cm. The cliff height h is measured from the free surface at rest to the cliff top. Calcite sand with a median grain diameter d50 = 0.41 mm and a density ρs = 2.76 g/cm3 (fall velocity in water of ws = 5.45 cm/s) is used. After a cliff drainage of about 2 h, the flume is filled up to d = 15 cm. The bottom of the cliff is submerged and an initial notch appears during the filling of the tank. Then, the wave maker is activated.
Free surface position is measured by three capacitive probes (100 Hz sampling) located offshore (Fig. 1). Two PCO 2000 cameras have been used, one on the side of the flume (with a field of view 1 m × 25 cm) (Fig. 3c and 3d) to detect the water free surface and the bed and cliff positions, the other one above the flume (with a field of view 40 cm × 15 cm) to measure the cliff top position. At the beginning of each experiment (for 4 h), the video sampling rate is close to the wave frequency as the system dynamics is fast. Then the sampling rate is decreased to about 1/10 of this frequency until the end of the experiment. From video records, the free surface and the bed positions are measured.
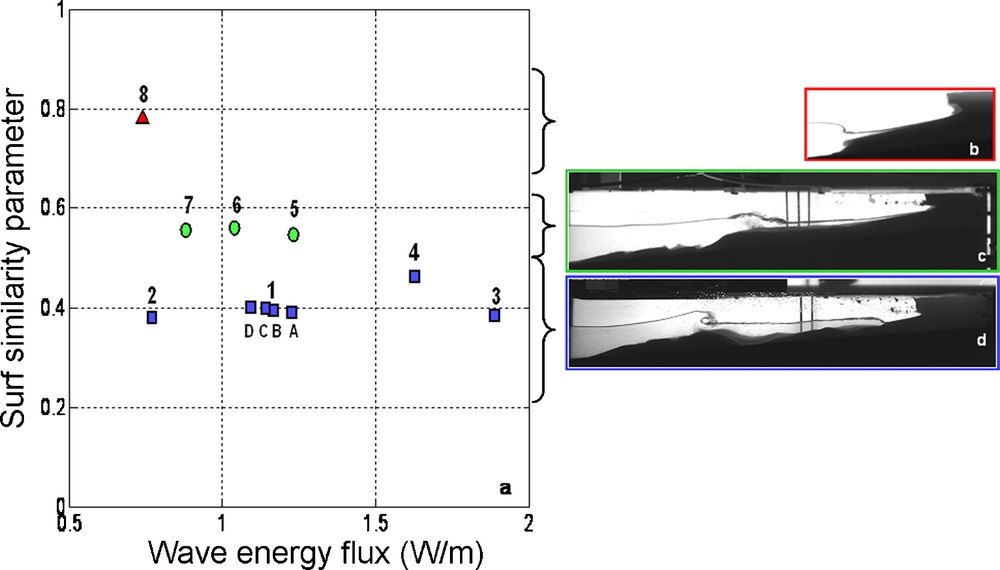
(a) Studied waves regimes in the (F, ξ) plane; symbols represent the sea bed profile type: steep planar (triangles) or gentle (circles) planar profiles and bared profiles (squares). Examples of side views for each type of profiles are (b), (c) and (d), respectively.
(a) Régimes de houle étudiés dans le plan (F, ξ) ; les symboles représentent le type de profil du fond : les profils plans à pente raide (triangles) ou à pente douce (cercles) et les profils à barre (carrés). Exemples de vues de côté pour chaque type de profil en (b), (c) et (d), respectivement.
The monochromatic wave climate is characterized by two parameters, the surf similarity parameter ξ and the incident wave energy flux F which are written:
| (1) |
| (2) |
Cliff erosion rate and bed evolution are studied as a function of incident wave energy, wave shape and cliff height. The conditions of experiments carried out are shown in Table 1.
Conditions expérimentales.
| Cases | Surf similarity parameter ξ | Wave energy flux F (W/m) | Cliff height hc (cm) | Dean parameter Ω | Mean reflection coefficient (%) |
| 1-A | 0.38 | 1.23 | 8 | 1.14 | 9 |
| 1-B | 0.39 | 1.17 | 8 | 1.10 | 8 |
| 1-C | 0.40 | 1.14 | 8 | 1.09 | 11 |
| 1-D | 0.40 | 1.09 | 8 | 1.07 | 10 |
| 2 | 0.39 | 0.71 | 8 | 1.05 | 6 |
| 3 | 0.38 | 1.89 | 8 | 1.22 | 12 |
| 4 | 0.46 | 1.63 | 8 | 0.89 | 11 |
| 5 | 0.55 | 1.23 | 8 | 0.58 | 18 |
| 6 | 0.56 | 1.04 | 8 | 0.53 | 12 |
| 7 | 0.56 | 0.88 | 8 | 0.63 | 12 |
| 8 | 0.79 | 0.73 | 8 | 0.34 | 34 |
| 1–5 | 0.40 | 1.12 | 5 | 1.07 | 9 |
| 1–10 | 0.39 | 1.27 | 10 | 0.97 | 14 |
| 6–10 | 0.54 | 1.04 | 10 | 0.66 | 9 |
3 Results
At the beginning of the experiments, cliff retreat is very fast and collapsed sediment quickly creates a sandy platform on the slope. In case 1 (reference experiment), the sea bed morphology rapidly evolves to a bared profile and plunging breaking waves are observed. Afterwards, the sand cliff recession rate decreases towards a steady profile (Fig. 2).

Spatial and temporal evolution of sea bed morphology for case 1-A; color scale represents the bottom elevation (in cm).
Évolution spatiale et temporelle de la morphologie du fond pour le cas 1-A ; l’échelle de couleur représente l’élévation du fond (en cm).
3.1 Bottom morphology
The influence of the wave parameters (F, ξ) (Fig. 3a) on the sea bed morphology is studied with a series of experiments carried out with the same cliff height hc = 8 cm. Three different types of sea bed morphology are distinguished depending more on ξ rather than on F (Fig. 3):
- • Planar and steep profiles for ξ greater than 0.7 (Fig. 3b). Waves break only when interacting with the backwash at the outward edge of the platform.
- • Planar and gentle profiles for ξ between 0.5 and 0.7 (Fig. 3c). Waves break above the outward edge of the platform. Spilling breakers are observed.
- • Bared profiles for ξ less than 0.5 (Fig. 3d). We observed either one (case 2) or two (outer and inner) sandbars (cases 1-A, 1-B, 1-C, 1-D, 3 and 4) depending on F. Breaking waves are of plunging type located above the outer sandbar.
Most of the observed profiles reach a steady state (see Fig. 2, for example). However, some cases evolve towards an unsteady state. For example, case 3 (F, ξ) = (1.89, 0.38) characterized by a bared profile at high energy flux shows a self-sustained sandbar oscillation (Fig. 4a). After some time (7 h 30 min), sandbars begin to migrate, landward for the outer bar and seaward for the inner bar (Fig. 5). This migration lasts for about 80 min. The return motion is faster and lasts for only 20 min. Then, the system becomes stable again for about 1 h, before another oscillation starts. In sum, the oscillation period is about 2 h 30 min. Outer and inner sandbar excursions are about 16 and 5 cm, respectively. Another case of a self-sustained sandbar oscillation is observed for a higher cliff (hc = 10 cm) with a lower wave energy flux ([F, ξ] = [1.27, 0.39] close to the case 1-A). The system dynamics is somehow different as bar oscillations are in phase and symmetric and the oscillation frequency is higher than in the previous case (with a period of about 30 min) but the amplitudes are approximately the same (Fig. 4b).

Same as Fig. 2 for: (a) (F, ξ) = (1.89, 0.38), hc = 8 cm (case 3) and (b) (F, ξ) = (1.27, 0.39), hc = 10 cm (bared profiles); color scale represents the bottom and cliff elevation (in cm). Black lines indicate the profiles plotted in Fig. 5.
Idem Fig. 2 pour : (a) (F, ξ) = (1.89, 0.38), hc = 8 cm (cas 3) et (b) (F, ξ) = (1.27, 0.39), hc = 10 cm (profils à barre) ; l’échelle de couleur représente l’élévation du fond et de la falaise (en cm). Les lignes noires indiquent les profils reportés sur la Fig. 5.
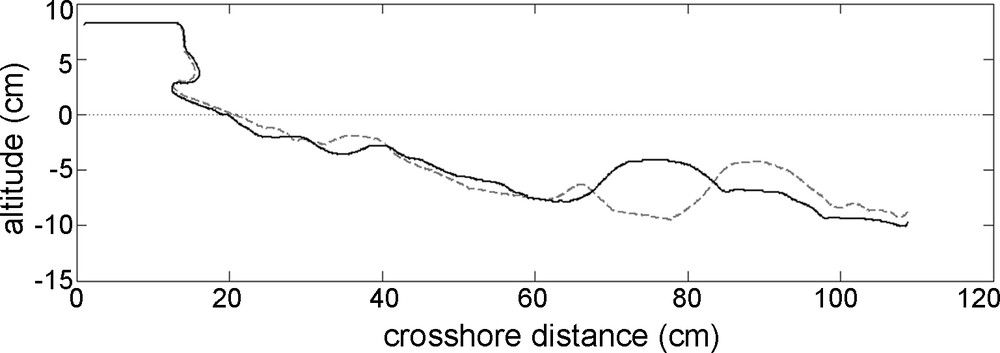
Sea bed morphology for case 3 at about 7 h (grey dotted line) and at about 9 h (black full line) (Fig. 4a).
Morphologie du fond pour le cas 3 à environ 7 h (ligne pointillée grise) et à environ 9 h (ligne pleine noire) (Fig. 4a).
3.2 Cliff recession rate
We study the cliff recession rate as a function of the wave parameters (F, ξ) and then as a function of the sediment supply. We see on Fig. 6 that for a set of four different realizations of the same case in the (F, ξ) plan (cases 1-A, 1-B, 1-C, 1-D) and despite the fact that the collapse events are different, the final cliff positions are very close. The variability in final cliff position is close to the variability of F for the various experiments (about 10%). We thus conclude that the cliff recession dynamics is reproducible in our experiment. The cliff recession rate increases for increasing wave energy flux (Fig. 6a) as observed by Damgaard and Dong (2004). For a given energy flux, we changed the surf similarity parameter, and thus the sea bed morphology. Cliff recession is larger for a gentle planar profile (case 5: 0.5 < ξ < 0.7) than for a bared profile (case 1-A: ξ < 0.5) (Fig. 6b). The final cliff position is the same for both a bared profile (case 2: ξ < 0.5) and a steep planar profile (case 8: ξ > 0.7) (Fig. 6b).

Time evolution of cliff position for (a) different wave energy fluxes and (b) different surf similarity parameters. Initial cliff position is Lc = 40 cm.
Évolution temporelle de la position de la falaise pour (a) différents flux d’énergie de houle et (b) différents paramètres de similitude de surf. La position initiale de la falaise est Lc = 40 cm.
The influence of sediment supply in the system is studied from two perspectives:
- (i) the periodic removal of the sandbar;
- (ii) the variation of the cliff height.
During a test where a bared profile develops (case 1: F = 1.19, ξ = 0.39), we removed the outer bar a couple of minutes after each cliff collapse (Fig. 7). Comparing to the experiment with the same wave parameters but without sandbar removal (Fig. 8), it appears that the cliff retreat is more important when the sandbar is removed, featuring an almost constant recession rate.

Same as Fig. 2, for the case 1 with sandbar removal.
Idem Fig. 2, pour le cas 1, avec prélèvement de la barre de sable.

Evolution of cliff position with and without sand bar removal. Cliff position is initially at Lc = 40 cm.
Évolution de la position de falaise avec et sans prélèvement de la barre de sable. La position de la falaise est initialement à Lc = 40 cm.
The sediment supply in the system is also controlled by cliff height. For approximately the same wave climate (case 1), we performed experiments for three different cliff heights (hc = 5, 8 and 10 cm). Fig. 9 shows that the total number of collapse events decreases with cliff height whereas average depth of a collapse event increases, and therefore average volume of a collapse event increases. Similarly to Damgaard and Dong (2004), we observed that for steady bared profiles the cliff recession rate decreases with increasing cliff height (5cm-high and 8 cm-high cliffs, Fig. 10). In addition, the same conclusion is reached for gentle planar profiles (case 6; hc = 8 and 10 cm).

Histogram of collapse depth for different cliff height (a): (F, ξ) = (1.12, 0.40), hc = 5 cm; (b): (F, ξ) = (1.09, 0.40), hc = 8 cm (case 1-B); (c): (F, ξ) = (1.27, 0.39), hc = 10 cm. Total number of collapse events: (a) 30; (b) 9; (c) 6. Average collapse depth: (a) 0.9 cm; (b) 2.6 cm; (c) 4.1 cm.
Histogramme de la profondeur d’effondrement pour différentes hauteur de falaise (a) : (F, ξ) = (1.12, 0.40), hc = 5 cm ; (b) (F, ξ) = (1.09, 0.40), hc = 8 cm (cas 1-B) ; (c) : (F, ξ) = (1.27, 0.39), hc = 10 cm. Nombre total d’effondrements : (a) 30 ; (b) 9 ; (c) 6. Profondeur moyenne d’effondrement : (a) 0.9 cm ; (b) 2.6 cm ; (c) 4.1 cm.

Evolution of cliff position for three different cliff heights. Cliff position is initially at Lc = 40 cm.
Évolution de la position de falaise pour trois différentes hauteurs de falaise. La position de la falaise est initialement à Lc = 40 cm.
We observe, however, that for bared profiles the cliff recession rate is larger for hc = 10 cm than for hc = 8 cm (Fig. 10) so that cliff retreat rate is not a monotonic function of cliff height. We should observe however that, the experiment with hc = 10 cm is characterized by a self-sustained sandbar oscillation, unlike other two experiments.
We conclude that, as far as the bed morphology is steady, the cliff recession rate diminishes for increasing cliff height.
4 Discussion
We classified the different types of bed morphology as a function of wave climate. We observed three types of bottom profiles, planar profiles with either steep or gentle slope and bared profiles which mostly depend on surf similarity parameter value, i.e. on the type of wave breaking. The wave energy flux does not seem to influence much the type of bed morphology (Fig. 3) but only the characteristic length and position of the morphological features.
Beach profiles classification has been proposed in the literature based on the Dean number value (Wright and Short, 1984). Here, we define the Dean number Ω with offshore wave parameters, as:
| (3) |
As we use a single grain diameter in our experiments, Ω evolves similarly as ξ. It means that the bottom morphology depends mainly on the Dean number as observed by Wright and Short (1984). Steep planar profiles are thus observed for Ω < 0.4, gentle planar profiles for 0.4 < Ω < 0.8 and bared profiles for Ω > 0.8 (Table 1). This dependency of bottom morphology on Dean number is qualitatively similar to those of Wright and Short (1984), although the boundary values are not similar which may be explained by the different definition of the Dean number, ours expected to have smaller values than the one of Wright and Short (1984).
Most of the bottom profiles reached a steady state. Steady profiles have been previously obtained in laboratory experiments (Grasso et al., 2009; Kamalinezhad, 2004; Wang and Kraus, 2005). Sandbar migrates onshore for moderate waves conditions and offshore for very energetic waves conditions (Gallagher et al., 1998; Ruessink et al., 2003). Such migrations have been observed in laboratory experiments (Grasso et al., 2009; Hoyng, 2008), and in nature (Certain and Barusseau, 2005). Moreover, unsteady states have been observed for bared profiles at high wave energy fluxes. To our knowledge, sandbar oscillations have never been reported for a constant wave forcing.
The cliff recession rate has been studied as a function of wave forcing. We observed that it increases for increasing wave energy flux. However, there is no clear tendency of the influence of the surf similarity parameter on the cliff recession rate due to different types of sea bed morphology. The sea bed morphology appears as of primary importance on cliff recession control. Interestingly, using numerical models Dickson et al. (2007) reach the same kind of conclusion that is cliff recession is moderately affected by wave change and strongly affected by the beach/platform morphology.
A periodic removal of the sandbar leads to a constant cliff recession rate. This result is similar to Damgaard and Dong (2004)’s observations for oblique waves leading to a constant recession rate, in a system where the sediment is removed by transportation by the longshore current. For different cliff heights, we observed the volume of collapse events increases for increasing cliff height, and cliff recession rate is more important for small cliffs provided that the bottom morphology is steady. For the two stable sandbar cases (case 1: hc = 5 and 8 cm), the final eroded volumes are very close whereas the final eroded volume is more important for the unstable profile (hc = 10 cm). These findings may indicate that the bed profile destabilization could be related to the crossing of a threshold value for the eroded volume of cliff material. In addition it might show that the eroded volume for stable cases is almost independent on cliff height.
If we consider the cliff erosional process as an analogue to a beach nourishment plan, the results from our experiments may show that an increase of the sand nourishment volume will result in a decrease of beach erosion up to a certain amount of filled sand as the bed profile may become unstable and thus lead to a larger erosion at the end.
5 Conclusions
Wet sand cliff erosion by regular waves has been investigated in an experimental wave flume. Our results show that the type of self-organized sand bed morphology depends mainly on the surf similarity parameter. Steep planar profiles are observed for ξ > 0.7, gentle planar profiles for 0.5 < ξ < 0.7 and bared profiles for ξ < 0.5. For bared profiles, we either observed steady or unsteady states in which the sandbars positions oscillate in the cross-shore direction.
The cliff recession rate depends mostly on the self-organized sea bed morphology. The cliff recession rate increases with the wave energy flux and is larger for a gentle planar profile than for a bared profile with the same wave energy flux. However, it appears to be similar for both bared and steep planar profiles with a constant wave energy flux. Thus, the sea bed morphology considerably influences the hydrodynamics and therefore the cliff recession. We have shown that the sediment supply plays an important role on cliff recession giving some insights into nourishment strategies.
Acknowledgments
We gratefully acknowledge PRES Université de Toulouse for its financial support, as well as Institut National des Sciences de l’Univers (INSU) and SHOM (“reliefs de la Terre program”), for additional funding of the “Rocky cliff erosion” project leaded by V.R. We also thank Serge Font, Sébastien Cazin and Hervé Ayrolles for valuable technical assistance.